Method for analyzing contents of trace arsine and phosphine in gas-phase propylene by gas chromatograph
A gas chromatograph and trace arsenic technology, which is applied in the field of analyzing trace arsine and phosphine content in gas phase propylene, can solve problems such as difficulty in meeting process analysis requirements, and achieve timely and effective process production and fast analysis speed
- Summary
- Abstract
- Description
- Claims
- Application Information
AI Technical Summary
Problems solved by technology
Method used
Image
Examples
Embodiment 1
[0036] Set the temperature of the purifier to 400°C, the temperature of the column oven to 50°C, the temperature of the detector to 60°C, the polarization voltage of the detector to 160V, the discharge voltage to 534V, and the discharge current to 6.88 A, backflush time 7min. Determination was carried out according to the above-mentioned steps for measuring samples, and the determination was repeated four times. The measurement results of Example 1 are shown in Table 1.
[0037] Table 1
[0038] Arsenic content
Embodiment 2
[0040] Set the temperature of the purifier to 402°C, the temperature of the column oven to 48°C, the temperature of the detector to 58°C, the polarization voltage of the detector to 158V, the discharge voltage to 533V, and the discharge current to 6.85 A, backflush time 8min. The determination was carried out according to the above-mentioned steps for determining the sample, and the determination was repeated four times.
Embodiment 3
[0042] Set the temperature of the purifier to 398°C, the temperature of the column oven to 52°C, the temperature of the detector to 62°C, the polarization voltage of the detector to 162V, the discharge voltage to 535V, and the discharge current to 6.70 A, backflush time 8min. The determination was carried out according to the above-mentioned steps for determining the sample, and the determination was repeated four times.
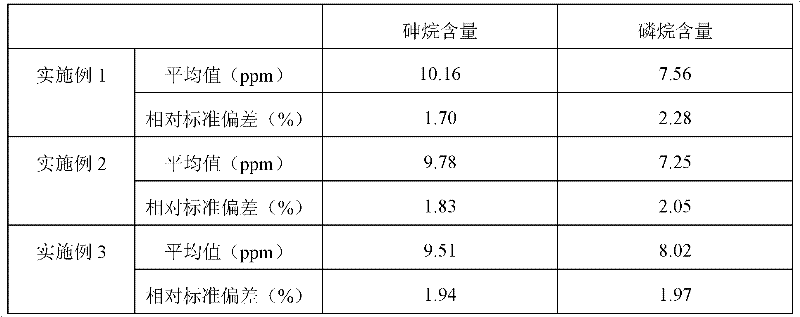
[0043] The respective mean values and relative standard deviations were obtained by calculating the experimental results of 1-3, and the calculation results are shown in Table 2.
[0044] Table 2
[0045]
[0046] It can be seen from the test results in Table 1 and Table 2 that the relative standard deviations of arsine and phosphine are small, which greatly meet the requirements of industrial analysis.
[0047] And, find out from embodiment 1, embodiment 2 and embodiment 3, utilize gas chromatograph to measure the content of arsine and phosphine in g...
PUM
 Abstract
Description
Claims
Application Information
 - R&D
- Intellectual Property
- Life Sciences
- Materials
- Tech Scout
- Unparalleled Data Quality
- Higher Quality Content
- 60% Fewer Hallucinations
Browse by: Latest US Patents, China's latest patents, Technical Efficacy Thesaurus, Application Domain, Technology Topic, Popular Technical Reports.
© 2025 PatSnap. All rights reserved.Legal|Privacy policy|Modern Slavery Act Transparency Statement|Sitemap|About US| Contact US: help@patsnap.com

