
Ordered binary decision diagram modeling method for distribution network fault recovery

A binary decision diagram, distribution network fault technology, applied in electrical components, circuit devices, emergency protection circuit devices, etc., can solve problems such as restricting practicability, complex programming implementation and logic, and difficulty in meeting the rapidity of fault recovery requirements.

Inactive Publication Date: 2013-07-10
SOUTH CHINA UNIV OF TECH
View PDF2 Cites 24 Cited by
  • Summary
  • Abstract
  • Description
  • Claims
  • Application Information

AI Technical Summary

Problems solved by technology

However, these methods have certain limitations. Mathematical programming methods generally need to perform approximation and simplification in the solution process, and there are serious dimension disasters that lead to excessive calculation time, which will be difficult to meet the rapidity requirements of fault recovery. In the process of traversal search, the heuristic method is very dependent on the numbering order of the nodes. The programming implementation and logic are complicated and it is difficult to guarantee the recovery effect. When the network scale is large, the artificial intelligence algorithm may prematurely converge to the local optimal solution, which restricts its practicability.

Method used


Image

  • Ordered binary decision diagram modeling method for distribution network fault recovery
  • Ordered binary decision diagram modeling method for distribution network fault recovery
  • Ordered binary decision diagram modeling method for distribution network fault recovery

Examples


Embodiment 1

[0043] Such as figure 2 As shown, it is the distribution network diagram used in this embodiment. The distribution network has 33 nodes in total, the active load is 3,715kW, the reactive load is 2,300kVar, and node 1 is a slack node. 12.66kV, the power reference value is 10MVA). There are switches on each branch, that is, the number of switches is equal to the number of branches, figure 2 In , the solid line represents the branch circuit equipped with isolating switch, and the dotted line represents the tie line equipped with tie switch. In this example, it is assumed that there is a failure near 9 nodes.

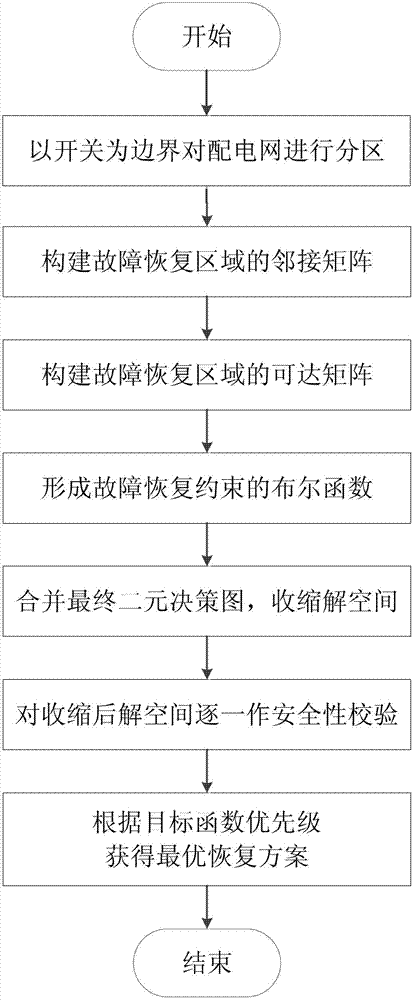
[0044] Such as figure 1 As shown, it is a control flow chart of the ordered binary decision-making graph modeling method for distribution network fault recovery of the present invention, and the specific flow of its control is as follows:

[0045] (1) If there is a fault near node 9, the section switch 8-9, 9-10 is disconnected to automatically isolate the fault, and ...

Embodiment 2

[0070] In this embodiment, except for the following features, all the other features are the same as those in Embodiment 1: if there is a fault near node 5, the spare capacity of the tie switch is all set to 480kVA, and the specific operation steps are as follows:

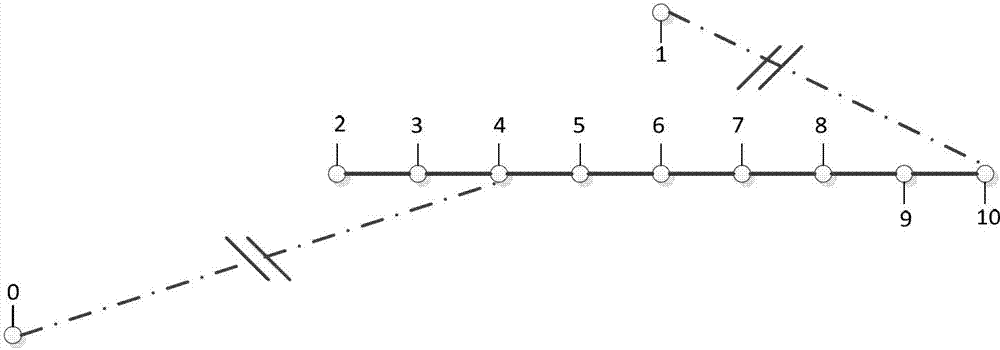
[0071] (1) When there is a fault near node 5, the section switches 4-5 and 5-6 are disconnected to isolate the fault. There are 21 non-fault outage areas, with a total of 20 section switches and 4 contact switches. Therefore, there are 24 decision variables, and the other side of the tie switch is equivalent to a power node, and renumbered together with the non-fault blackout area, as Figure 4 shown;

[0072] (2) Form an adjacency matrix:

[0073]

[0074] (3) Use the WarShall algorithm to form a reachability matrix P;

[0075] (4) Form various constraints:

[0076] a) Form a power constraint C 1 ,

[0077] Since the other side of the tie switch is equivalent to the power supply, the constraint can be expr...


PUM


Abstract

The invention discloses an ordered binary decision diagram modeling method for distribution network fault recovery. The method includes a first step of carrying out partition on a power distribution network, and using an on-off state as a decision variable, a second step of forming an adjacent matrix of the power distribution network according to a forming method of the adjacent matrix of an undirected graph, a third step of forming a reachable matrix of the power distribution network, a fourth step of forming boolean functions of each restriction of fault recovery, a fifth step of combining to generate a final binary decision diagram, and obtaining a contractive solution space, a sixth step of carrying out load flow calculation on feasible solutions one by one in the solution space after contraction, and carrying out safety verification, and a seventh step of obtaining an optimal recovery scheme according to priority levels of optimized objective functions. The modeling method has the advantages of effectively reducing the solution complexity of fault recovery problems, overcoming the defect that a traditional artificial intelligence algorithm is prone to premature convergence in local optimal solution, and improves understanding reliability and the like.

Description

technical field [0001] The invention relates to a distribution network fault recovery method, in particular to an ordered binary decision graph modeling method for distribution network fault recovery, which is suitable for fault recovery of a distribution network with a high degree of automation. Background technique [0002] With the development of the national economy and the improvement of people's material and cultural living standards, people's demand for electricity is increasing, and the scale of the power grid continues to expand, making the electricity market more stringent for power quality, requiring the power system to provide more Safe, reliable, economical and high-quality electric energy; as far as the entire power system is concerned, it can be divided into a transmission system and a power distribution system. The power distribution system is usually called a distribution network. For each user, distribution network and transmission network are divided accor...

Claims


Application Information

Patent Timeline
Patent Type & Authority Applications(China)
IPC IPC(8): H02H7/26H02H3/06
Inventor 汪隆君王钢张竣淇李海锋钟庆
Owner SOUTH CHINA UNIV OF TECH
Learn More