Two-dimensional scattered data density drawing method

A point data and density technology, which is applied in the field of two-dimensional scattered point data density mapping, can solve the problems of difficult representation of quantitative information of mathematical characteristics, density estimation, density estimation results optimization and processing, etc.

Active Publication Date: 2014-12-10
HANGZHOU NORMAL UNIVERSITY
View PDF3 Cites 6 Cited by
  • Summary
  • Abstract
  • Description
  • Claims
  • Application Information

AI Technical Summary

Problems solved by technology

[0005] Density mapping using the spatial gradient distribution information mapping color index of the density distribution has been realized by related software at home and abroad. However, the density estimation methods and the optimization and processing of the density estimation results are different. The most important thing is

Method used


Image

  • Two-dimensional scattered data density drawing method
  • Two-dimensional scattered data density drawing method
  • Two-dimensional scattered data density drawing method

Examples


Embodiment Construction

[0075] The present invention will be further described below in conjunction with accompanying drawing.

[0076] A two-dimensional scatter data density mapping method, specifically comprising the following steps:

[0077] Step (1). Optimized layout of two-dimensional density grid;

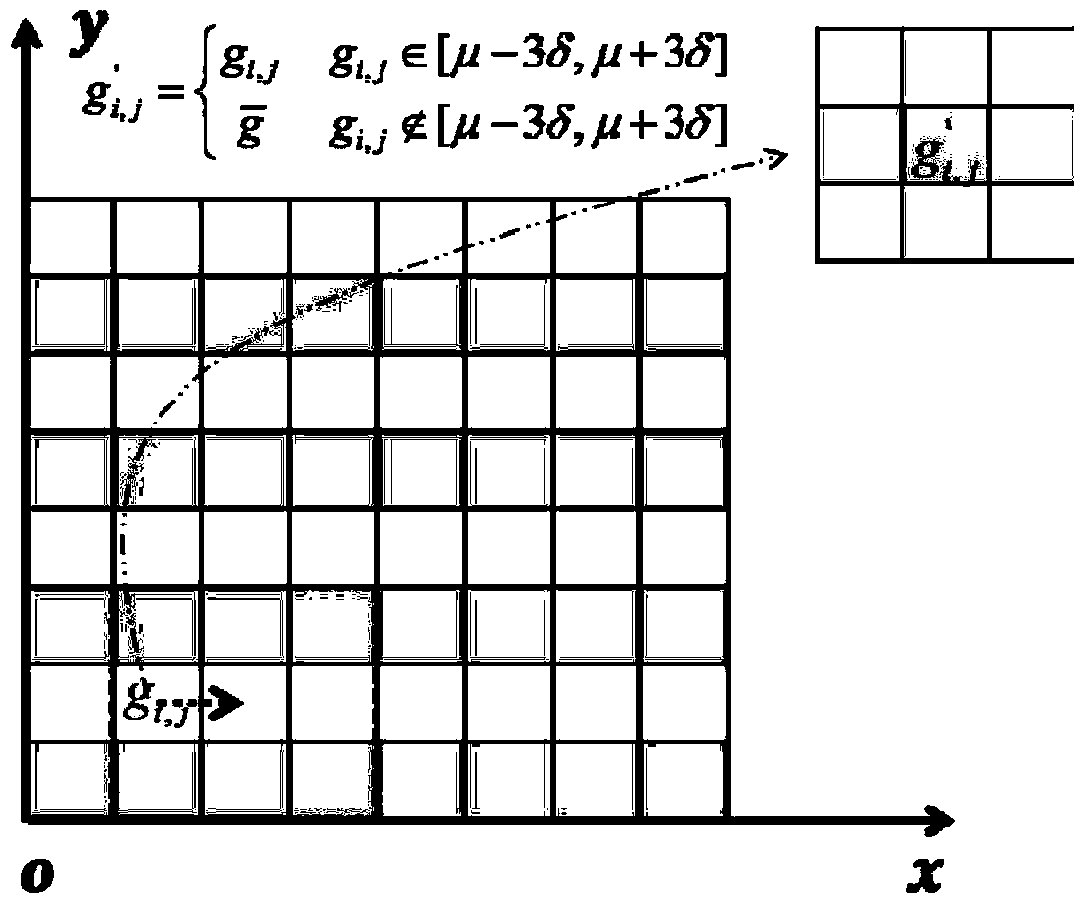
[0078] Step (2). Density grid frequency result plane smoothing;

[0079] Step (3). The color scale and contour line representation of the density attribute;

[0080] Step (4). Density distribution percentage statistics and visualization.

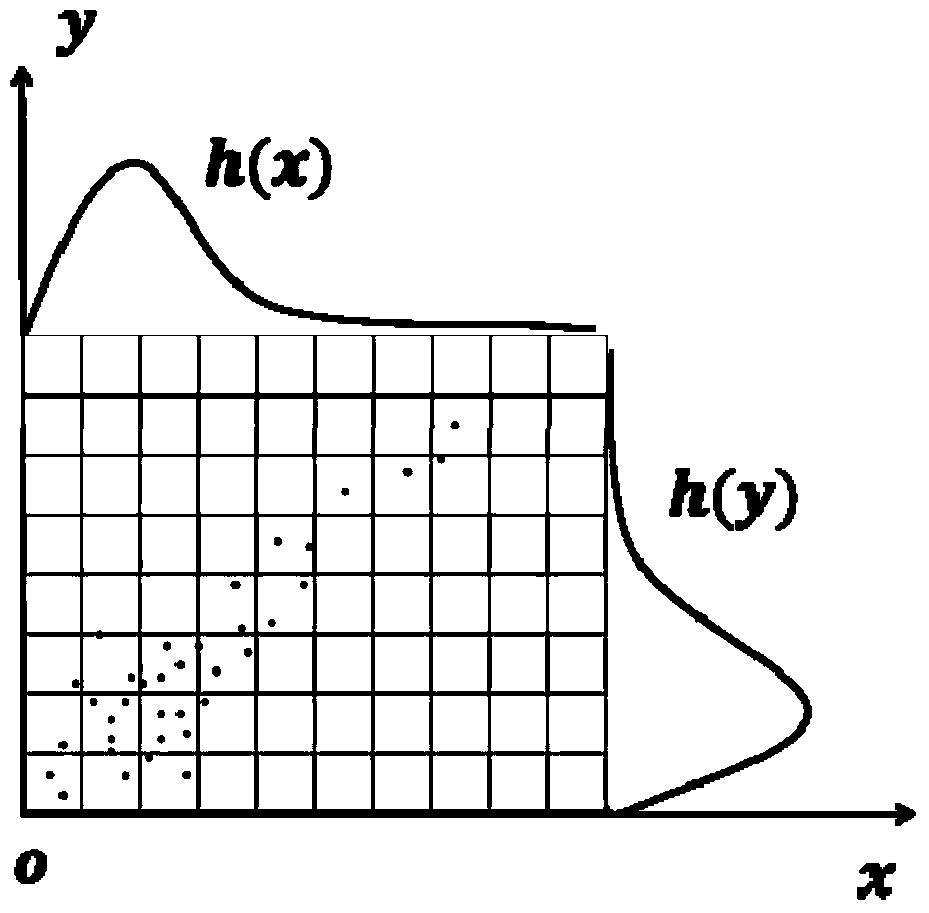
[0081] Such as figure 1 As shown, the optimal layout of the two-dimensional density grid in the step (1) considers that in the two-dimensional scattered point data density mapping, the spatial plane where the two-dimensional scattered point data is located is gridded, and the statistics in the grid The number of scattered points, this method is the fastest and most effective way to carry out density statistics. Obviously, the layout of the grid size has a gre...


PUM


Abstract

The invention discloses a two-dimensional scattered data density drawing method. The two-dimensional scattered data density drawing method comprises the following steps of: step (1) arranging two-dimensional density grids in an optimized manner; step (2), smoothly moving a density grid frequency number result on a plane; step (3) representing density attribute by color codes and isolines; step (4) counting and visualizing density distribution percentage. The two-dimensional scattered data density drawing method is simple, rapid and reliable, and particularly suitable for density drawing and visualization of the two-dimensional scattered data in a large data volume; the two-dimensional scattered data density drawing method realizes color code mapping of the two-dimensional scattered data density drawing through grid optimized arrangement and plane smooth movement of the density grid frequency number result, and realizes expression of the mathematical characteristic quantitative information of the two-dimensional scattered data density distribution.

Description

technical field [0001] The invention belongs to the field of non-parametric statistical drawing, in particular to a two-dimensional scattered point data density drawing method. The present invention mainly relates to the optimized layout of two-dimensional density grids, the frequency plane smoothing method of density grids, the color scale and contour representation of density attributes, the statistics and visualization of density distribution percentages, and the like. The present invention does not need to perform complex non-parametric density statistical calculations, is simple to implement, and has a good visualization effect of two-dimensional scatter point density mapping, and the result analysis and display are intuitive and diverse. Background technique [0002] In the density mapping of scatter data, it is first necessary to estimate the density of the data, and in the field of density estimation of the data, the histogram density estimation (that is, the probabi...

Claims


Application Information

Patent Timeline
IPC IPC(8): G06T11/00
Inventor 蒋锦刚周斌何贤强徐曜窦文洁
Owner HANGZHOU NORMAL UNIVERSITY
Why Eureka
Try Eureka