Power grid tide data comparison and analysis graphic display method

A trend data and graphic display technology, applied in the direction of electrical digital data processing, data processing applications, special data processing applications, etc., can solve the problem that the PSASP client software version cannot be guaranteed to be unified, it is not easy to coordinate operations and maintenance in different places, and it cannot be upgraded Deployment and other issues to achieve the effect of improving work efficiency, realizing practicality, and enhancing reusability

Inactive Publication Date: 2015-05-13
STATE GRID CORP OF CHINA +2
View PDF7 Cites 4 Cited by
  • Summary
  • Abstract
  • Description
  • Claims
  • Application Information

AI Technical Summary

Problems solved by technology

The planning and display of the grid power flow has been completed using the PSASP software package, and the sharing of map files between users can only be completed by copying. The version cannot be guaranteed to be unified, and there are compatibility problems with low-version clients, but it is impossible to achieve a unified upgrade deployment

Method used


Image

  • Power grid tide data comparison and analysis graphic display method
  • Power grid tide data comparison and analysis graphic display method
  • Power grid tide data comparison and analysis graphic display method

Examples


Embodiment Construction

[0028] The present invention will be described in further detail below in conjunction with the accompanying drawings.

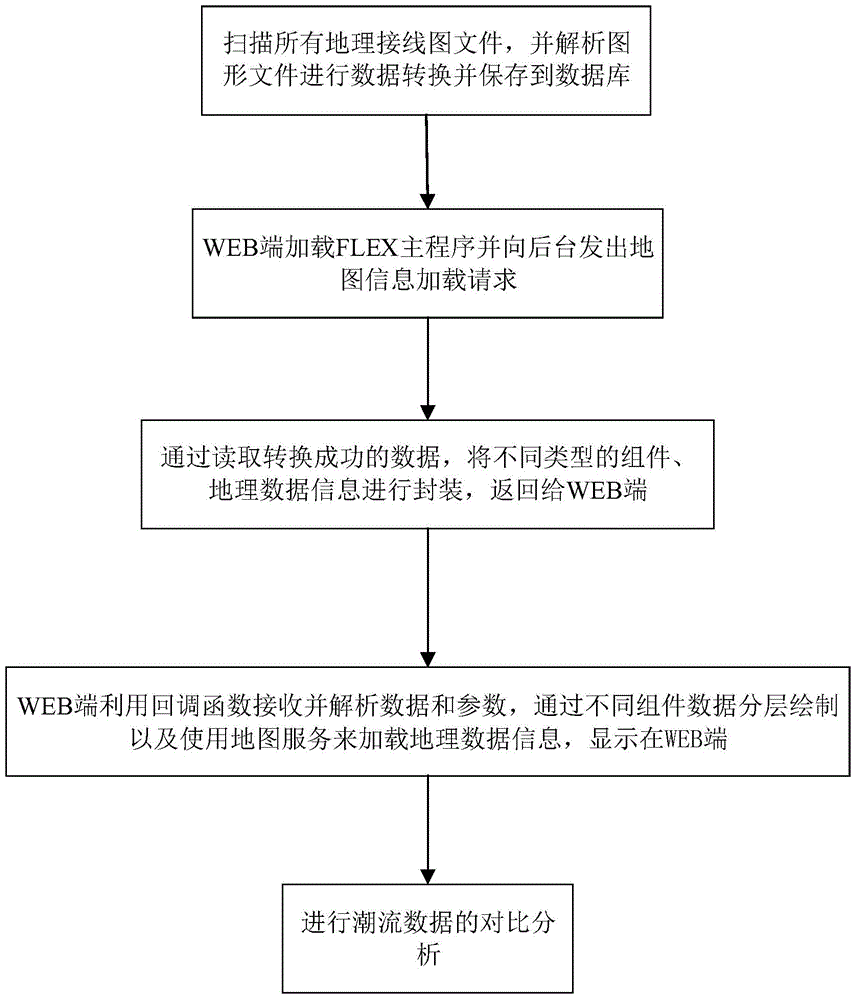
[0029] Such as figure 1 The graphic display method for the comparison and analysis of the power flow of the power grid, the main problem to be solved by the present invention and the specific features are that the data collection is completed by performing data analysis on the graphic files drawn by the PSASP and converting and storing, and the uninterrupted scanning of the background Ensure the update of drawings, optimize and complete core tasks such as graphic display, data editing, and power flow calculations by publishing services and code drawing; propose a method for power grid flow data analysis, comparison and display on the WEB side; specifically include The following feature steps:

[0030] 1) Analyze graphic files for data conversion and storage, scan all geographical wiring diagram files, confirm the status and start data conversion and storage....


PUM


Abstract

The invention provides a power grid tide data comparison and analysis graphic display method. The power grid tide data comparison and analysis graphic display method comprises scanning geographical wiring graphic files and performing analysis on the graphic files for data conversion to store the graphic files in a database; loading an FLEX main application through a JSP (Java Server Page) and sending a map information loading request to a server side; reading data which are successfully converted to encapsulate different types of assemblies and geographical data information and return to a web side after the server side receives the request; performing receiving and analysis on the data and parameters through the web side according to a callback function, hierarchically drawing the geographical data information through the different assembly data and loading the geographical data information through the map service and displaying the geographical data information on the web side for the comparison and analysis on the tide data. According to the power grid tide data comparison and analysis graphic display method, the remote collaborative operation and maintenance is implemented, the graphical display effect is achieved, the coupling degree of a system is reduced, the collaborative computing platform performance is fully utilized, the working efficiency is significantly improved, and the practical system functions are implemented.

Description

technical field [0001] The invention relates to a graphic display method, in particular to a graphic display method for comparing and analyzing power flow data. Background technique [0002] As an important link to ensure the rapid and stable development of the power grid, power grid planning is a complex system engineering. The power grid planning software mainly includes power system analysis software package (PSASP), BPA software package, etc. The planning and display of the grid power flow has been completed using the PSASP software package, and the sharing of map files between users can only be completed by copying. The version cannot be guaranteed to be unified, and there are compatibility problems with low-version clients, but it is impossible to achieve a unified upgrade deployment. Contents of the invention [0003] In order to overcome the above-mentioned deficiencies in the prior art, the present invention provides a graphical presentation method for comparison...

Claims


Application Information

Patent Timeline
Patent Type & Authority Applications(China)
IPC IPC(8): G06Q10/06G06Q50/06G06F17/30
CPCG06Q10/063G06Q50/06
Inventor 李勤新刘琳臧主峰翟媛媛陈勇潘志敏高峰田蓓
Owner STATE GRID CORP OF CHINA
Why Eureka
Try Eureka