Method for detecting light rare earth hydride using non-contact raman spectrum
A Raman spectrum detection, non-contact technology, applied in the cross field of material science and substance detection, to achieve the effect of convenient detection, low economic cost, safe and reliable detection process
- Summary
- Abstract
- Description
- Claims
- Application Information
AI Technical Summary
Problems solved by technology
Method used
Image
Examples
Embodiment 1
[0022] A method for non-contact Raman spectroscopy detection of rare earth metal hydrides, the specific steps are as follows:
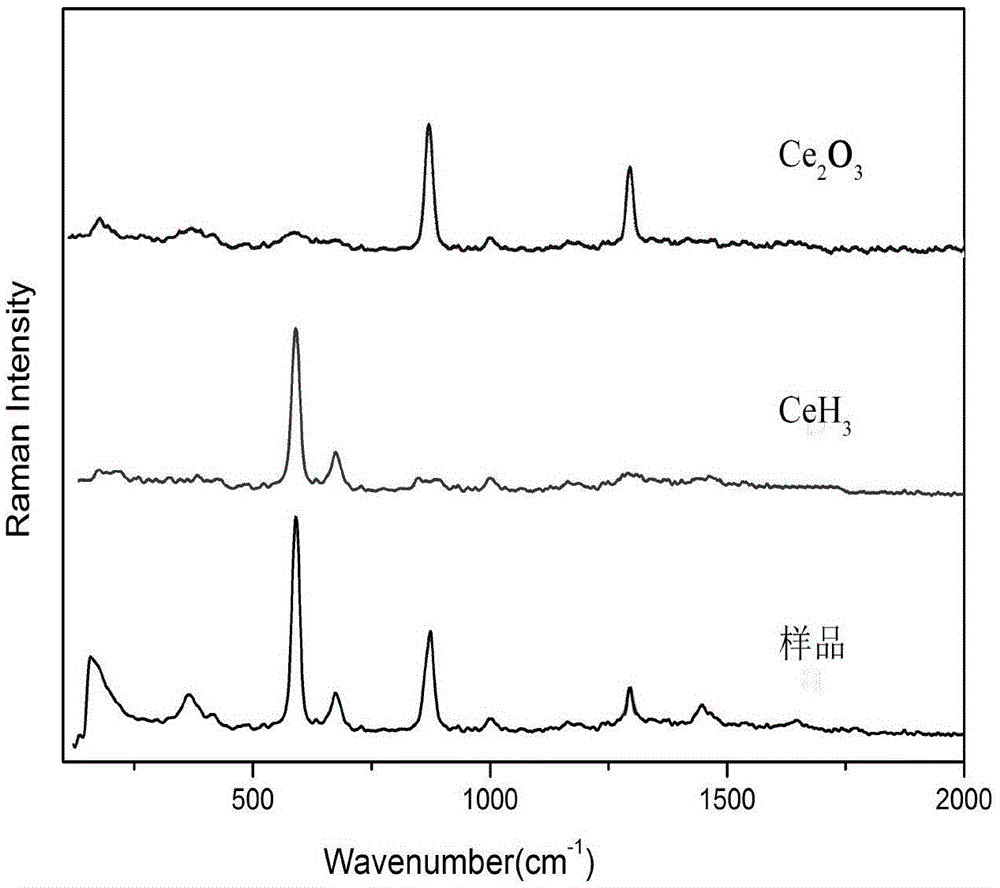
[0023] Step 1, in a vacuum environment, under the protection of an inert gas, grind the cerium hydride sample to be detected into a 100-mesh powder and place it in a quartz sample bottle, then add 20ml of anhydrous and oxygen-free aviation kerosene to the bottle, Take out after sealing to obtain a sealed bottle;
[0024] Step 2, the sealed bottle obtained in step 1 is scanned and detected with a Raman spectrometer, and the characteristic peaks of the sealed bottle and dispersant aviation kerosene are removed to obtain the spectrogram peak curve and data of the tested sample, and it is found that the tested Raman spectral curve is at 620cm -1 nearby, 880cm -1 near and 1300cm -1 There are obvious characteristic peaks nearby;
[0025] Step 3, compare the Raman spectrum of the sample obtained in step 2 with the corresponding cerium trihydride (CeH 3 )...
Embodiment 2
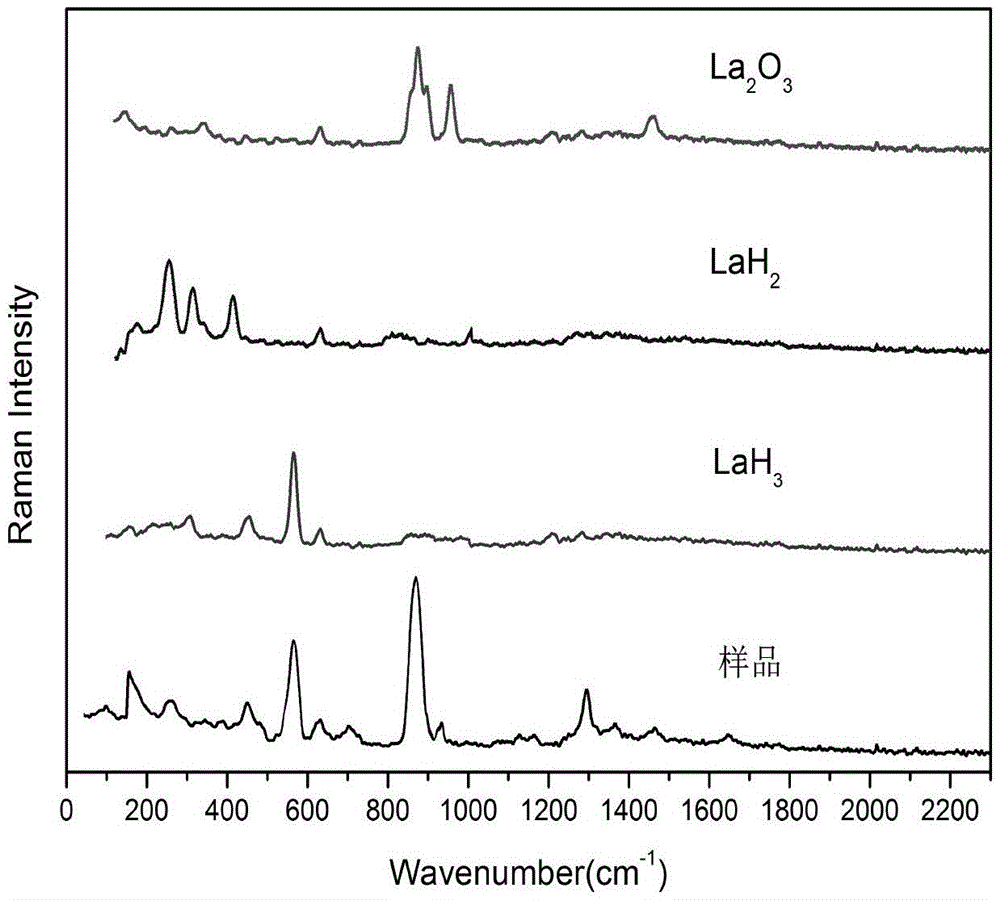
[0027] Step 1: Grind the lanthanum hydride powder to be detected into a 100-mesh powder under the protection of an inert gas in a vacuum environment and place it in a polystyrene sample bottle, and then add 30ml of anhydrous and oxygen-free tetrachloride to the bottle. Carbonization solution is taken out after sealing to obtain a sealed bottle;
[0028] Step 2. Scan the sealed bottle obtained in step 1 with a Raman spectrometer to remove the characteristic peaks of the sealed bottle and dispersant to obtain the peak curve and data of the tested sample. It is found that the tested Raman spectrum curve is at 257cm -1 nearby, 321cm -1 nearby, 418cm -1 nearby, 570cm -1 nearby, 629cm -1 nearby, 873cm -1 near and 958cm -1 There are obvious characteristic peaks nearby;
[0029] Step 3, compare the sample Raman spectrum curve obtained in step 2 with the corresponding lanthanum trihydride (LaH 3 ), lanthanum oxide (La 2 o 3 ) and lanthanum dihydride (LaH 2 ) standard Raman sp...
Embodiment 4
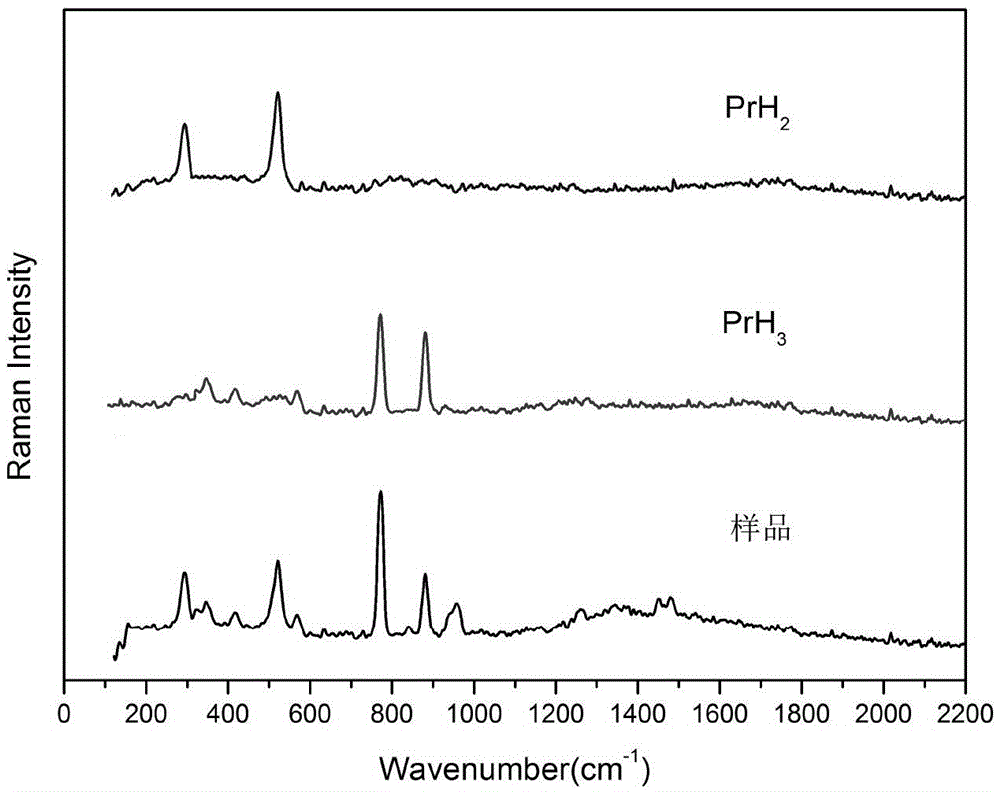
[0031] Step 1: Grind the praseodymium hydride powder to be detected into a 100-mesh powder under the protection of an inert gas in a vacuum environment and place it in a sample bottle made of polymethyl methacrylate, then add 35ml to the bottle and treat it with anhydrous and oxygen-free treatment. The toluene solution is taken out after sealing to obtain a sealed bottle;
[0032] Step 2. Scan the sealed bottle obtained in step 1 with a Raman spectrometer to remove the characteristic peaks of the sealed bottle and dispersant to obtain the peak curve and data of the tested sample. It is found that the tested Raman spectrum curve is at 297cm -1 nearby, 517cm -1 nearby, 769cm -1 near and 877cm -1 There are obvious characteristic peaks nearby;
[0033] Step 3, compare the sample Raman spectrum curve obtained in step 2 with the corresponding praseodymium trihydrogen (PrH 3 ) and praseodymium hydride (PrH 2 ) standard Raman spectrum for curve and characteristic peak data compar...
PUM
 Abstract
Description
Claims
Application Information
 - R&D
- Intellectual Property
- Life Sciences
- Materials
- Tech Scout
- Unparalleled Data Quality
- Higher Quality Content
- 60% Fewer Hallucinations
Browse by: Latest US Patents, China's latest patents, Technical Efficacy Thesaurus, Application Domain, Technology Topic, Popular Technical Reports.
© 2025 PatSnap. All rights reserved.Legal|Privacy policy|Modern Slavery Act Transparency Statement|Sitemap|About US| Contact US: help@patsnap.com


