[0045] The present invention will be further described in detail below with reference to the drawings and embodiments. The following examples are used to illustrate the present invention, but cannot be used to limit the scope of the present invention.
[0046] The specific implementation is to select 304 stainless steel with a brand of 06Cr19Ni10 to prepare a test block. In order to establish a multi-frequency ultrasonic attenuation evaluation model of the grain size to eliminate the influence of diffusion, the test block with a known grain size needs to be used as a reference. Use the ultrasonic pulse signal generator/receiver to connect with the focus probe to send and receive the pulse signal; use the motion control card and the motion platform to adjust the control probe to move up and down perpendicular to the measured surface, and use the high-speed data acquisition card on the computer to acquire and store the ultrasonic instrument The original ultrasonic A wave signal output is finally further analyzed and modeled on the computer.
[0047] figure 1 It is a flow chart of the method for evaluating the ultrasonic attenuation of metal crystal grain size that eliminates the influence of curved surface diffusion of the present invention. The modeling and evaluation steps are as follows.
[0048] S1. Prepare plane calibration test blocks with the same shape but with different average grain sizes through different heat treatments, prepare curved test blocks with different shapes but with the same average grain size through heat treatment under the same conditions, and collect the calibration and the ultrasonic returns of the curved test blocks. Using the primary and secondary bottom wave signals to extract the total ultrasonic attenuation spectrum of each test block, the metallographic method is used to measure and record the crystal grain size of each calibration test block and test test block.
[0049] S11. Firstly, 13 test block blanks are cut out by wire cutting for heat treatment. The above test block blanks are processed in a high-temperature furnace, and different heating temperatures and holding times are set to have a grain size gradient while maintaining the diffusion rate and the degree of grain boundary segregation. Consistent, followed by a stress relief annealing.
[0050] S12. After heat treatment, each test block blank is machined according to the geometric dimensions designed for the plane calibration test block and the test surface test block, using the slow wire cutting process to ensure the dimensional accuracy and the smoothness of the key surface in the ultrasonic inspection test. The plane calibration test block and the test curved surface test block are subjected to ultrasonic measurement by water immersion method, and the primary bottom wave BW1 and the second bottom wave BW2 are extracted, and the total attenuation spectrum is calculated as
[0051]
[0052] Where α total (f) is the total ultrasonic attenuation spectrum of the tested block, h is the thickness of the tested block, V BW1 (f) and V BW2 (f) is the frequency domain form of the primary bottom wave signal BW1 and the secondary bottom wave signal BW2 after Fourier transform.
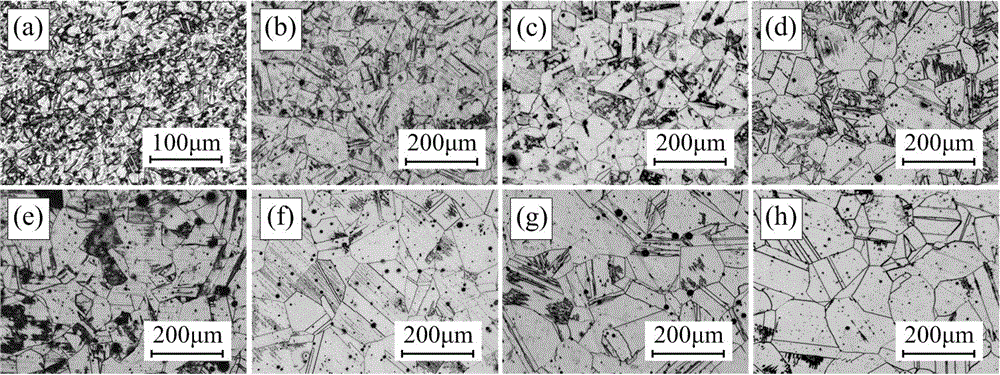
[0053] S13. Cut 2 cube samples with a side length of 5mm from different parts of each blank margin to represent the internal metallographic structure of each test block. Use a mounting machine with hot mounting powder to make mosaic samples, and grind the mosaic samples Sampling and polishing; corrosion for a certain period of time with an etchant; metallographic observation and image acquisition in a metallographic microscope system, calculation of the grain size according to the ASTM E112 standard, and calculate the average grain size of each and mark it as D ki.
[0054] S2. Use the multivariate Gaussian sound beam theory to establish a diffusion attenuation calculation model that does not consider scattering attenuation, and use the established diffusion attenuation calculation model to calculate the diffusion attenuation spectrum of each calibration test block and the test test block obtained in step S1.
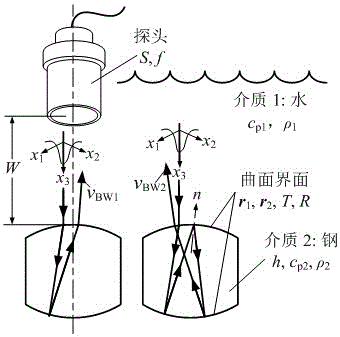
[0055] S21, such as figure 2 As shown, the Gaussian beam model is used to solve the particle vibration velocity v of the primary bottom wave BW1 and the secondary bottom wave BW2 received by the probe BW1 (f) and v BW2 (f). The following influencing factors need to be considered in the solution process: the transmission coefficient T of the sound beam at the water-to-test block interface and the test block-water interface 12 And T 21 , The reflection coefficient R at the workpiece-water interface 21 , The distance W from the probe to the surface of the tested block, the thickness h of the tested block and the radius of curvature of the upper and lower surfaces of the tested block r 1 , R 2.
[0056] S22. The particle vibration velocity v of the primary bottom wave BW1 and the secondary bottom wave BW2 obtained by using the step S21 BW1 (f) and v BW2 (f), the sound pressure at each point of the probe chip is divided into areas, and the average sound pressure of the primary bottom wave BW1 and the second bottom wave BW2 received by the probe are respectively
[0057]
[0058]
[0059] In the formula, ρ is the density of water, Is the propagation speed of ultrasonic waves in water, S is the effective area of the chip of the receiving probe, Is the average sound pressure of the primary bottom wave BW1 sound beam received by the probe, The average sound pressure of the secondary bottom wave BW2 sound beam received by the probe.
[0060] S23. The average sound pressure of the primary bottom wave BW1 and the second bottom wave BW2 received by the probe obtained in step S22 with Calculate the diffusion attenuation spectrum of the first bottom wave BW1 to the second bottom wave BW2 of the tested block as
[0061]
[0062] In the formula, s(f) is the system function of the detection system, t BW1 (f) is the acoustic elastic transfer function of the primary bottom wave BW1, t BW2 (f) is the acoustic elastic transfer function of the second bottom wave BW2, α diff (f) is the diffusion attenuation spectrum of the primary bottom wave BW1 to the secondary bottom wave BW2 of the test block.
[0063] S3. Remove the diffuse attenuation spectrum component obtained in step S2 from the ultrasonic total attenuation spectrum obtained in step S1, to obtain the true scattering attenuation spectrum of each calibration test block and test test block obtained in step S1, and combine the The metallographic grain size of the calibration test block obtained in step S1, and the grain size evaluation function of each frequency is calculated.
[0064] S31. The diffusion attenuation spectrum α of the primary bottom wave BW1 to the secondary bottom wave BW2 obtained by using the step S23 diff (f), calculate the true scattering attenuation spectrum of the tested block as
[0065] α(f)=α total (f)-α diff (f) (5)
[0066] In the formula, α(f) is the true attenuation spectrum of the tested block.
[0067] S32. Select the frequency f according to the effective frequency range of the probe selected in step S1 i ,Calculate frequency f i The grain size attenuation evaluation function under
[0068]
[0069] In the formula, D i Is the grain size of the tested block, α(f i ) Is the tested block at frequency f i The true attenuation value, Is the frequency f i Grain size attenuation evaluation function below.
[0070] S4. Use the grain size evaluation function of each frequency obtained in the step S3 to establish a multi-frequency weighted evaluation model of the grain size; the specific method of the step S4 is:
[0071] Selected f i Isometrically distributed in the interval [f 1 ,f n ], the corresponding attenuation coefficient after correction is [α(f 1 ),α(f n )], using the frequency f obtained in step S32 i Grain size attenuation evaluation function under The evaluation model for the grain size of the test block is
[0072]
[0073] Where w i Is the grain size evaluation function g at each frequency i -1 (α(f i )) normalized weights, and satisfy
[0074] S5. Using the multi-frequency weighted evaluation model of the grain size obtained in the step S4, evaluate the grain size of each curved surface test block, and finally compare and analyze the effectiveness of the model.
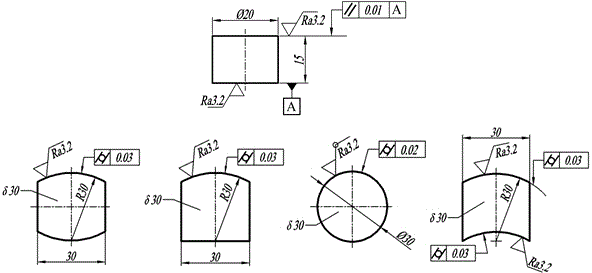
[0075] image 3 It is the outline dimension drawing of the plane calibration test block and the curved surface test block. The clamping state of the 8 plane calibration test blocks of 1 shape is the same, and they are respectively marked as #0, #1, #2, #3, #4, #5 , #6, #7, 4 different shapes of curved surface test blocks can have 6 clamping states, respectively marked as #A, #B, #BT, #C, #D, #DT.
[0076] Figure 5 This is a schematic diagram of the structure of the ultrasonic signal acquisition system in the present invention. The Olympus5072PR ultrasonic pulse signal generator/receiver is connected with the focusing probe for pulse signal transmission and reception. The focusing probe of the model GE-IAP10.6.3 is selected, the center frequency f is 10MHz, and the focal length F It is 75mm. The end face of the test block is fixed by a special fixture, and the probe is controlled to make it vertical and centered with the measured surface, and the probe is moved up and down to change the water sound distance. In the detection, the probe focal length F is set to the underwater acoustic distance W, which effectively improves the incident acoustic energy and controls the waveform distortion. Use ADLINK PCIe-9852 high-speed data acquisition card to get A wave data with a sampling interval of 5ns. The heat treatment of the test block adopts the KSL1700X high-temperature furnace. The chemical composition of the etching solution used in the metallographic analysis is 20%HF+10%HNO3+70%H2O, and the etching time is 20min. Then the test block is ground and polished, using Leica The company's DM4000M metallographic microscope observes the metallographic structure. The heat treatment conditions and metallographic grain size of the test block are shown in Table 1.
[0077] Table 1 Heat treatment conditions and metallographic grain size of test block
[0078]
[0079] Set the time gate to obtain the time domain BW1 and BW2 signals and calculate their amplitude-frequency characteristic curves. The measured total attenuation coefficient at each frequency component is calculated by formula (1), as shown in Figure 6, where Figure 6(a) is a plane calibration test block Figure 6(b) shows the total attenuation spectrum of the curved surface test block.
[0080] For curved surface test blocks #B and #DT, Gaussian theory is used to simulate the influence of the bending interface of the workpiece on the diffusion of ultrasonic beams. The simulation shows that when the sound beam emitted by the focusing probe penetrates the convex and concave water-steel interface, it will diverge and converge, respectively; while the sound beam will be transmitted separately from the convex and concave steel-water interface. Gathering and divergence occur. Further simulate and calculate the value of the diffusion attenuation coefficient according to formula (4), the result is as follows Figure 7 Shown.
[0081] Using the test total attenuation spectrum and diffusion attenuation spectrum obtained above, substitute into formula (5) to calculate the true scattering attenuation, and the result is shown in Figure 8. Fig. 8(a) and Fig. 6(b) are respectively compared with Fig. 8(b). For the attenuation spectrum of curved surface test block #A~#DT after removing the diffusion attenuation, the change trend is closer to the reference plane test block #5, and The width of the attenuation band formed by the envelope is narrower. Calculate the dispersion coefficient CV of the attenuation value under multiple frequency components before and after the correction of the diffusion coefficient of the curved surface block, and consider the dispersion degree of the attenuation spectrum before and after the correction. The results are shown in Table 2, compared with the CV value before and after the correction. An average decrease of 0.057 means that the dispersion of the data is reduced by 31%, and the evaluation stability of the modified model will be significantly improved.
[0082] Table 2 The dispersion coefficient of the curved surface test block before and after removing the diffusion attenuation
[0083]
[0084] According to the effective frequency band of the experiment, referring to the main frequency and bandwidth parameters of the selected probe, the frequency range of the evaluation model is [2.5MHz, 8.5MHz]. Using the plane attenuation spectrum data in Figure 6(a) and the grain size of the #0~#7 plane test block measured by the metallographic method, a polynomial model is selected to establish the attenuation-grain size evaluation function, that is, for each determined frequency component f i ,Satisfy
[0085] g i (D)=p i D 3 +q i D+c i (8)
[0086] The frequency interval is 0.5MHz, so the number of evaluation function curves n is 13, and some fitting results are as Picture 9 As shown, the parameter p of the evaluation function at each frequency i , Q i , C i The value of is shown in Table 3.
[0087] Table 3 Attenuation-grain size evaluation function group parameters
[0088]
[0089] In combination with formula (7), in order to simplify the formula, the weights wi of each grain size attenuation evaluation function are all equal. For surface verification test blocks #A~#DT that are not involved in the derivation, according to the frequency range of the measured effective attenuation spectrum [2.5MHz, 7MHz], combined Picture 9 , Take the evaluation function series, the grain size evaluation formula of the curved surface block can be obtained
[0090]
[0091] For the traditional grain size frequency domain evaluation method, the attenuation-grain size function at a single fixed frequency is used for evaluation, combined with the frequency range of the measured effective attenuation spectrum, the grain size evaluation function with the highest fitting correlation coefficient in Table 3 is selected , Can get the traditional method of grain size evaluation formula
[0092]
[0093] To evaluate the grain size of the curved surface test block, first use the traditional attenuation method model formula (10) to select the attenuation-grain size function at 7MHz to obtain a set of evaluation results; then use the multi-frequency weighted evaluation model (9) , Also evaluate the curved test block under 7MHz;
[0094] The results are shown in Table 4.
[0095] Table 4 Comparison of evaluation effects of grain size before and after removing diffusion attenuation
[0096]
[0097] The method of the present invention calculates the diffusion attenuation caused by the shape of the test block, the distance of the water sound, and the interface reflection and transmission according to the multivariate Gaussian sound beam theory, and then obtains the true scattering attenuation excluding the diffusion attenuation part, and calculates the attenuation by using the scattering attenuation- Grain size evaluation function, and finally establish a multi-frequency weighted evaluation model of grain size. According to the metallographic method, the average relative error of the single-frequency evaluation method is 8.34%, the average relative error of the patent method evaluation is 4.28%, and the minimum relative error is 3.21%. , The maximum relative error is 5.61%. It can be seen that by eliminating the diffusion attenuation component and introducing multi-frequency weighted evaluation, the system error and random error are reduced, and the practicability and reliability of the ultrasonic nondestructive evaluation method for the average grain size of metal materials are improved.
[0098] The above embodiments are only used to illustrate the present invention, but not to limit the present invention. Although the present invention has been described in detail with reference to the embodiments, those of ordinary skill in the art should understand that various combinations, modifications, or equivalent replacements of the technical solutions of the present invention do not depart from the spirit and scope of the technical solutions of the present invention, and should cover Within the scope of the claims of the present invention.