A method for quantitatively characterizing the grain size of the main phase structure of multiphase materials
A technique for quantitative characterization, grain size, used in the analysis of materials, material analysis using wave/particle radiation, measurement devices, etc.
- Summary
- Abstract
- Description
- Claims
- Application Information
AI Technical Summary
Problems solved by technology
Method used
Image
Examples
Embodiment 1
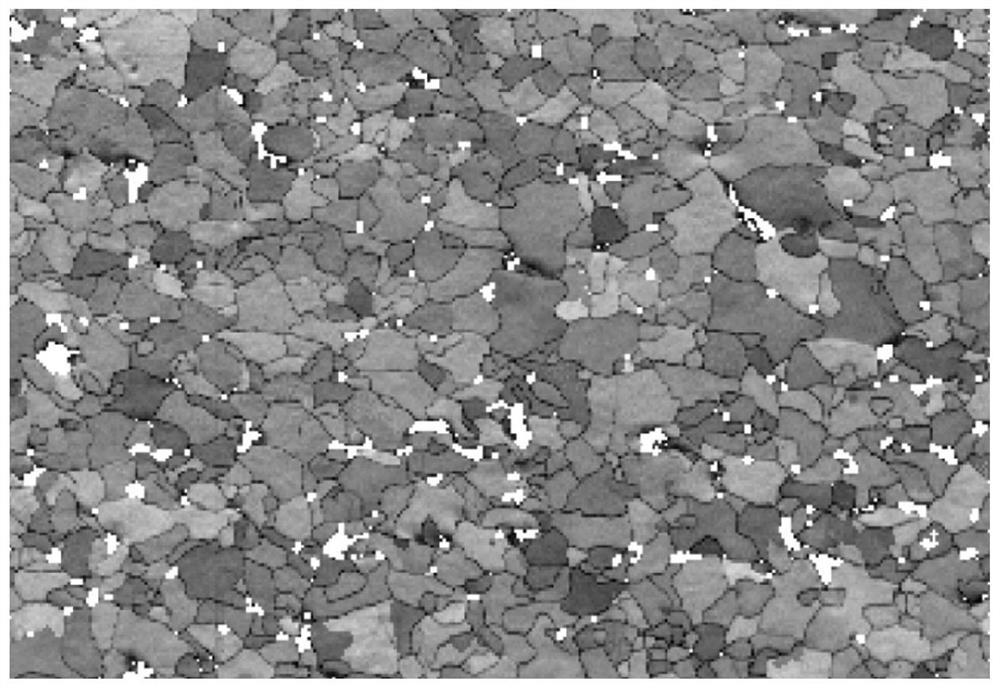
[0023] In this example, a sample of 20# steel hot-rolled plate is prepared, and the EBSD surface scanning data is obtained by scanning electron microscope observation, and the main phase grain analysis is performed on the scanned area on the basis of phase composition analysis. The specific technical steps are:
[0024] 1. Preparation of Specimen
[0025] 1.1 Cut and grind the sample:
[0026] A precision cutting machine is used to cut out the sample to be tested; a mechanical grinding machine is used to grind the sample, and the sandpaper is ground from coarse to fine to No. 1500, and water is used as lubrication and removal of pollutants.
[0027] 1.2 Mechanical polishing:
[0028] A mechanical polishing machine is used, the wetting agent is water, and the polishing abrasive is artificial diamond polishing agent, and low-speed polishing can reduce stress.
[0029] 1.3 Electropolishing
[0030] Referring to Table A.1 of YB / T4377-2014, the formula and conditions of use of ...
Embodiment 2
[0050] In this embodiment, a sample is prepared for 16Mn steel, the structure is observed with a scanning electron microscope, EBSD surface scanning data is obtained, and the grain size quantitative analysis of the scanned area is performed on the basis of phase composition analysis.
[0051] The specific technical steps are:
[0052] Steps 1 and 2 are performed in the same manner as in Example 1.
[0053] 3. EBSD surface scan data analysis
[0054] 3.1 Removal of noise and mislabeling
[0055] Use Oxford Instruments (Channel 5) data processing module, put this project into the phase analysis interface, use to remove most of the noise points, first remove singular points, and then use to remove noise points to get a complete surface scan result.
[0056] 3.2 Phase analysis
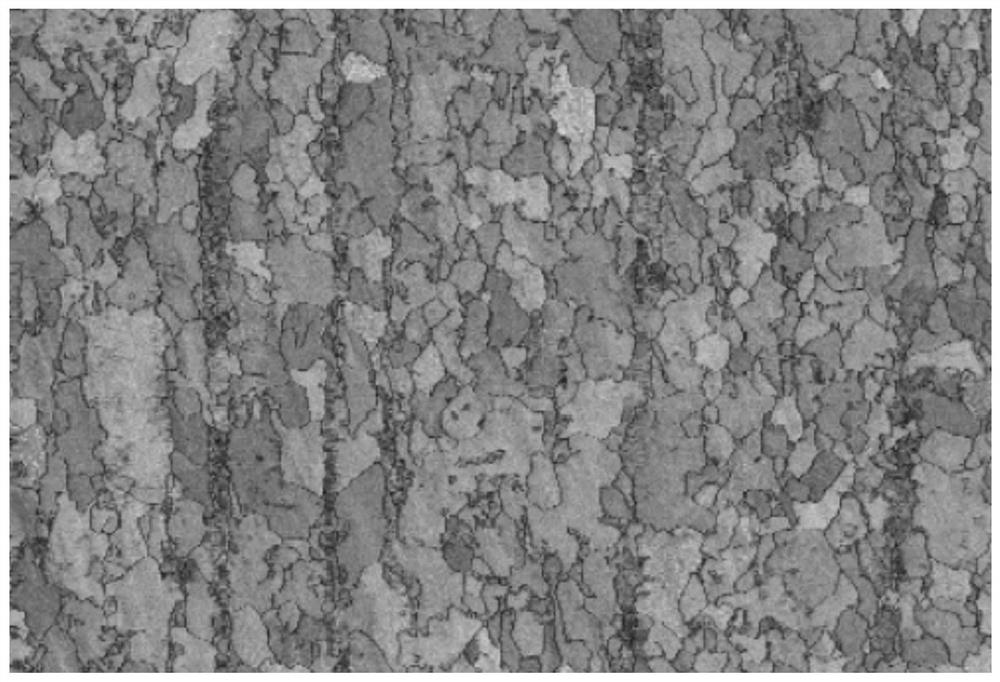
[0057] Through the comparison of the diffraction contrast image and the scanning image, in the diffraction contrast image such as figure 2 Find the diffraction contrast range corresponding to pearlite...
PUM
 Abstract
Description
Claims
Application Information
 - R&D
- Intellectual Property
- Life Sciences
- Materials
- Tech Scout
- Unparalleled Data Quality
- Higher Quality Content
- 60% Fewer Hallucinations
Browse by: Latest US Patents, China's latest patents, Technical Efficacy Thesaurus, Application Domain, Technology Topic, Popular Technical Reports.
© 2025 PatSnap. All rights reserved.Legal|Privacy policy|Modern Slavery Act Transparency Statement|Sitemap|About US| Contact US: help@patsnap.com


