Biosensor for detecting mercury ions on basis of fluorescence
A biosensor and fluorescence detection technology, applied in the field of biosensors, can solve the problems of long detection period, high cost, low specificity and sensitivity, etc., and achieve the effect of simple preparation method, stable performance and sensitive detection
- Summary
- Abstract
- Description
- Claims
- Application Information
AI Technical Summary
Problems solved by technology
Method used
Image
Examples
Embodiment 1
[0032] Example 1 Preparation of D1-AgNCs.
[0033] Configure PB buffer solution (concentration is 20mM), PB buffer solution is composed of disodium hydrogen phosphate and sodium dihydrogen phosphate, weigh 0.7163g disodium hydrogen phosphate and 0.3120g sodium dihydrogen phosphate respectively, and make 100ml solution each , and then take a part of disodium hydrogen phosphate and mix a part of sodium dihydrogen phosphate, adjust the pH value of the mixed solution to 6.5 and then set aside.
[0034] Formulating AgNO 3 Concentration of 2mM, volume of 1mL, AgNO 3 Easy to decompose when exposed to light, ready-to-use and ready-to-use, configure AgNO 3 Wrap the centrifuge tube with tinfoil first.
[0035] Take a 1 mL centrifuge tube, add 76 μL of PB (20 mM), add 15 μL of D1 (final concentration is 15 μM), add 4.5 μL of AgNO 3 (2mM), shake for 1min, and put in a refrigerator at 4°C for 30min. Prepare NaHBO during 4 Concentration 2mM, volume 1mL, NaHBO 4 Ready-to-use and ready...
Embodiment 2
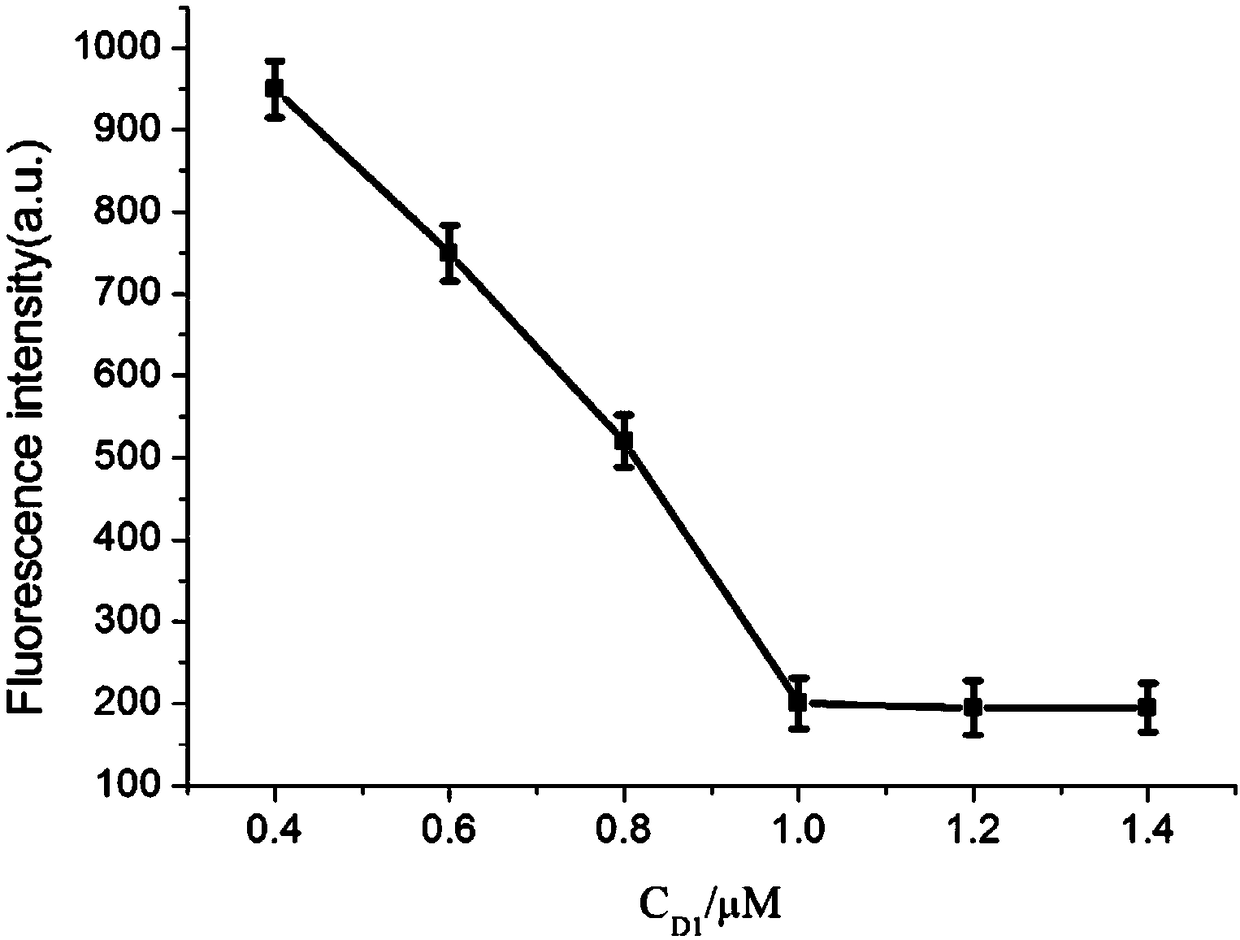
[0037] Example 2 Effects of different concentrations D1 on the detection of mercury ions.
[0038] (1) Dilute the D1-AgNCs solution in Example 1 to a final concentration of 0.4 μM, 0.6 μM, 0.8 μM, 1.0 μM, 1.2 μM, and 1.4 μM, and then measure the fluorescence intensity respectively. Take 2 μL and add them to 7 centrifuges tube, then add 2 μL of 15 μM D2 chain to each tube, 8 μL of 5×PBS, 2 μL of heme (1 μM), and finally 2 μL of Hg 2+ solution (3μM), shaken for 30s, and placed in a water bath at 37°C for 1h.
[0039] (2) After 1 h, take out the mixed solution from the water bath, and then measure its fluorescence intensity.
[0040] Take the concentration of D1 as the abscissa, and the fluorescence intensity as the ordinate, as figure 2 . It can be seen from the figure that the detected fluorescence signal intensity decreases as the concentration of D1 increases in the range of 0.4-1.4 μM, and when the concentration exceeds 1.0 μM, the fluorescence intensity tends to be stab...
Embodiment 3
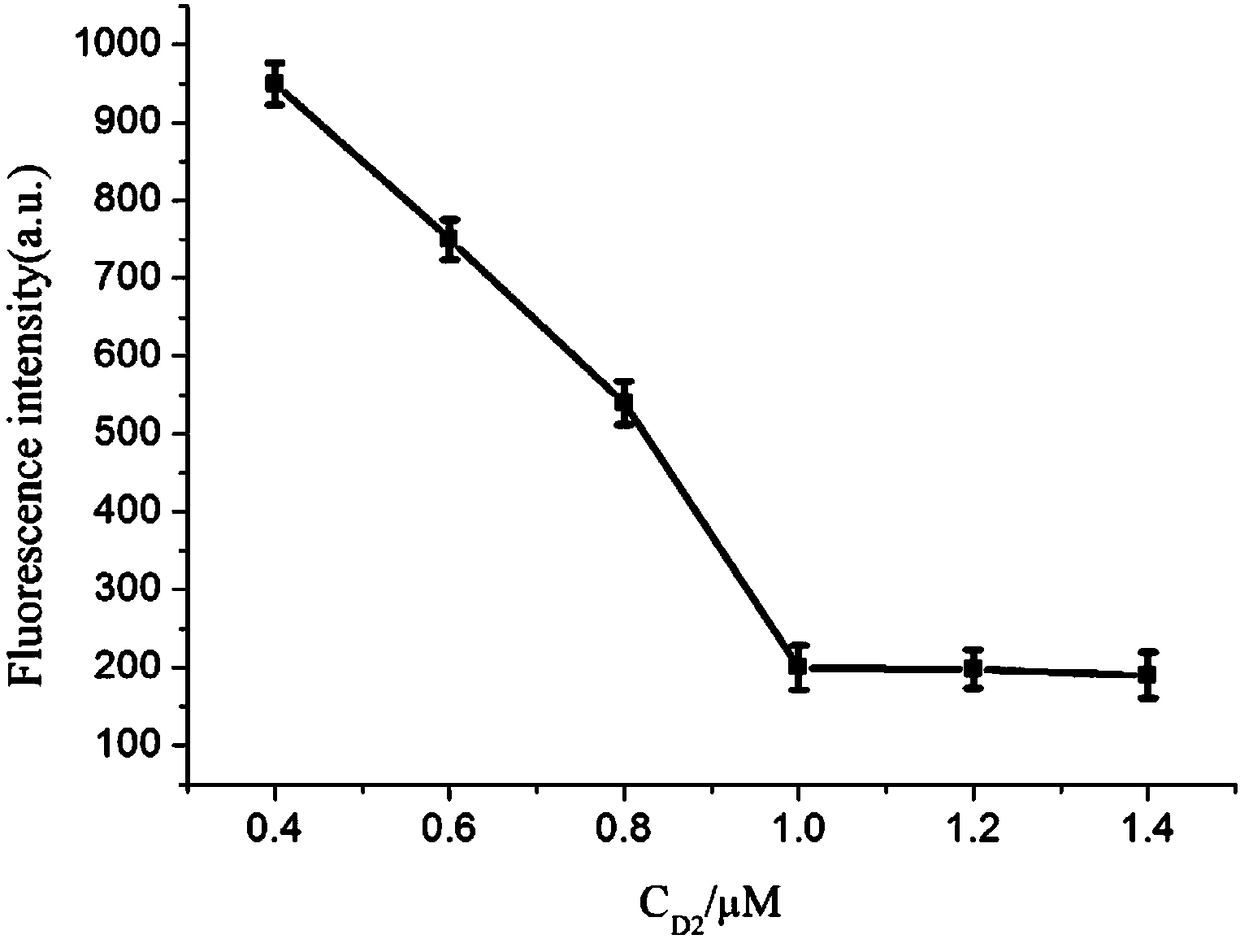
[0041] Example 3 Effects of different concentrations of D2 on the detection of mercury ions.
[0042] (1) To measure the fluorescence intensity of D1-AgNCs sample S4 in Example 1, take 2 μL of S4 with a concentration of 15 μM and add them to 7 centrifuge tubes, and then add 2 μL of D2 chains with different concentrations (final concentrations are 0.4 μM, 0.6 μM, respectively). μM, 0.8μM, 1.0μM, 1.2μM, 1.4μM), add 8μL of 5×PBS to each tube, 2μL of heme (1μM), and finally 2μL of Hg 2+ The solution (3μM) was added to the centrifuge tube, shaken for 30s, and placed in a water bath at 37°C for 1h.
[0043] (2) Take out the mixed solution from the water bath after 1 h, and then measure its fluorescence intensity.
[0044]Take the D2 chain concentration as the abscissa, and the fluorescence intensity as the ordinate, as image 3 . It can be seen from the figure that the detected fluorescence signal intensity decreases as the concentration of D2 chain increases in the range of 0.4-...
PUM
 Abstract
Description
Claims
Application Information
 - R&D
- Intellectual Property
- Life Sciences
- Materials
- Tech Scout
- Unparalleled Data Quality
- Higher Quality Content
- 60% Fewer Hallucinations
Browse by: Latest US Patents, China's latest patents, Technical Efficacy Thesaurus, Application Domain, Technology Topic, Popular Technical Reports.
© 2025 PatSnap. All rights reserved.Legal|Privacy policy|Modern Slavery Act Transparency Statement|Sitemap|About US| Contact US: help@patsnap.com


