Method of component analysis of complexes containing fatty acid and complexes of fatty acid derivative types
A technology of fatty acid derivatives and analysis methods, which is applied in the field of component analysis of complexes containing fatty acids and fatty acid derivatives, can solve the problems of inability to quantify, difficult component analysis, poor reproducibility and accuracy, etc. The effect of accurate analysis results and less sampling volume
- Summary
- Abstract
- Description
- Claims
- Application Information
AI Technical Summary
Problems solved by technology
Method used
Image
Examples
Embodiment 1
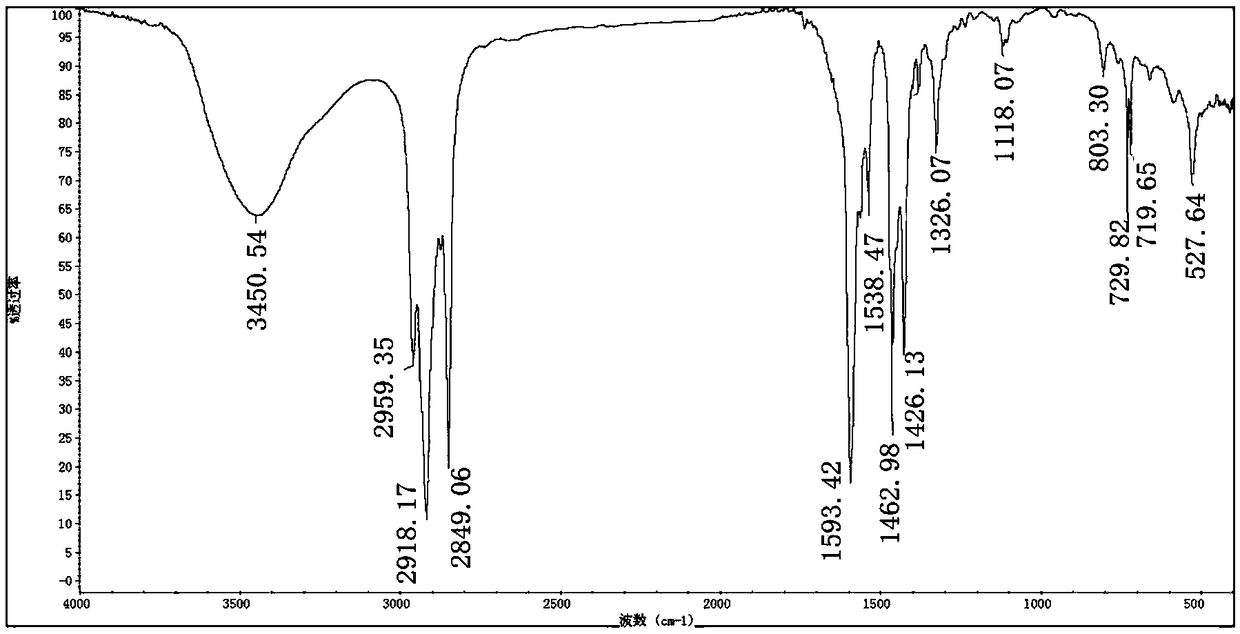
[0069] Embodiment 1: the test of laboratory known sample (containing 40% polyethylene wax, 60% zinc isooctanoate)
[0070] 1.1 Identification of infrared functional groups;
[0071] Take the sample (about 1 mg) and dry KBr (about 200 mg) and mix them evenly in an agate mortar. After fully grinding (to make the particles reach about 2 μm), put the mixture evenly between the top mold and the bottom mold of the solid tableting mold room, and then put the mold into the press, at 8T / cm 2 Keep it under pressure for 1-2 minutes to get transparent or uniform translucent tablets. Take out the tablet and load it into the solid sample test rack. Insert the solid sample test rack into the sample holder of the optical bench, let the light beam pass through the center of the sample, and quickly close the darkroom door, at 4000-500cm -1 Infrared spectra were collected in the wavenumber range. The infrared spectrum of the sample is shown in figure 1 , the analysis results of the infrared...
Embodiment 2
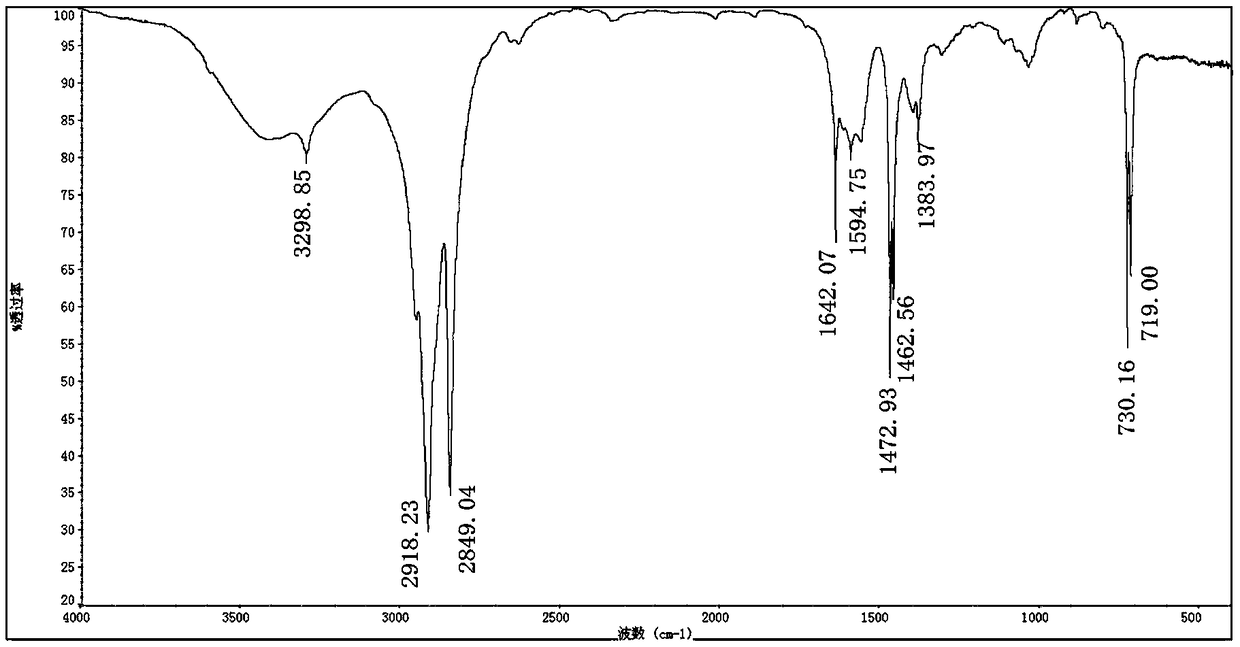
[0124] Embodiment 2: the test of laboratory known sample 2 (containing 80% polyethylene wax, 10% zinc isooctanoate, 10% ethanolamide stearate)
[0125] 2.1 Identification of infrared functional groups;
[0126] Take the sample (about 1 mg) and dry KBr (about 200 mg) and mix them evenly in an agate mortar. After fully grinding (to make the particles reach about 2 μm), put the mixture evenly between the top mold and the bottom mold of the solid tableting mold room, and then put the mold into the press, at 8T / cm 2 Keep it under pressure for 1-2 minutes to get transparent or uniform translucent tablets. Take out the tablet and load it into the solid sample test rack. Insert the solid sample test rack into the sample holder of the optical bench, let the light beam pass through the center of the sample, and quickly close the darkroom door, at 4000-500cm -1 Infrared spectra were collected in the wavenumber range. The infrared spectrum of the sample is shown in figure 2 , IR spe...
Embodiment 3
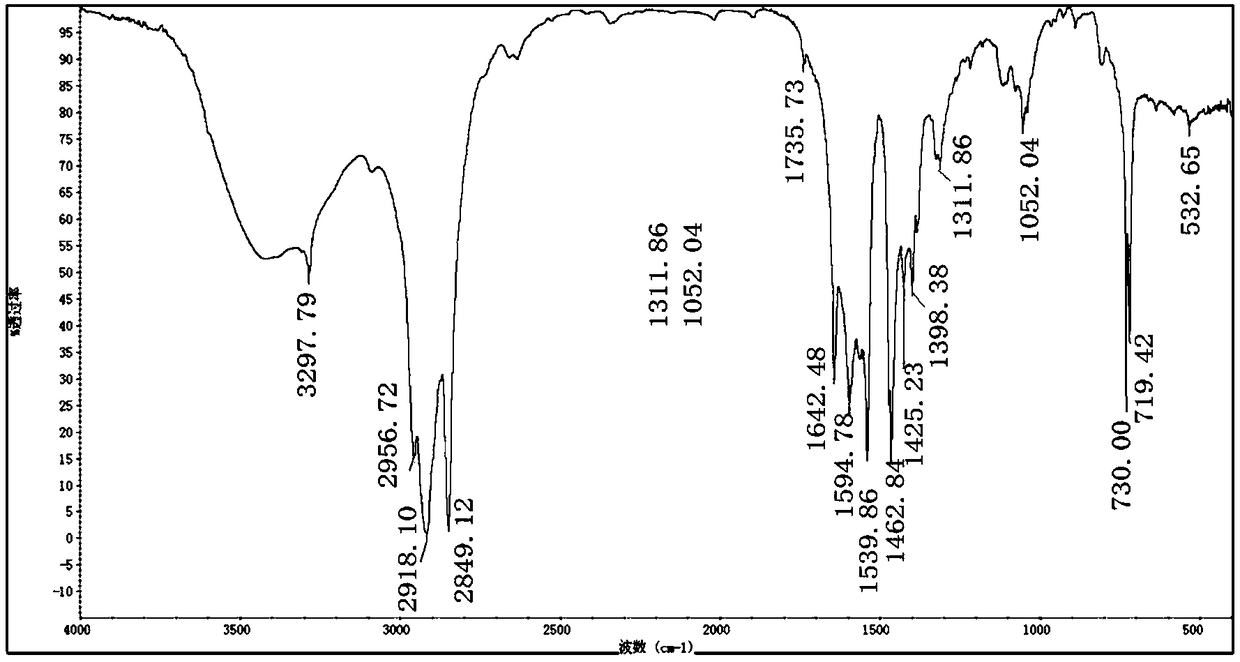
[0160] Embodiment 3: the test of laboratory known sample (containing 42% polyethylene wax, 45% zinc isooctanoate, 7% zinc stearate, 4% fatty acid pentaerythritol ester, 2% ethanolamide stearate)
[0161] 3.1 Identification of infrared functional groups;
[0162] Infrared spectrogram see image 3 , see Table 3-1 for peak analysis results.
[0163] Table 3-1 Sample infrared absorption spectrum peak analysis
[0164] spectral peak
Functional group assignment
3297.79cm -1
N-H stretching vibration absorption peak
3450.54cm -1
O-H stretching vibration absorption peak
2959.35cm -1 ~2849.06cm -1
Alkyl C-H stretching vibration absorption peak
1735.73cm -1
COO in ester group - The asymmetric stretching vibration absorption peak of
1642.48cm -1 、1593.42cm -1
COO in Zinc salt of isooctanoate - The asymmetric stretching vibration absorption peak of
1539.86cm -1
COO in zinc stearate - The a...
PUM
 Abstract
Description
Claims
Application Information
 - R&D
- Intellectual Property
- Life Sciences
- Materials
- Tech Scout
- Unparalleled Data Quality
- Higher Quality Content
- 60% Fewer Hallucinations
Browse by: Latest US Patents, China's latest patents, Technical Efficacy Thesaurus, Application Domain, Technology Topic, Popular Technical Reports.
© 2025 PatSnap. All rights reserved.Legal|Privacy policy|Modern Slavery Act Transparency Statement|Sitemap|About US| Contact US: help@patsnap.com


