[0120] In order to make the object, technical solution and advantages of the present invention clearer, the present invention will be further described in detail below in conjunction with the accompanying drawings and embodiments. The specific embodiments described here are only used to explain the present invention, not to limit the present invention.
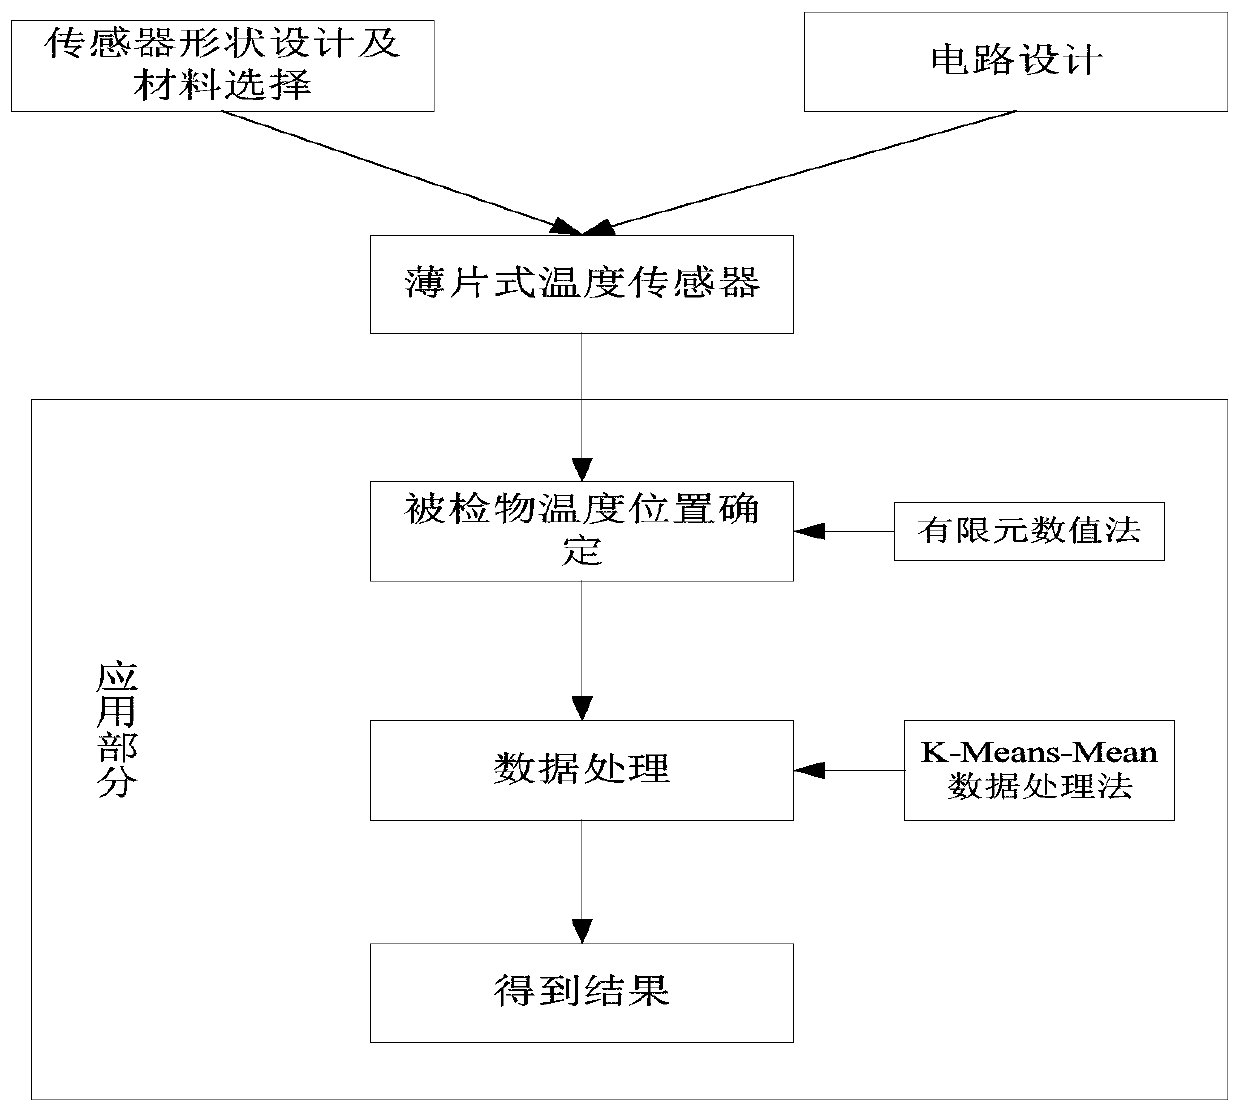
[0121] like figure 1 as shown, figure 1 It is a schematic diagram of the overall framework of this embodiment. This embodiment includes a sheet temperature sensor part and its application part. The sheet temperature sensor part includes sensor shape design, material selection and circuit design; the application part includes determination of the temperature position of the measured object and data processing.
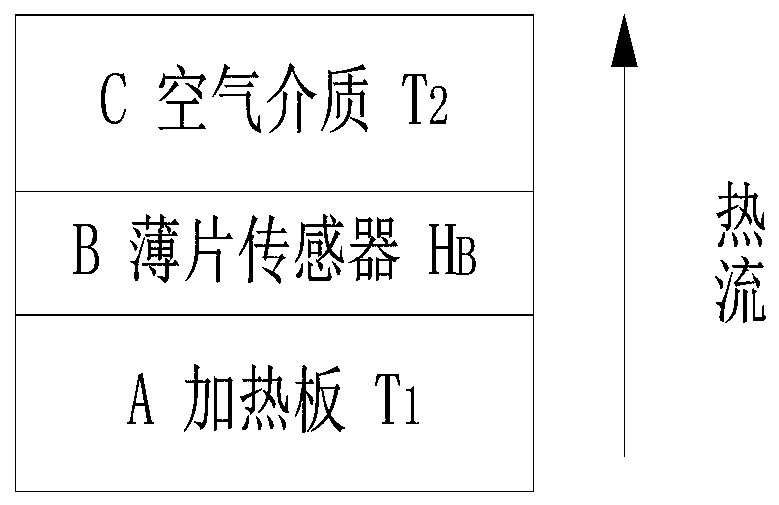
[0122] like figure 2 as shown, figure 2 It is a schematic diagram of the principle of measuring the thermal conductivity of an object by the steady-state plate method (unit: mm). A is the heating plate, the temperature is T1, B is the sheet temperature sensor, and its thickness is H B , C is the air medium, and the temperature is T2. Due to the close contact of the three, the temperature of plate A represents the temperature of the lower surface of the B sheet sensor, the temperature of C represents the temperature of the upper surface of the B sheet sensor, and the area of the B sheet sensor is S. It can be seen that the heat flux value Q sensed by the sheet temperature sensor within a certain period of time is large, that is, the obtained thermal conductivity value is large, and the thermal gradient value is large.
[0123] according to image 3 The calculated value of the thermal gradient in the Y-axis direction, "-" in the figure represents the temperature from high to low, and the value of the sheet temperature sensor is much larger than the value of the traditional circular sensor, thus verifying the correctness of the above derivation results.
[0124] like Figure 4 As shown, the sheet temperature sensor includes a differential amplifier circuit, and the input terminal of the differential amplifier circuit is a platinum resistance thermometer R x , the platinum resistance thermometer R x with resistor R a , resistor R b and resistor R c form a bridge circuit, the reference voltage of the bridge circuit is E r , form a voltage U at both ends of the bridge circuit after being divided by the bridge arms at both ends of the bridge circuit P and U Q , the U P and U Q respectively with the current limiting resistor R i After being connected in series to the positive and negative poles of the input terminal of the operational amplifier, the first stabilizing resistor R is connected in parallel between the output terminal of the operational amplifier and the input terminal of the negative pole of the operational amplifier. f , the second stabilizing resistor R is connected between the positive input terminal of the operational amplifier and the bridge circuit f back to ground.
[0125] The platinum resistance thermometer R x The material is PT100.
[0126] The platinum resistance thermometer R x For the rectangular sheet type.
[0127] The sheet temperature sensor has a thickness of (0.002-0.003) m, a width of (0.02-0.04) m, and a length of (0.04-0.06) m.
[0128] The working process of the sheet temperature sensor of the present embodiment is as follows:
[0129] (1), such as Figure 4 As shown, the sheet temperature sensor is connected to the interface of the temperature inspection instrument to form a complete temperature detection circuit, where E r —reference voltage; R X —Thermistor (resistance value changes with temperature); Ra, Rb, Rc—resistance of the bridge circuit (R X , Ra, Rb, Rc form a bridge circuit), R i —Current limiting resistor (to prevent excessive current), R f — Zener resistor (if there is no R f Then the output value Uo is zero, R f values much larger than R i value), A—operational amplifier (amplifies the voltage of P, Q).
[0130] (2), such as Figure 5 As shown, the sheet temperature sensor is placed between the cold plate and the hot plate of the thermal conductivity meter.
[0131] (3) Comparison of detection time and sensor arrangement points. Based on the most widely used thermal conductivity tester at present, the temperature setting value of the hot plate is 35°C. When in use, it is first turned on to preheat, and then enters the normal working stage. After half an hour of preheating, the temperature distribution cloud picture of the hot plate is as follows: Image 6 shown.
[0132] The result of measurement at this time is that the temperature is between (30.6~31.96)°C, and the error generated is larger compared with the set temperature of 35°C. After running for 1 hour, the temperature distribution cloud image of the hot plate is as follows: Figure 7 shown.
[0133] At this time, the temperature of the measurement result is between (33.89~34.236)°C, the uniformity is 0.34°C, and the maximum difference is 1.1°C compared with the set temperature of 35°C. Taking the Y-axis of the thermal conductivity measuring plate as the reference direction, take several points to observe the temperature change curve of the temperature heating plate, such as Figure 8 shown. The temperature oscillation on the Y axis is relatively severe, that is to say, the temperature change does not tend to be stable. The cloud map of temperature distribution after running for 1.5h is as follows Figure 9 shown.
[0134] The measurement result at this time is between (34.72~34.81)°C, and the temperature uniformity is 0.08°C. Compared with the set temperature of 35°C, the maximum error is 0.28°C, which is very small.
[0135] Taking the Y-axis of the thermal conductivity measuring plate as the reference direction, observe the axial temperature change as follows: Figure 10 shown.
[0136] from Figure 10 It can be determined that the temperature on the thermal conductivity heating plate is the most dense (34.764~34.783) ℃. Therefore, the temperature measured here can best represent the actual temperature of the heating plate (other temperatures can be removed as singularities).
[0137] From the figure above, it can be seen that the four corners of the hot plate of the thermal conductivity tester are the cold spots of the whole hot plate during the heating process. Therefore, in order to avoid cold spots, the measuring ends of the thermometer are selected to be placed at the geometric centers of the cold plate and the hot plate. point and the distance from the edge of the standard plate) (12 ~ 15) mm four points and the geometric center point are the best positions for detection, as follows Figure 11 shown.
[0138] Conclusion: ①The error is 1°C, and the measurement is made 1 hour after the start-up of the thermal conductivity tester. The arrangement points of the measuring sensors are as follows: Figure 11 shown;
[0139] ② The error is 0.3°C, measured 1.5 hours after the start-up of the thermal conductivity tester, and the arrangement points of the measuring sensors are as follows: Figure 11 shown.
[0140] (4), temperature recording and data processing:
[0141] Place this sheet temperature sensor in accordance with Figure 11 Place it on the heating plate of the thermal conductivity tester, wait for it to run for 1.5 hours and start reading, record the data of all sensors every 30 seconds, and record 60 times within 30 minutes.
[0142] Calculation of temperature error:
[0143] Δt d = t d -t o
[0144]
[0145] In the formula: t d —The average value of the temperature displayed by the thermal conductivity tester; t o — the average temperature of the central point; Δt d —The deviation value of the temperature.
[0146] Calculation of temperature uniformity:
[0147] Arithmetic mean of the difference between the temperature maximum and minimum values in each measurement.
[0148]
[0149] In the formula: t imax —The maximum temperature of each sensor in a certain measurement; t imin —The minimum temperature of each sensor in a certain measurement; n—is the number of measurements; Δt u— is the temperature uniformity.
[0150] (5), data processing:
[0151] This embodiment discloses a method of temperature data processing K-Means-Mean algorithm, wherein K-Means is a clustering algorithm used to identify singular points in the recorded data, and the latter Mean is to find the average value of the temperature, the algorithm idea And the process is as follows:
[0152] First use the A matrix to represent the sample data:
[0153]
[0154] Calculate the distance formula between sample data:
[0155]
[0156] In formula (6), q is a positive integer. When q=1, it is Manhattan distance; when q=2, it is expressed as Euclidean distance.
[0157] Process:
[0158] ① Randomly select k objects from all sample data as the initial cluster center;
[0159] ② Calculate the distance of each cluster center of each sample separately, and assign the object to the nearest data class;
[0160] ③ After all objects are allocated, recalculate k cluster centers;
[0161] ④ Compared with the k cluster centers obtained from the previous calculation, if the cluster centers change, go to step (2) otherwise go to step (4);
[0162] ⑤ Stop and output the clustering results when the centroid does not change;
[0163] ⑥ After removing the singular value according to the output result, the normal temperature measurement result is obtained;
[0164] ⑦Bring the data result into Δt d = t d -t o and Find the final result.
[0165] According to step (4), use 5 sets of data measured by 5 temperature sensors within a specified time, and each set contains 60 temperature records, that is, a 60×5 matrix is formed, and a sample data matrix A is randomly selected. The result looks like this:
[0166]
[0167] Let q=2 in the formula (6), that is, the Euclidean distance is selected in this application, and the randomly selected sample matrix A is brought into the formula (6) to obtain d(i,j)≈1.06.
[0168] Taking point P of the sensor as an example, 60 data were recorded within 30 minutes, the K value of clustering was set to 1 (need to be divided into one group), and the number of iterations was 500. After 500 cycles, the final The distance threshold is set to 15, and the obtained results are as follows Figure 12 shown. Eliminate the 48th and 57th data among the 60 data, and substitute the remaining 58 data into , get t o =34.667, substitute into Δt d = t d -t o The indication error Δt is obtained from d = t d -t o =35-34.667=0.333. Compared with the (2-3) °C error detected by the circular platinum resistance sensor, its accuracy has been greatly improved.
[0169] Substitute the recorded data into the Among them, the uniformity of this measurement is 0.225°C.
[0170] The basic principles, main features and advantages of the present invention have been shown and described above. Those skilled in the industry should understand that the present invention is not limited by the above-mentioned embodiments. What are described in the above-mentioned embodiments and the description only illustrate the principle of the present invention. Without departing from the spirit and scope of the present invention, the present invention will also have Variations and improvements all fall within the scope of the claimed invention. The protection scope of the present invention is defined by the appended claims and their equivalents.