Agricultural product quality analysis method and device

A technology for quality analysis and agricultural products, applied in the field of spectral analysis, can solve the problems of low efficiency of agricultural product quality inspection, aggravating analysis work hardware, software difficulty, etc.

Active Publication Date: 2019-06-04
BEIJING ACADEMY OF AGRICULTURE & FORESTRY SCIENCES
View PDF9 Cites 7 Cited by
  • Summary
  • Abstract
  • Description
  • Claims
  • Application Information

AI Technical Summary

Problems solved by technology

[0009] The concept of the present invention is as follows: Aiming at the problem that there is a large amount of redundant information in the spectral data, which increases the difficulty of the analysis work hardware and software, in order to realize the non-destructive and fast analysis and/or grading of the quality of agricultural products, a spectral variable selection method is provided: obtain spectral data and measure Reference value data; divide the data after removing outliers into a correction set and an external verification set; based on a series of correction data generated by the Monte-Carlo (MC) sampling method, the UVE (UniformativeVariable Elimination, non-informative variable Elimination) algorithm combined with CARS (Competitive Adaptive Reweighted Sampling, combined with competitive adaptive reweighted sampling) algorithm, the data is screened for secondary key variables and the freq

Method used


Image

  • Agricultural product quality analysis method and device
  • Agricultural product quality analysis method and device
  • Agricultural product quality analysis method and device

Examples


Embodiment 1

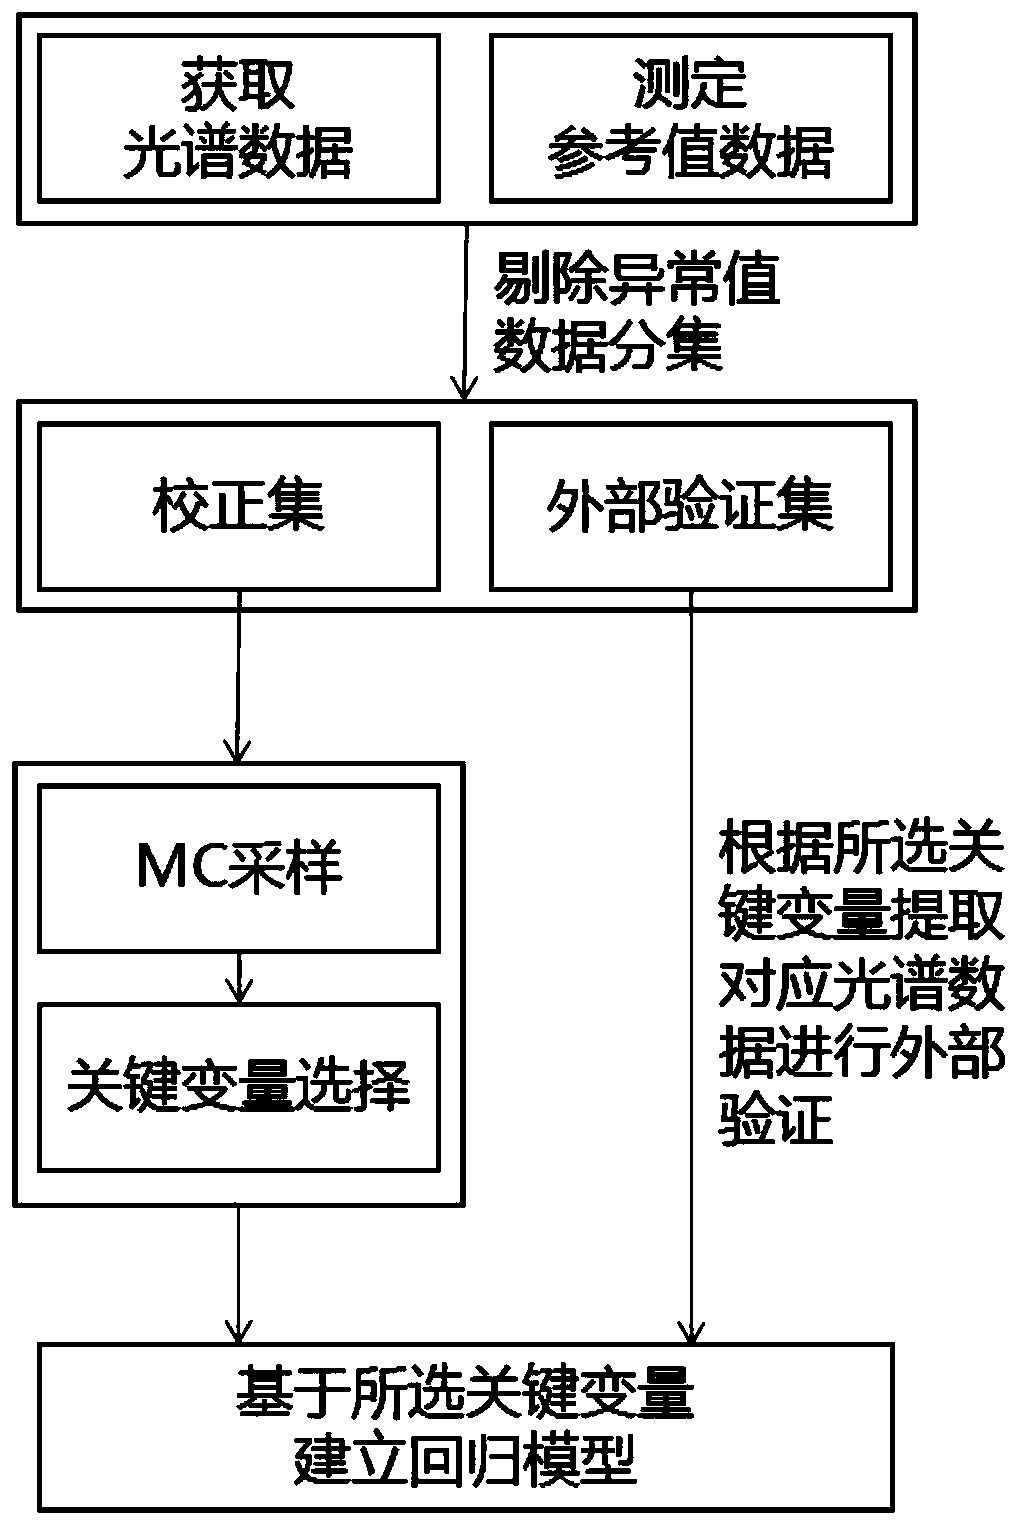
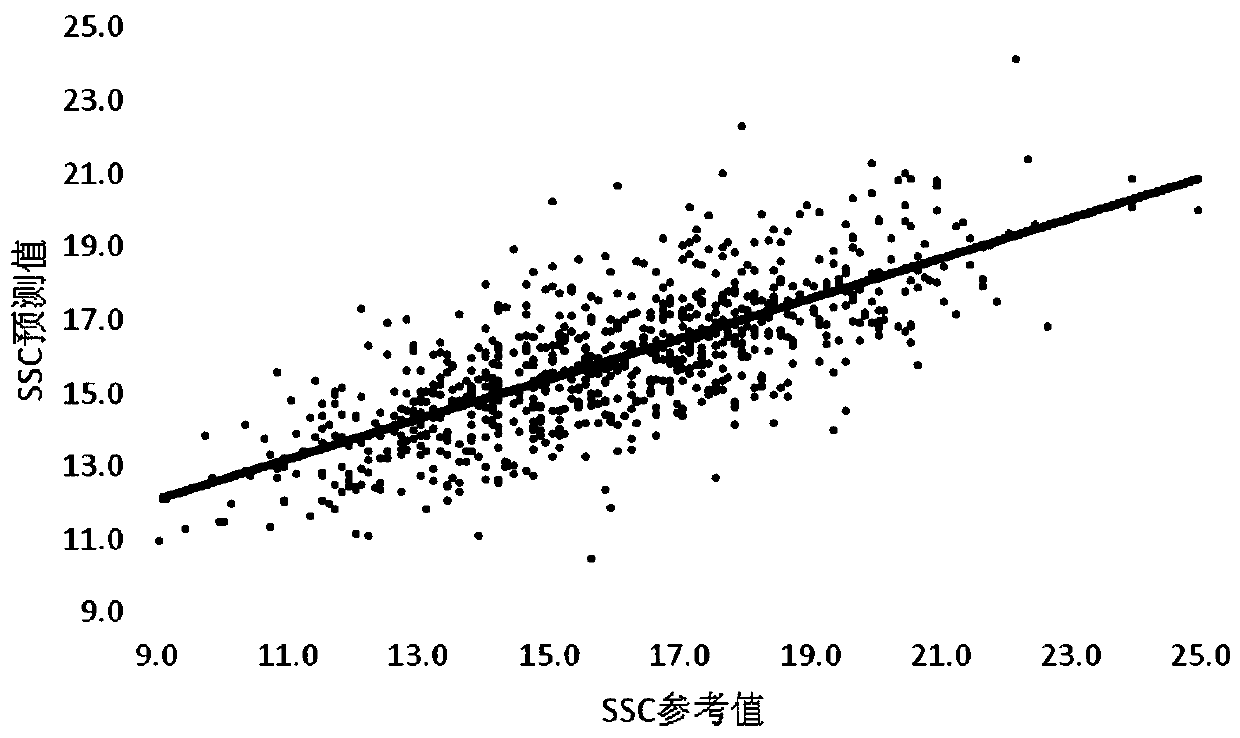
[0116] Example 1 Selection of Key Variables for Detection of Cherry Sugar Level and Model Establishment and Evaluation

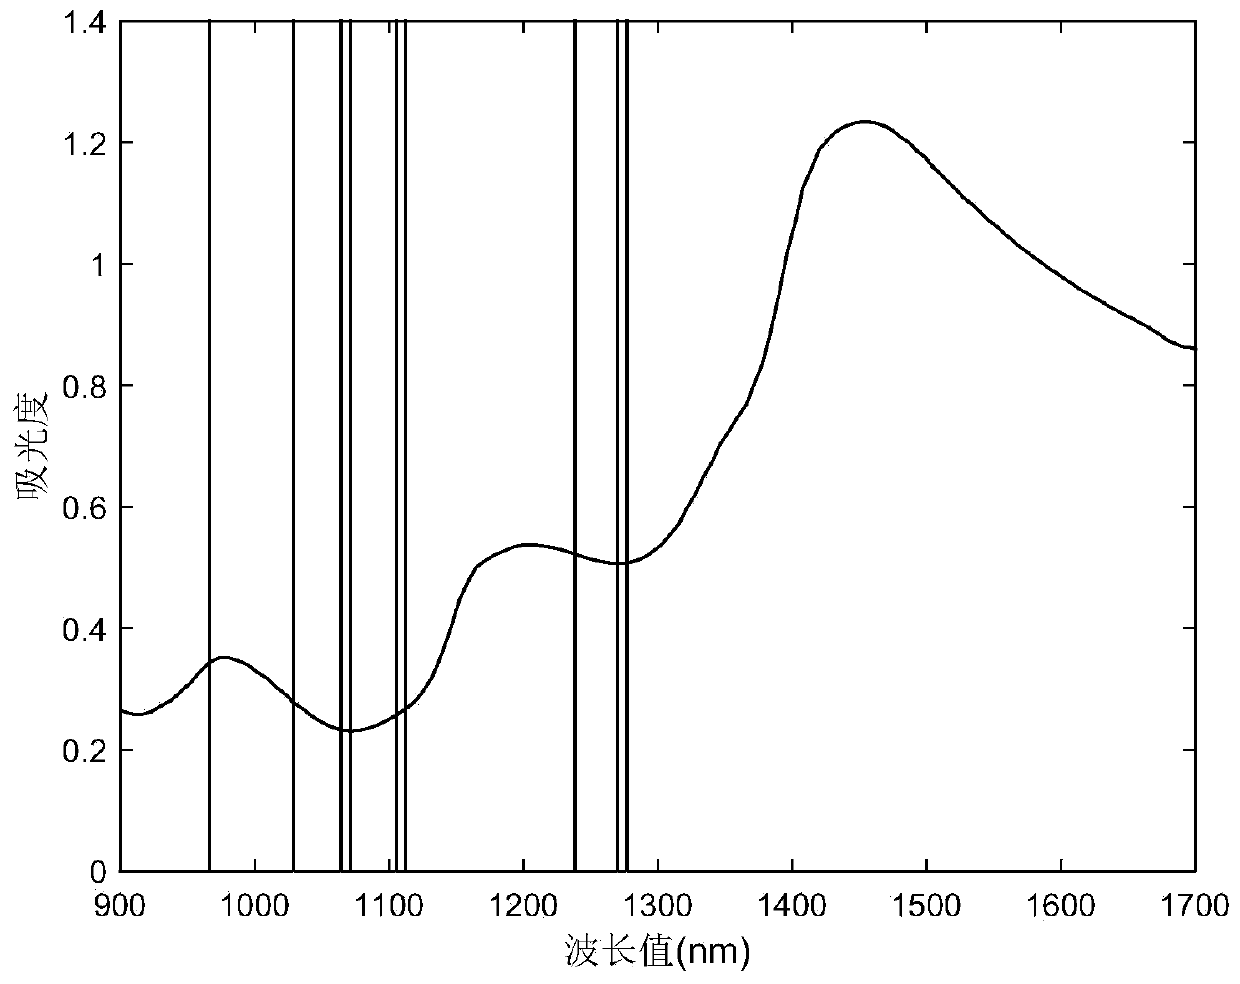
[0117] The agricultural products described in this embodiment are cherries, preferably produced in Tongzhou, Beijing; SSC performs reference value determination. The spectrum used is near-infrared spectrum, and the DLP technology near-infrared spectrometer is used to collect the overall experimental data. The instrument parameters are as follows: a polytetrafluoroethylene white board is used as a spectral background reference; a single integration time is 50ms; 50 times of accumulation are averaged; wavelength range 901.841nm~1700.930nm, spectral center resolution 8.00nm~12.00nm, preferably 9.36nm, original spectral variable number 128, spectral variable interval 4.882nm~7.883nm, preferably spectral variable interval 6.292nm.

[0118] Eliminate outliers, use the pre-modeling residual as the outlier judgment standard, and set the pre-modeling residual thresh...

Embodiment 2

[0142] Example 2 Based on the selected key variables, a non-destructive rapid analyzer for agricultural product quality was developed and the quality analysis and grading of cherries were carried out

[0143] In order to realize the non-destructive and rapid grading of cherry quality, a non-destructive and rapid analyzer for the quality of agricultural products was developed, and the development of a non-destructive and rapid analyzer for the quality of agricultural products based on the selected key variables and the quality grading of cherries were explained in conjunction with the accompanying drawings.

[0144] The analyzer is based on the key variable selection and the mathematical model, including an optical system, a circuit system, a control system, and a data storage and processing system; the analyzer stores the data collected by the optical system, and extracts the results according to the variable selection Key variable data, call the mathematical model to perform d...


PUM

PropertyMeasurementUnit
Diameteraaaaaaaaaa

Abstract

The invention provides an agricultural product quality analysis method and device. The agricultural product quality analysis method comprises the steps that spectral data are acquired, and reference value data are determined; the data are divided into a correction set and an external verification set; a composite variable selection algorithm is combined with the Monte Carlo sampling method to select a key variable; and a mathematical model is established based on the selected variable, and blind sample verification is carried out by using the external verification set. Based on the method, anagricultural product quality analysis device based on a digital light processing core is developed, and comprises an optical system, a control system, a circuit system and a data storage and processing system. The device stores data collected by the optical system, extracts key variable data according to the variable selection result, calls the mathematical model to perform data calculation basedon the key variable for a sample to be tested to acquire quality data, and carries out analyzing/classifying according to the quality data. According to the invention, spectral data information can begreatly simplified; the working efficiency of an analysis instrument is improved; and a technical reference is provided for non-destructive rapid and accurate classification of the agricultural product quality.

Description

technical field [0001] The invention belongs to the field of spectral analysis, and in particular relates to a method and device for analyzing the quality of agricultural products. Background technique [0002] Spectral analysis has the technical characteristics of fast, efficient, non-destructive, and environment-friendly, and has always been an important analysis method in the field of fast and non-destructive analysis. In the field of industrial and agricultural production, multispectral analysis represented by near-infrared spectroscopy has become a popular research field in recent years. Taking near-infrared spectroscopy as an example, because it is caused by the combined and doubled frequency absorption of hydrogen-containing groups, it often presents the characteristics of mixed spectral peaks and the inability to obtain a single characteristic peak of the substance. In view of the above characteristics, traditional spectral analysis often uses full-spectrum multivar...

Claims


Application Information

Patent Timeline
IPC IPC(8): G01N21/25
Inventor 王冬韩平张鹤冬贾文珅罗娜王卉马智宏
Owner BEIJING ACADEMY OF AGRICULTURE & FORESTRY SCIENCES
Why Eureka
Try Eureka