Method for rapidly detecting adulteration of melamine tableware by using infrared spectrum
A technology of infrared spectroscopy and tableware, applied in the field of detection, can solve the problem of not being able to identify the amount of urea-formaldehyde resin added to the blended molded dinner plate, and achieve the effect of simple operation and reliable technology
- Summary
- Abstract
- Description
- Claims
- Application Information
AI Technical Summary
Problems solved by technology
Method used
Image
Examples
Embodiment 1
[0029] (1) Making tableware: use urea-formaldehyde resin powder and melamine resin powder to make standard melamine resin tableware (A5), urea-formaldehyde resin tableware (A1) and melamine-urea-formaldehyde blend molded tableware (A1-A5). Among them, the melamine urea-formaldehyde blended molded tableware (A1-A5) is 1:9, 2:8, 3:7, 4:6, 5:5, 6:5, 7 according to the mass ratio of melamine resin and urea-formaldehyde resin :3, 8:2, 9:1 ratio production.
[0030] (2) Detection spectrum: Infrared spectra of standard melamine resin tableware (A5), urea-formaldehyde resin tableware (A1) and melamine urea-formaldehyde blend molded tableware (A1-A5).
[0031] (3) Model building: Import the infrared spectra obtained from standard melamine resin tableware (A5), urea-formaldehyde resin tableware (A1) and melamine urea-formaldehyde blend molded tableware (A1-A5) into the TQ analyst spectral analysis software , randomly select 75% of the infrared spectra of three types of tableware as a c...
Embodiment 2
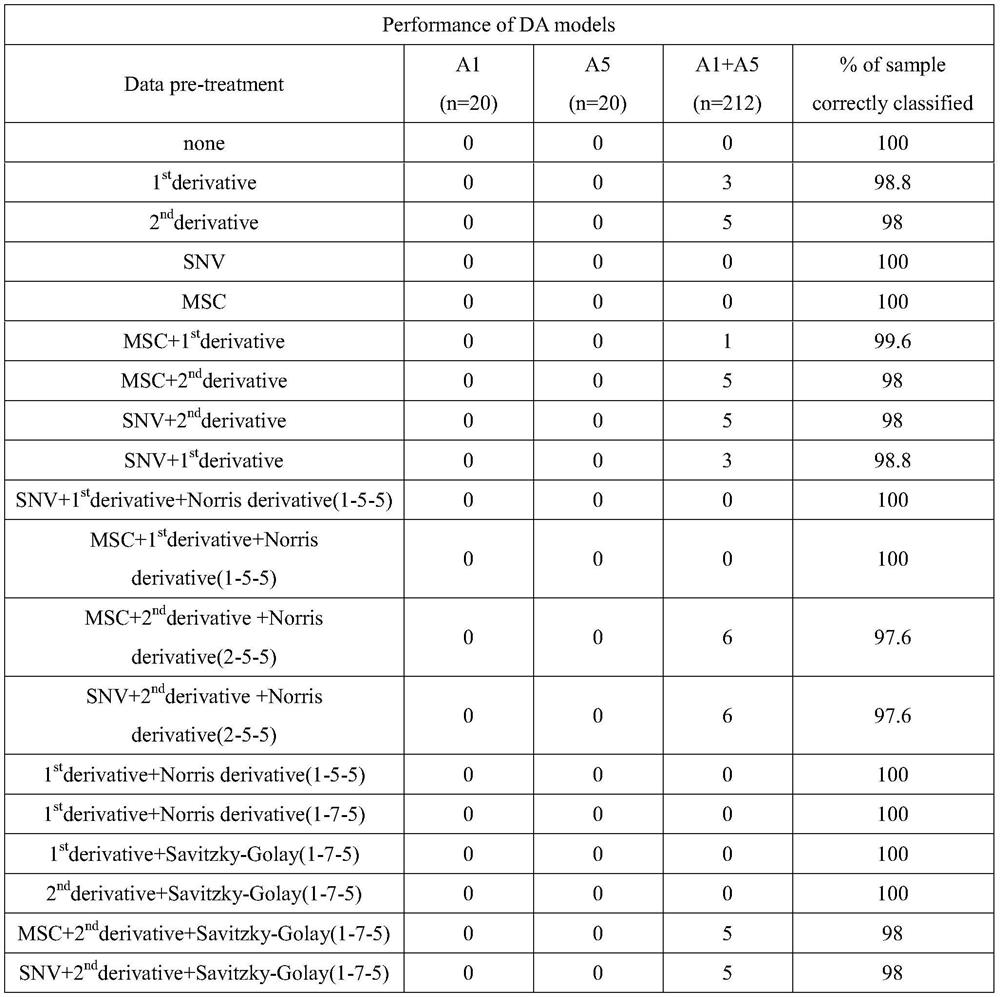
[0033] Qualitative modeling:
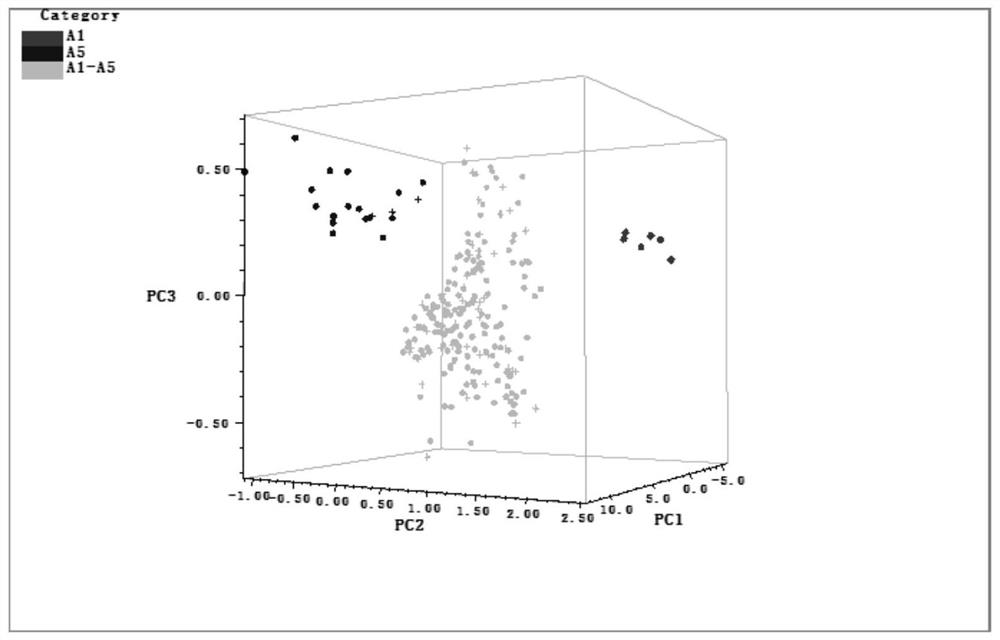
[0034] (1) Create a model file in the TQ analyst spectral analysis software, select DA as the modeling function, define the names of standard melamine resin tableware, urea-formaldehyde resin tableware, and melamine-urea-formaldehyde blended tableware, and establish standard melamine tableware through DA The qualitative model of the infrared spectrum of resin tableware, urea-formaldehyde resin tableware and melamine-urea-formaldehyde blended molded tableware is obtained, and the calculation results and classification distribution diagrams are obtained, such as figure 1 As shown, it can be seen that the infrared spectra of the three types of tableware are well separated, and there is basically no overlap.
[0035] figure 1 Among them, the tableware on the same side as the PC3 axis is unadulterated standard melamine resin tableware, the tableware on the same side as the PC1 axis is urea-formaldehyde resin tableware, and the tableware on the middle...
Embodiment 3
[0040] Quantitative modeling:
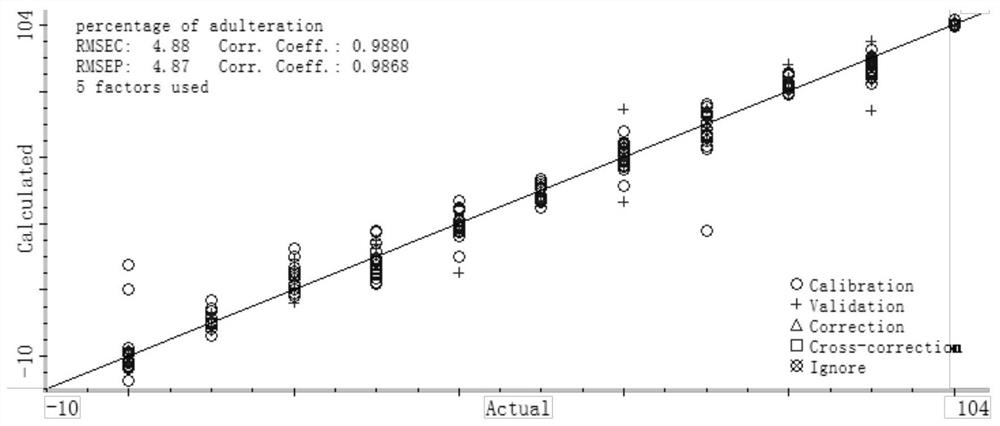
[0041] (1) Create a model file in the TQ analyst spectral analysis software, select PLS as the modeling algorithm, select a constant optical path, and define the names of standard melamine resin tableware, urea-formaldehyde resin tableware and melamine-urea-formaldehyde blended molded tableware respectively, and carry out feasible For the performance test, add the infrared spectrograms of three types of tableware, use MSC for spectral pretreatment, and choose 600-4000cm -1 Spectral range, save the quantitative model, and get the calculation result of the quantitative model.
[0042] (2) Use the cross-validation method to verify the quantitative model, and evaluate the performance of the quantitative model by the correlation coefficient R and the predicted mean square error RMSEP between the infrared spectrogram NIR prediction values of the three types of tableware in the verification set and their actual values, as shown in Table 2 shown.
...
PUM
 Abstract
Description
Claims
Application Information
 - R&D
- Intellectual Property
- Life Sciences
- Materials
- Tech Scout
- Unparalleled Data Quality
- Higher Quality Content
- 60% Fewer Hallucinations
Browse by: Latest US Patents, China's latest patents, Technical Efficacy Thesaurus, Application Domain, Technology Topic, Popular Technical Reports.
© 2025 PatSnap. All rights reserved.Legal|Privacy policy|Modern Slavery Act Transparency Statement|Sitemap|About US| Contact US: help@patsnap.com


