Systems and methods for sensing, recording, analyzing and reporting environmental conditions in data centers and similar facilities

a data center and environmental monitoring technology, applied in the field of sensing, measuring, recording and reporting environmental parameters and conditions in facilities, can solve the problems of data center infrastructure being oversized at design, data center construction costing a lot to build, grow and maintain, and consuming a lot of electricity to run properly

Active Publication Date: 2022-08-02
ETA VISION INC
View PDF99 Cites 0 Cited by
  • Summary
  • Abstract
  • Description
  • Claims
  • Application Information

AI Technical Summary

Benefits of technology

[0025]The present disclosure creates flexibility and improves the performance of major infrastructure assets, such as data centers, that are traditionally static. Data center operators will have access to environmental information that previously had never existed or was not feasible to measure at this level of granularity, all in real time. Operators will also have to ability to reconfigure the sensor fleet with nominal input or configuration required, enabling the data required to keep the infrastructure in sync with the IT immediately available. Ultimately, data center operators are empowered to take action with their infrastructure and drive improvements in redundancy, efficiency, IT equipment performance, lower PUE, and decrease operating costs.
[0026]One of the benefits of the present disclosure is that data center operators will be able to review and revise their environmental settings, as described herein, and reduce electricity usage in a way that can offer immediate and ongoing savings. The amount of savings is highly dependent on the size of the data center, the equipment installed, and the infrastructure systems. For example, a typical 800 kw data center could see between $50,000 and $300,000 in power savings annually, which will be even higher as the trend for larger data centers and higher power density continues, thereby increasing these savings.
[0027]Another benefit of the present disclosure is the reduced cost in new designs. The design and commission of new data centers often start off with significantly over designed infrastructure, including designs that go beyond necessary redundancy requirements. Over time, data center operators slowly reach the “limits” of the infrastructure as the IT equipment rapidly changes inside and increases in density. Typically, once those limits have been reached, a consultant or an internal team is called in to redesign and often over design the system update, starting the process all over again.
[0028]The present disclosure, using appropriate sensors and similar devices allows data center operators to have access to data at the granularity required, which does not currently exist. This information can be used for thorough thermodynamic analysis of the environmental systems, allowing for vastly improved efficiencies infrastructure efficiencies, and in many cases deferring the need for major upgrades. Infrastructure upgrades can vary in cost, but typically range between $50,000 and $2,000,000 depending on the size and scope of the improvement. The present disclosure also provides for a reduction in the operational cost of sensor management and data gathering.
[0029]In yet another benefit of the present disclosure, the sensors and software help improve infrastructure utilization and efficiency, increase reliability, and better protect against brown / black out power shortages. The present disclosure also improves monitoring and alarms that can serve as an early warning sign to help prevent a data center outage. According to an Emerson study in 2011, data centers worldwide suffered complete outages an average of 2.5× during the year and lasted an average of 134 minutes per outage. The downtime cost of a data center averages approximately $300,000 per hour resulting in $1,700,000 in downtime per data center per year.
[0032]Standard and custom visualizations will be used to view the low level data, and high level analytics will be used to analyze the performance of the data center and recommend or allow the implementation of measures that increase the efficiency. Standard operating procedures, best practices, audit and compliance logs, and fault detection are built into the software, as described herein. Further, the software can allow for hypothetical analysis to test theoretical scenarios and circumstances. All of the actual measured values and calculated analytics determined by the system can be mapped to the geographic location of the sensors.

Problems solved by technology

Data centers can be large enough to need to be housed in large buildings, and can use an enormous amount of electricity to run properly.
To keep pace with the increasing demand, data center infrastructure has historically been oversized at design.
As such data centers typically cost a lot to build, grow and to maintain.
The infrastructure lag results in inefficient operation of the critical environmental controls that support the IT equipment.
This leads to increases in Power Usage Effectiveness (PUE) and drives up overall operating costs.
In some cases, IT changes can be so significant that the environmental conditions push elements of the IT equipment into fault tolerances and can put quality of service at risk.
This scenario is the state of the art in today's data centers and is very inefficient when there are shifts in IT demand, density, or distribution.
Compounding the problem is that there are frequent upgrades and changes to the IT equipment inside the data center as businesses and operators strive up with improving technologies.
As a result the CAD (Computer Aided Design) drawings used for asset management are constantly out of date.
Over time, incremental IT upgrades increase the loads on the infrastructure until the performance is no longer adequate to safely support the operation of the IT equipment.

Method used


Image

  • Systems and methods for sensing, recording, analyzing and reporting environmental conditions in data centers and similar facilities
  • Systems and methods for sensing, recording, analyzing and reporting environmental conditions in data centers and similar facilities
  • Systems and methods for sensing, recording, analyzing and reporting environmental conditions in data centers and similar facilities

Examples


Embodiment Construction

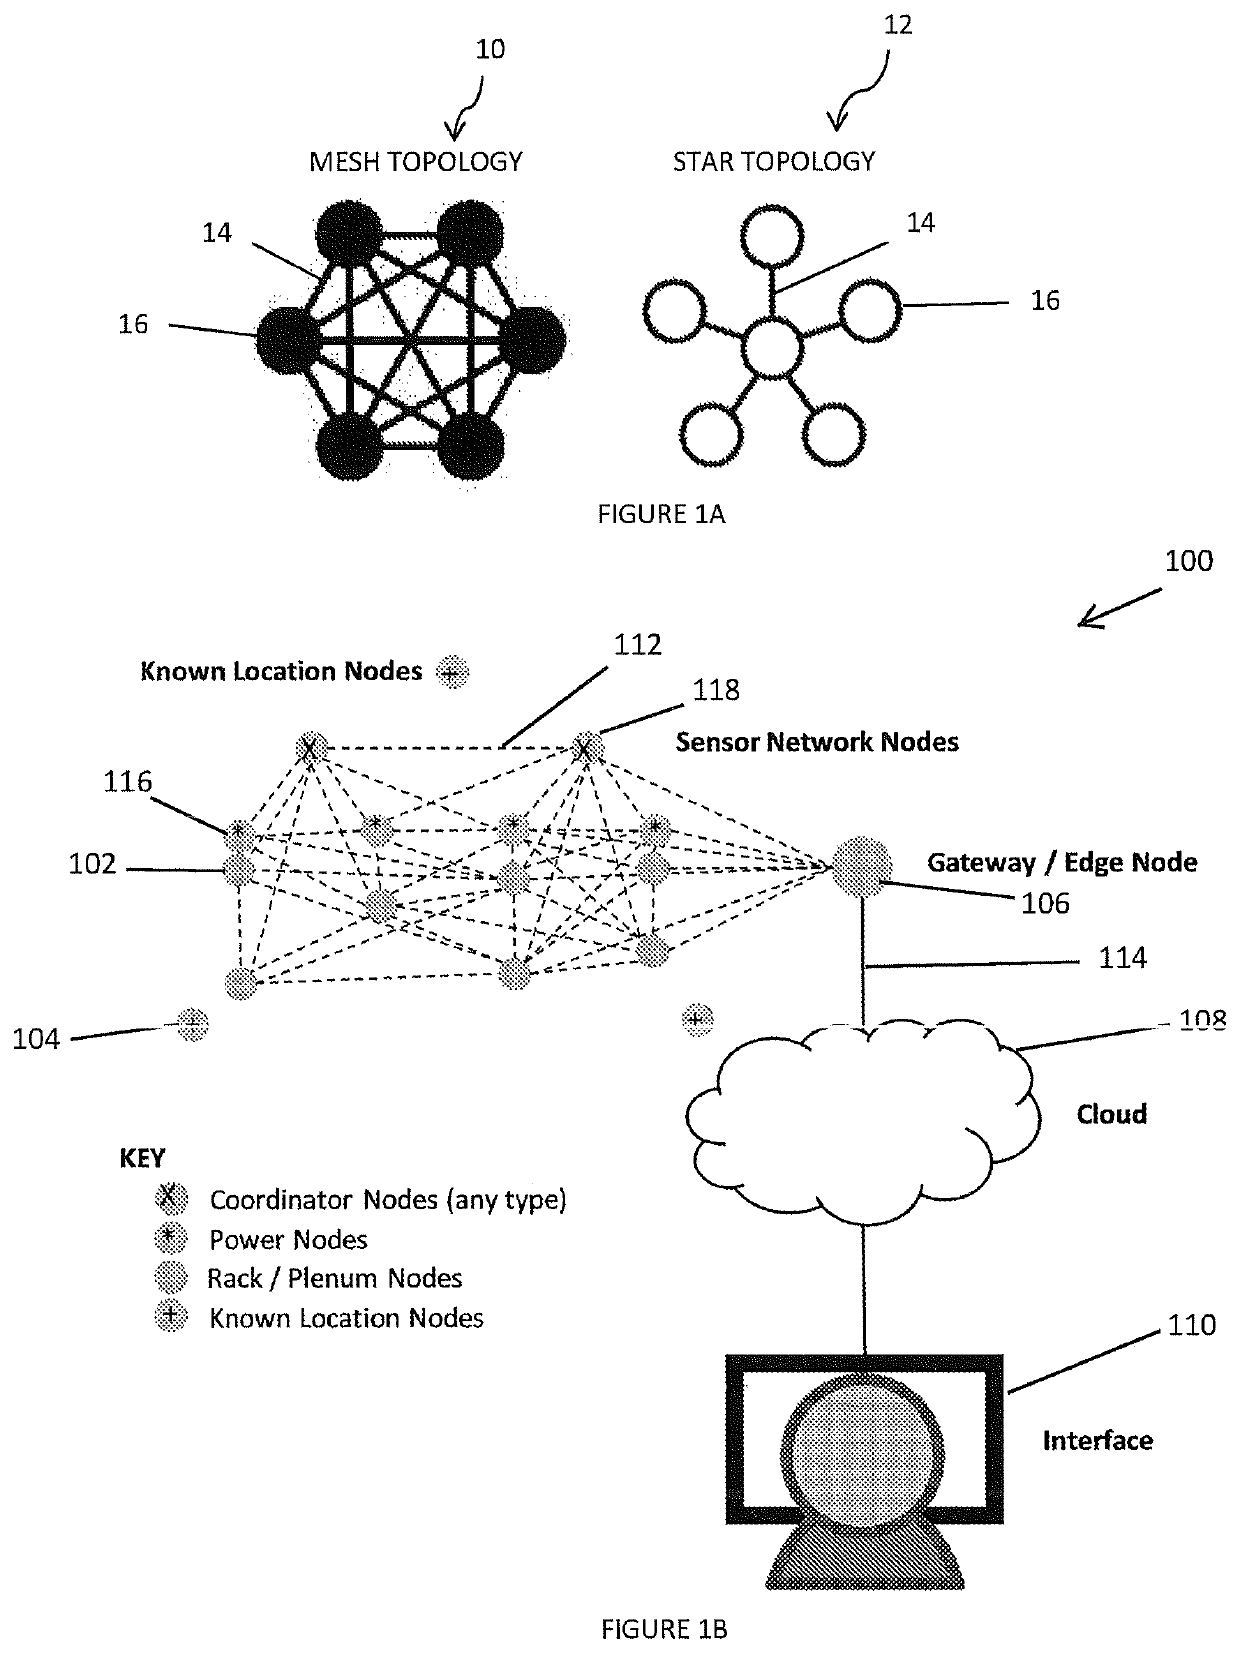
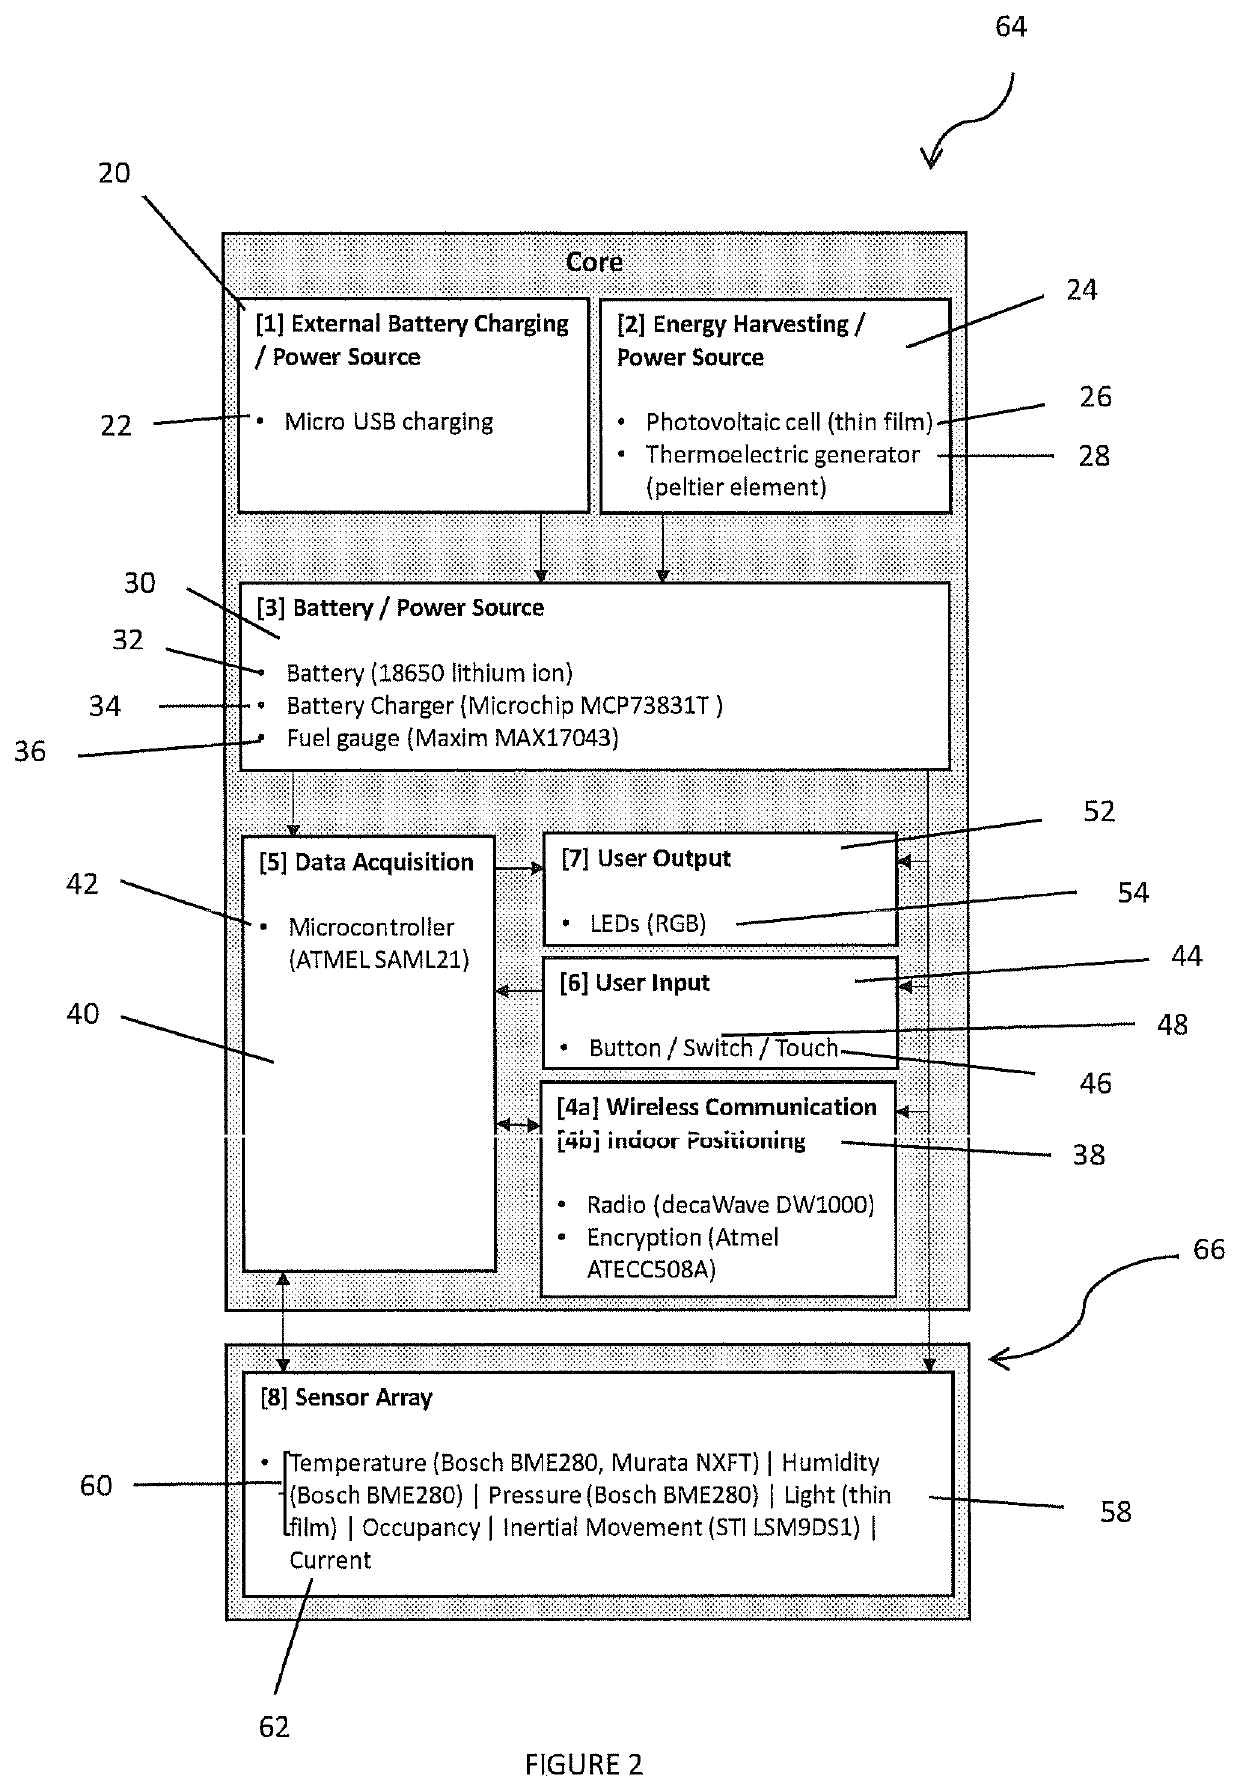
[0058]The present disclosure pertains to systems and methods for obtaining environmental measurements (temperature, pressure, humidity, current, voltage, power, etc.) and associating them with sensor location or positional data and time data at a facility, such as a data center (“the environmental reporting system”). These devices are designed to operate as Internet of Things (IoT) devices that communicate over a customized low power mesh network. They are designed to solve two very complex problems simply: (1) environmental thermodynamic analysis and (2) sensor fleet management.

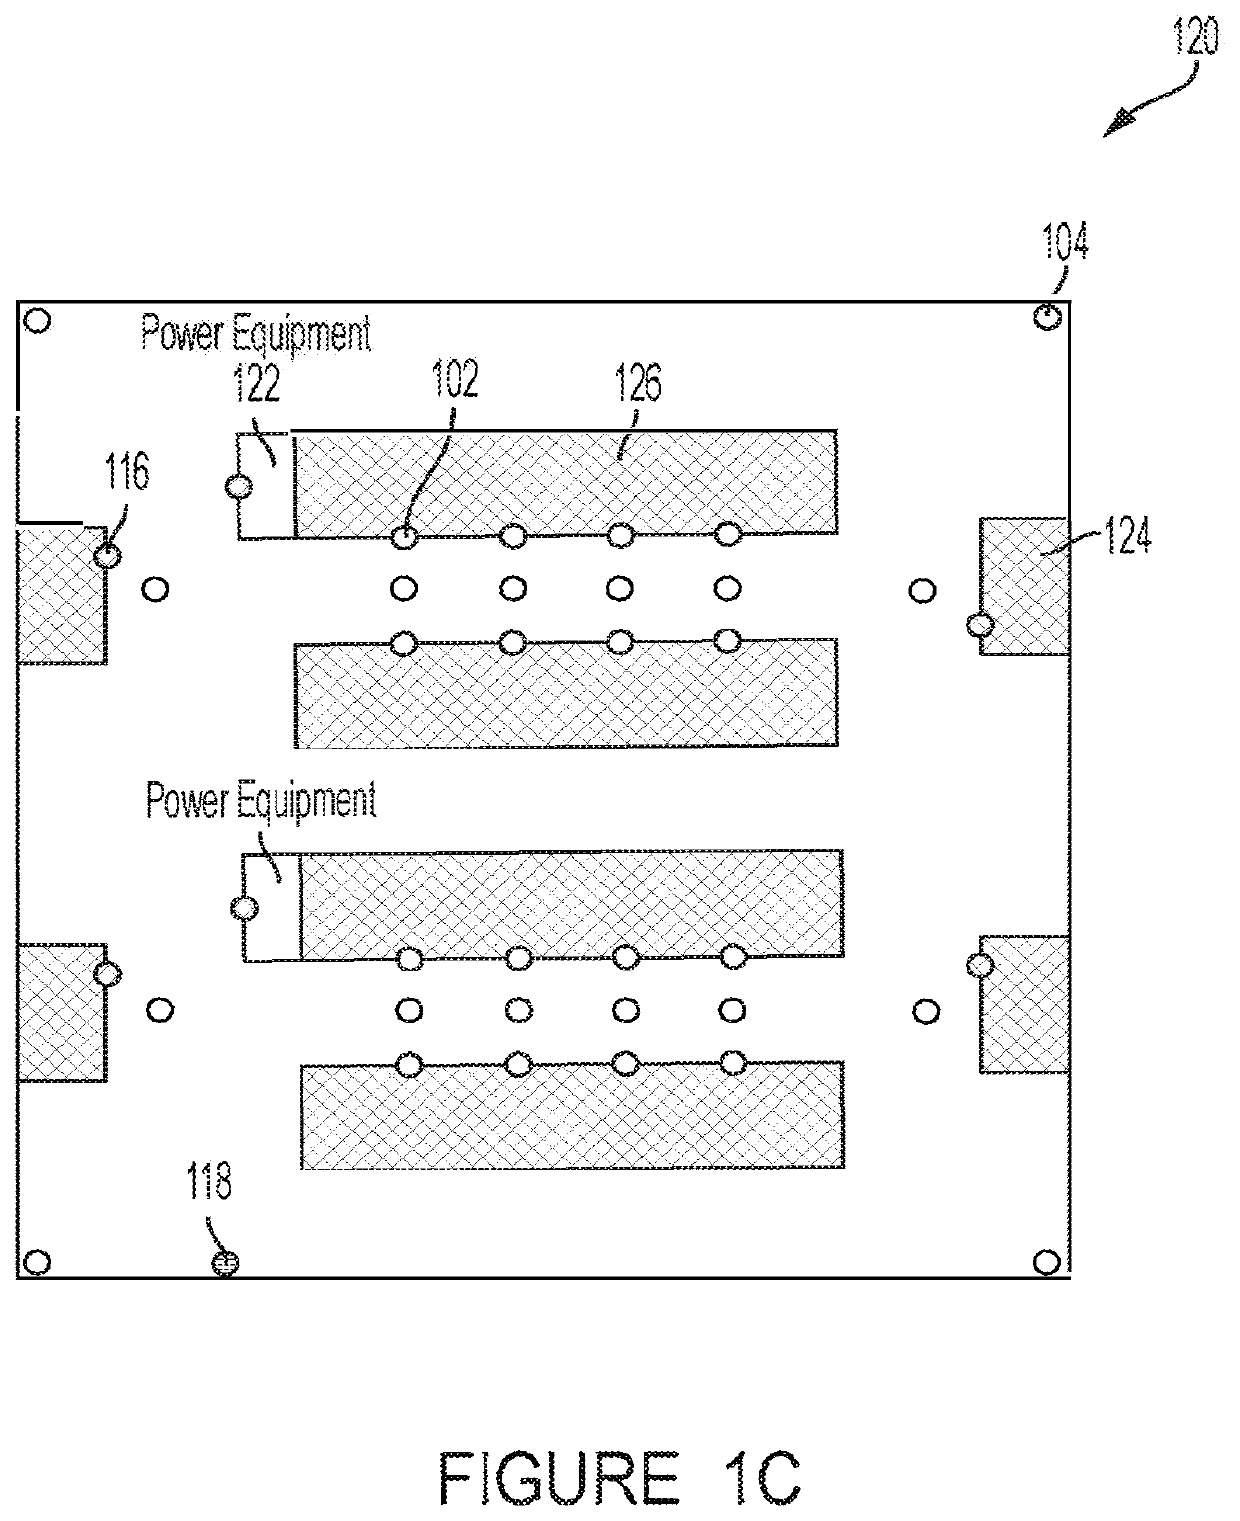
[0059]As described herein, the environmental reporting system provides for the sensing, analyzing and measuring of environmental parameters and conditions, which may include some or all of the following: temperature, air pressure, humidity, and power consumption, and others, at various locations and heights throughout the facility. By using the software associated with the system, the user can receive detail...


PUM


Abstract

The present disclosure pertains to utilizing hardware and software to control and record environmental and other data obtained from sensors and other devices, placed throughout a facility, and analyzing and displaying the information in a detailed status report of the environmental conditions inside facility, and once analyzed, the software can provide recommendations to implement measures that increase the efficiency of the facility.

Description

CROSS-REFERENCE TO RELATED APPLICATION[0001]This application is a continuation of U.S. patent application Ser. No. 16 / 383,216, filed on Apr. 12, 2019, entitled “SYSTEMS AND METHODS FOR SENSING, RECORDING, ANALYZING AND REPORTING ENVIRONMENTAL CONDITIONS IN DATA CENTERS AND SIMILAR FACILITIES”, which is a continuation-in-part of U.S. patent application Ser. No. 15 / 369,537, filed on Dec. 5, 2016, now U.S. Pat. No. 10,516,981, entitled “SYSTEMS AND METHODS FOR SENSING, RECORDING, ANALYZING AND REPORTING ENVIRONMENTAL CONDITIONS IN DATA CENTERS AND SIMILAR FACILITIES”, both of which are hereby incorporated by reference in their entirety herein. This application claims priority to U.S. provisional application No. 62 / 262,715, filed Dec. 3, 2015, entitled SYSTEMS AND METHODS FOR SENSING, RECORDING, ANALYZING AND REPORTING ENVIRONMENTAL CONDITIONS IN DATA CENTERS AND SIMILAR FACILITIES, which is hereby incorporated by reference in its entirety as though fully set forth herein.FIELD OF THE I...

Claims


Application Information

Patent Timeline
Patent Type & Authority Patents(United States)
IPC IPC(8): G06F15/177H04W4/38H04W4/02
CPCH04W4/38H04W4/023H04W4/026H04W4/027H04W4/029H04W4/33G01S13/876G01S13/765G01S5/0036G01S5/14G01S2205/02G01S5/02695G01S5/02585G01S5/017G01S13/0209G01S7/006
Inventor LINGLE, MICHAEL T.CONABOY, MICHAELBOEHNKE, PATRICKASALIAN, KAVEH
Owner ETA VISION INC
Why Eureka
Try Eureka