Method and system for visualizing a body volume and computer program product

a body volume and computer program technology, applied in the field of methods and systems for visualizing the body volume, can solve the problems that the accuracy and information content of diagnosis cannot be substantially increased by the exchange of image information, and achieve the effect of increasing the accuracy of diagnosis and image information content, and different details in tissue structures

Inactive Publication Date: 2002-03-14
BRAINLAB
View PDF0 Cites 91 Cited by
  • Summary
  • Abstract
  • Description
  • Claims
  • Application Information

AI Technical Summary

Benefits of technology

[0012] In accordance with a particularly preferred embodiment of the invention, respectively different methods of diagnosis are used to capture the selected data sets. These different methods of diagnosis may be particularly well suited for resolving different tissue structures. Thus, visualizing the synthesized data set two- or three-dimensionally in accordance with the present invention may also combine the benefits of the respective methods of diagnosis used. It is of particular advantage that visualizing in accordance with the present invention comprises more varied image information and more detail accuracy, such that the accuracy of the diagnosis and also the information content of the image information can be increased.
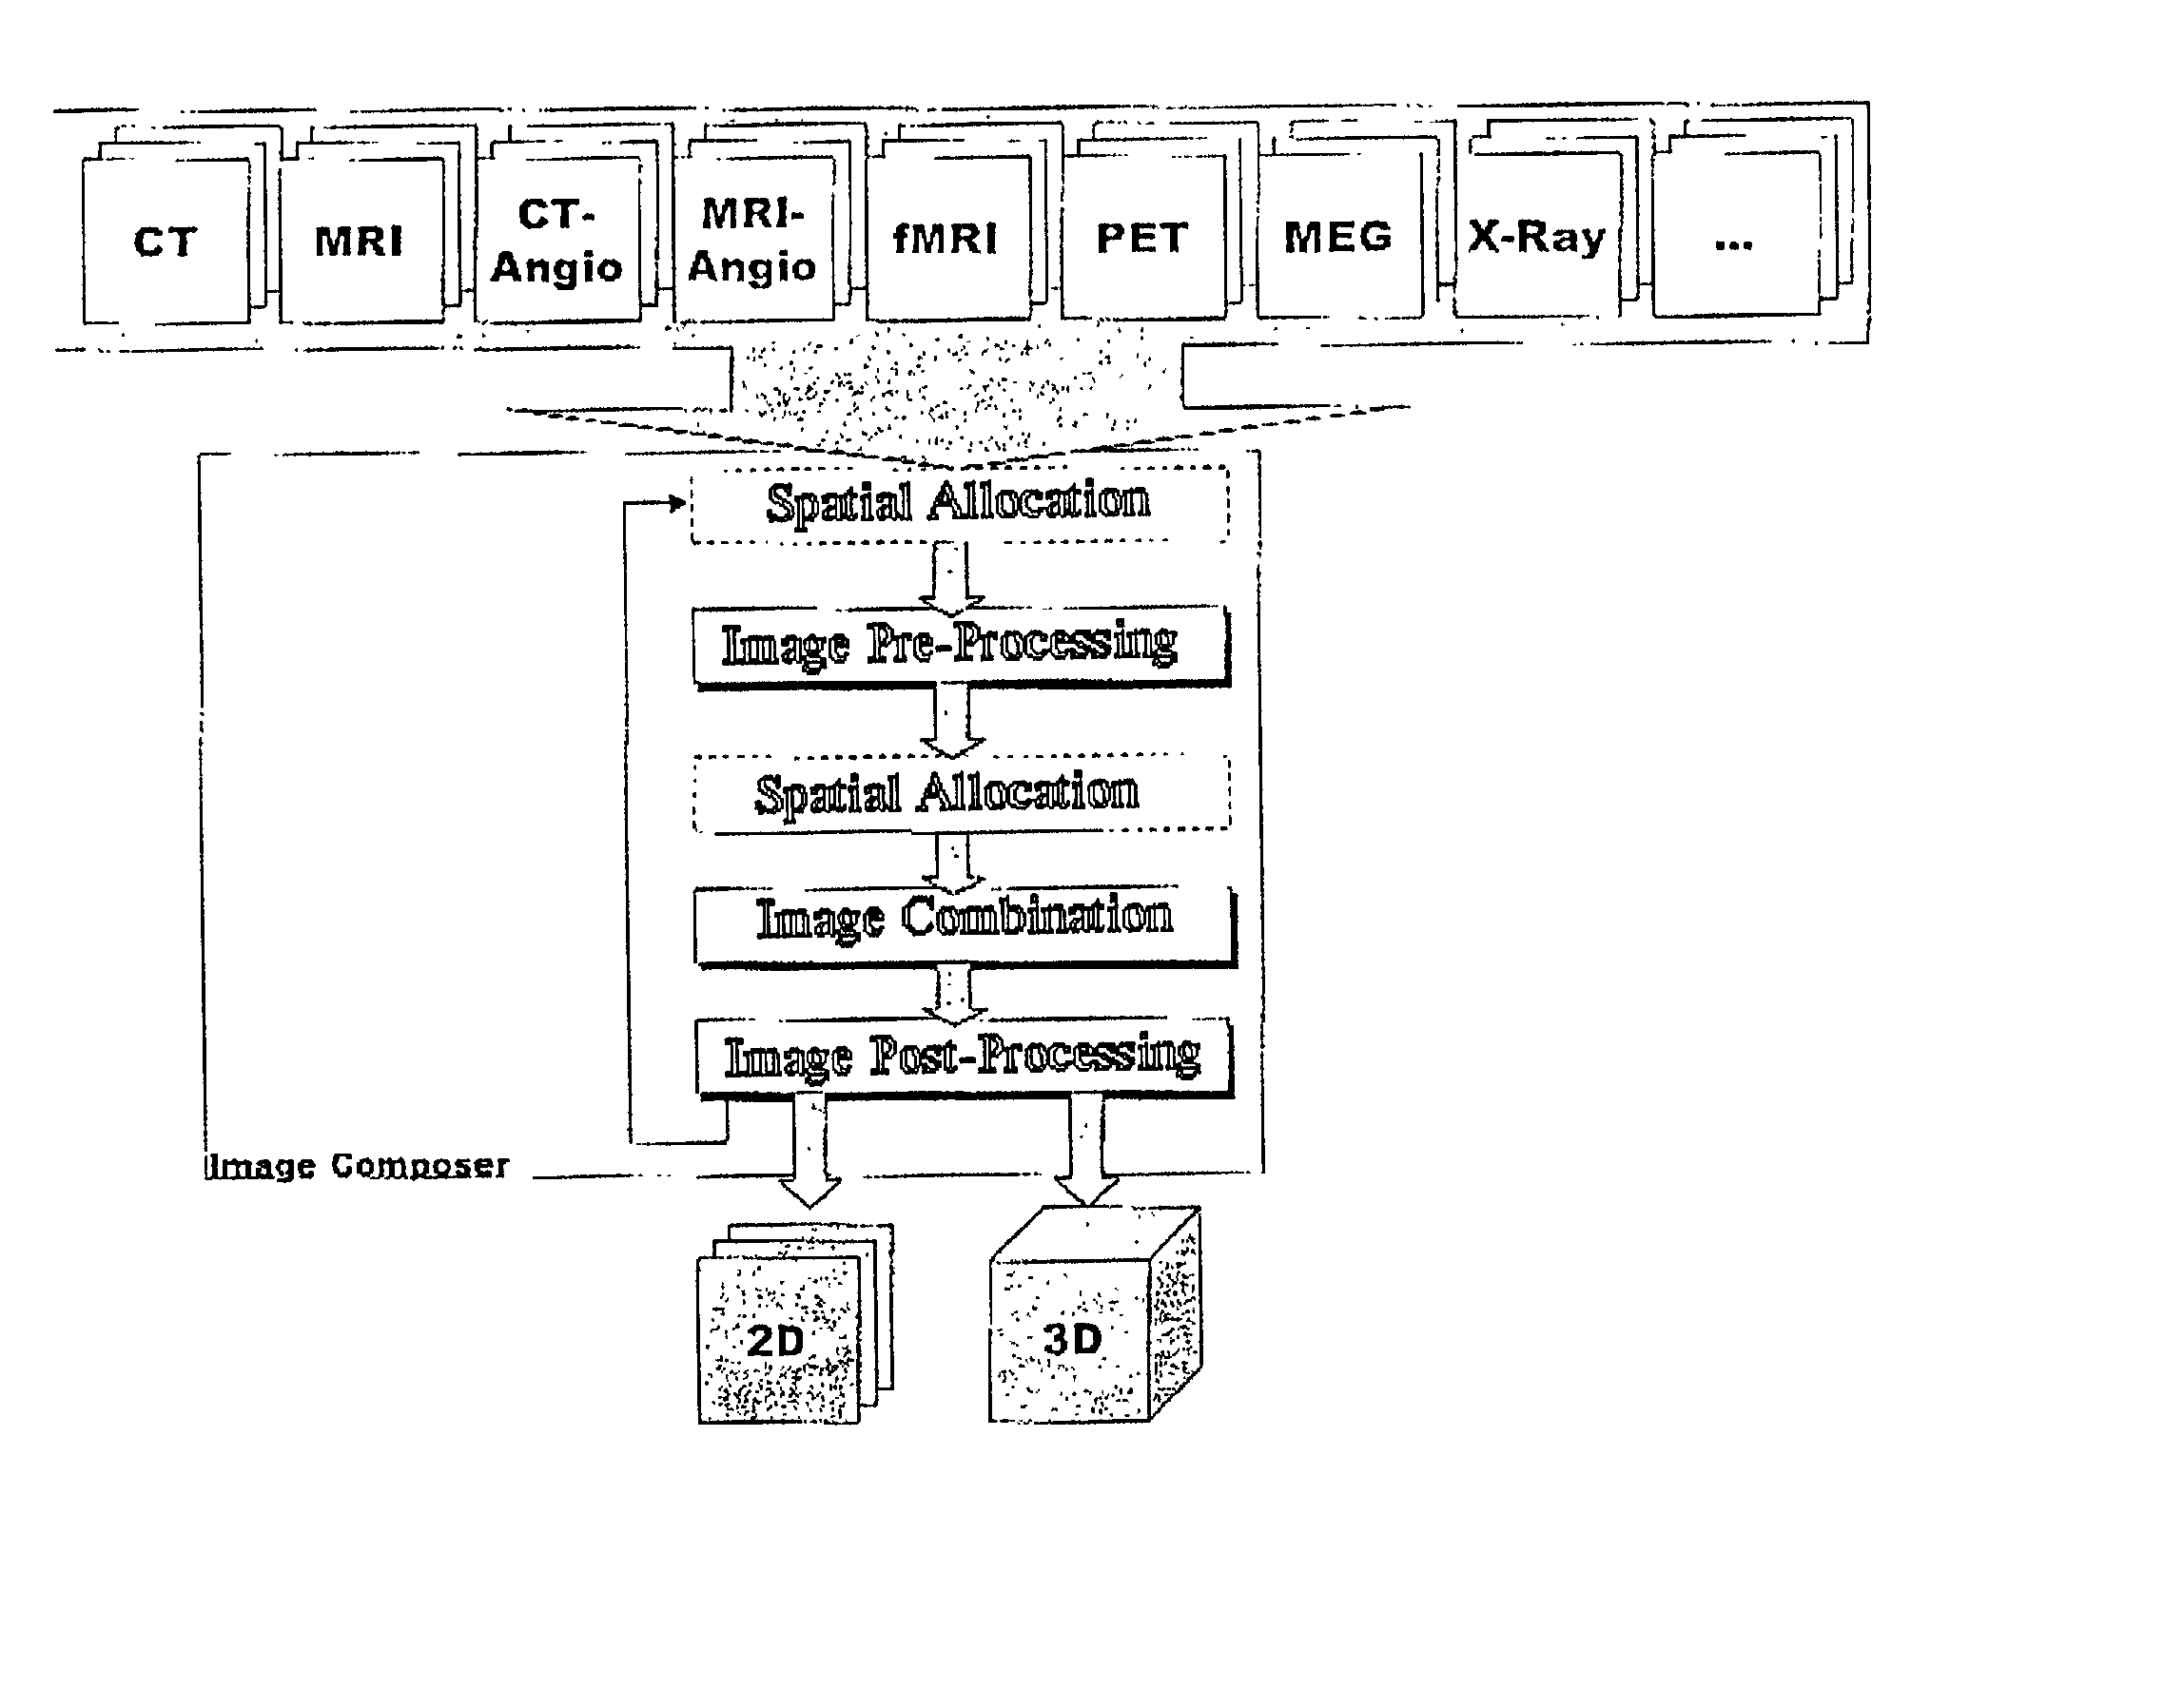
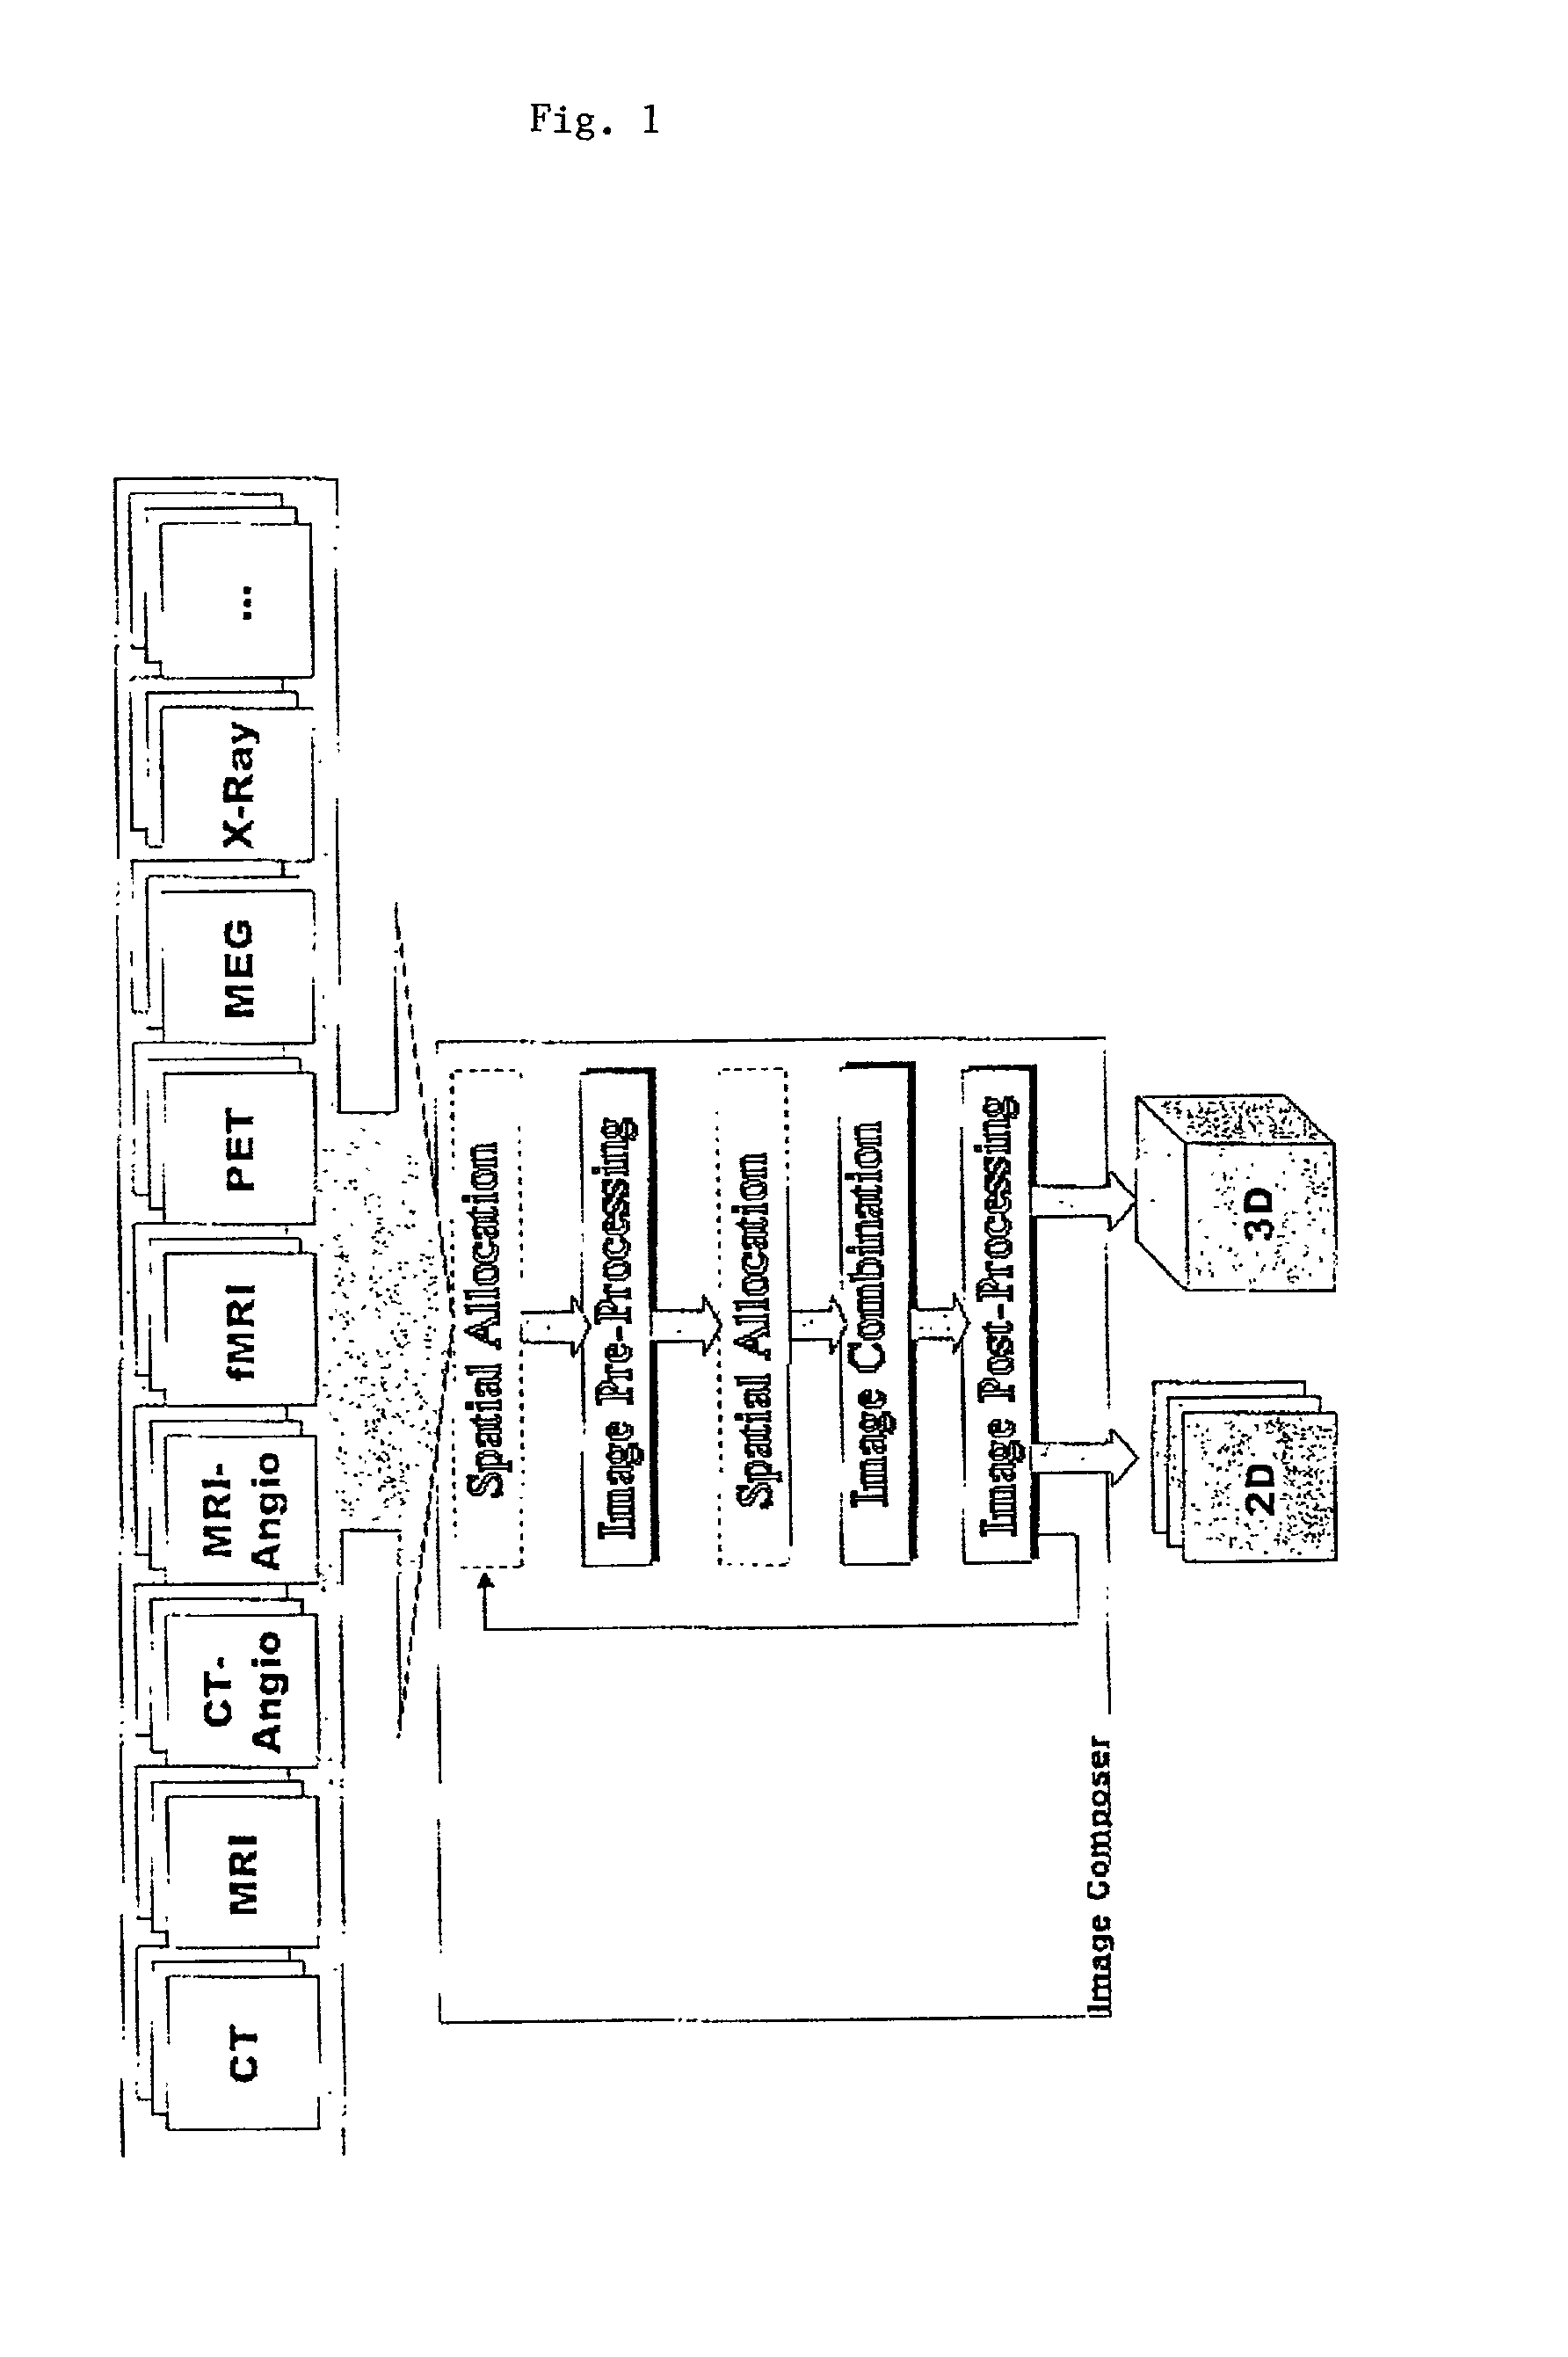
[0013] For example, a CT (computer tomography) method may be used for capturing a first selected data set, by which method bone structures can be particularly well resolved, and an MR (magnetic resonance) method may be used for capturing the second selected data set, by which method hydrogenous tissue structures can be particularly well captured. By suitable image processing of one or more of the selected data sets and / or the synthesized data set, the data originating from the first selected data set, for example, may be particularly highlighted in the synthesized data set at the expense of the data originating from a second selected data set, as detailed in the following. The detail accuracy in visualizing the tissue structure is thus increased. Since for visualizing in accordance with the present invention, the selected data set which is based on the CT method can also be used for synthesizing the image data to be displayed, the synthesized data set can show both the bone structure and the tissue structure in particularly accurate detail and with a high information content, given suitable preparation of the data sets.
[0015] The selected data sets have a predefined spatial orientation relative to each ether, to ensure locationally accurate overlaying of the data in the synthesized data set. The selected data sets are preferably composed or processed beforehand, such that the data values of the data sets are spatially orientated in the same way. This may be achieved by composing or processing the data produced by the method of diagnosis accordingly. The spatially allocation of the respective data values of the selected data sets may, however, also be achieved by computing within the framework of synthesizing the synthesized data set. In this way, distortions of the image, such as may be due for example to the respective method of diagnosis used, can also be corrected. MR data, for example, are often distorted in the outer regions of the volume.
[0017] Expediently, the captured data sets may be captured prior to visualization and buffered on suitable data recording media. Thus, the image data can be subsequently read, for example by a data processing means, suitably composed or processed and visualized three-dimensionally, for example by an additionally consulted physician. In accordance with the present invention, however, one, more or all of the captured data sets may be captured in real time during visualization and, if necessary, additionally synthesized with buffered data sets into a new data set. Advantageously, it is possible in accordance with the invention to work in real time conditions. Information obtained during visualization, which makes changing the capture parameters of the method of diagnosis seem advantageous, for example changing the relevant capture parameters in an ultrasound diagnosis, may be applied directly and in real time in accordance with the invention, and the result displayed on the display. The accuracy of diagnosis and the image information content can thus be increased even further.
[0022] Preferably, the aforementioned parameters used for processing or displaying the image may also be determined manually or automatically. Expediently, 
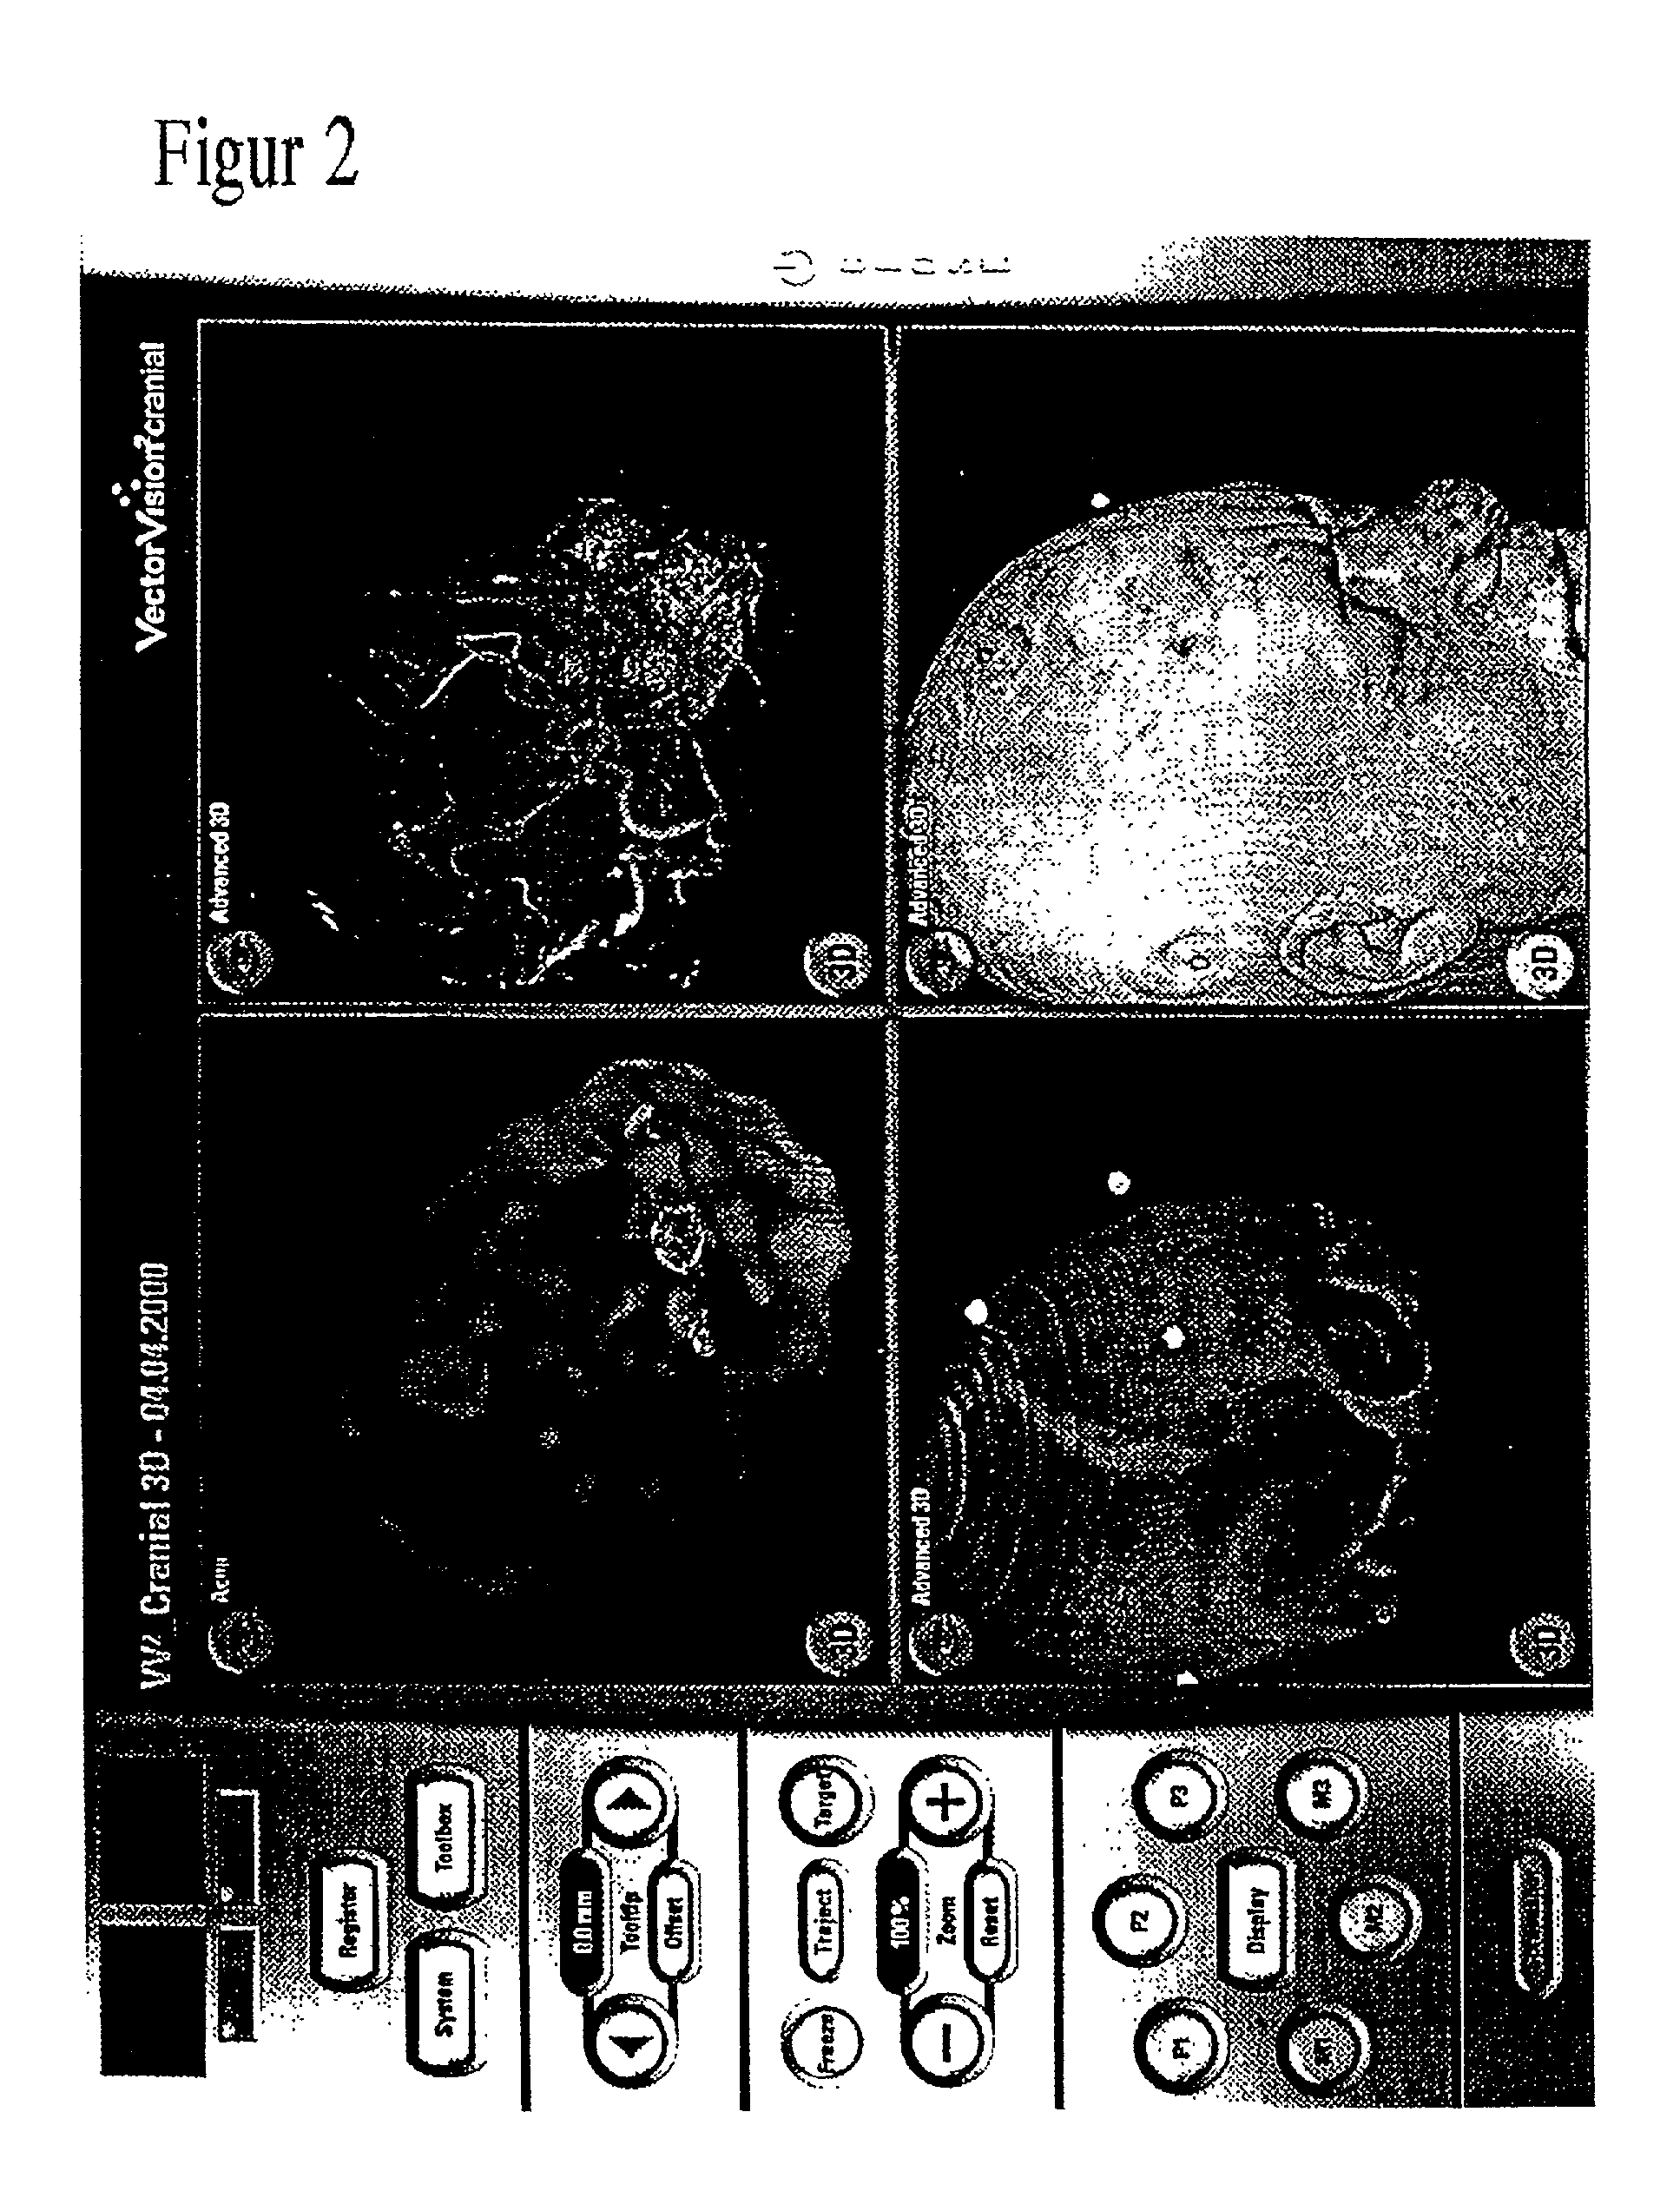
processing and visualizing the image is initially undertaken by means of preset parameters, and the parameters are changed as required, for example when specific details of the three-dimensional visualization need to be highlighted in particular. For this purpose the parameters may be changed manually. The operator is able to recognize the imaging result by way of the display, and to change the parameters until the image display is expedient. In this arrangement, the imaging result may be visualized three-dimensionally, whereby the three-dimensional visualization can also preferably be rotated in three-dimensional space, or displayed as a predefined two-dimensional slice image through the body volume, wherein the location of the slice through the body volume may preferably be given, e.g. by the operator. In this way, the operator is able to directly affect visualization and optimize the parameters, in order to achieve optimal detail accuracy in visualization and optimal image information.

Problems solved by technology

Even exchanging image information fails to increase the accuracy and information content of the diagnosis substantially.

Method used


Image

  • Method and system for visualizing a body volume and computer program product
  • Method and system for visualizing a body volume and computer program product
  • Method and system for visualizing a body volume and computer program product

Examples


Embodiment Construction

.

[0043] FIG. 1 shows a schematic flow diagram explaining the method and system in accordance with the invention. The system 1 comprises an image composer 2, a display unit 6 for displaying two-dimensional slice images or sectional views, as well as a display unit 7 displaying data sets three-dimensionally. The display units 6 and 7 may form a common display unit.

[0044] A number of different diagnostic data sets, captured by various methods of diagnosis, may be inputted into the image composer 2. As shown in FIG. 2, data sets may be captured using a CT method (computer tomography), a CT angiograph method, a magnetic resonance method (MR), an MR angiograph method, a positron emission tomography method (PET), a functional MRI method (fMRI), an x-ray rotational angiograph method, a 3D ultrasound method, MEG (magnetic encephalography), or any other imaging method of medical diagnosis. The different data sets 8 inputted into the image composer 2 may, however, also be derived from one and ...


PUM


Abstract

The invention relates to a method for two- or three-dimensionally visualizing a body volume, wherein a data set whose data values represent said body volume is displayed two- or three-dimensionally on a display, in which method a synthesized data set is computed from at least two selected diagnostic data sets which are not identical and have a predefined spatial allocation or relationship with respect to each other, wherein each of the data values of said synthesized data set is computed as a mathematical function of at least one data value of each selected data set, and said synthesized data set is displayed on the display unit. The two- or three-dimensional visualization of said synthesized data set may comprise more various items of image information than a selected data set and may thus be more informative and more accurate in detail. The invention also relates to a computer program product, and to a system for implementing said method.

Description

[0001] 1. Field of the Invention[0002] The present invention relates to a method and a system for visualizing a body volume, in particular two- or three-dimensionally, and in particular a body volume of a human being or animal, as well as to a computer program product comprising software code portions for implementing the method in accordance with the invention.[0003] In medical diagnostics, therapy and surgery, precise two- or three-dimensional representations of body volumes are necessary. To capture data representing the body volumes, diverse non-invasive methods of diagnosis, for example computer tomography (CT) and magnetic resonance imaging (MRI), are available. The captured data are usually digitized and subjected to image processing on a computer to visualize them. The processed image data can then be displayed two- or three-dimensionally on a monitor screen, where the image may also be rotated in three-dimensional space.[0004] Each of the known methods of diagnosis is tailo...

Claims


Application Information

Patent Timeline
Patent Type & Authority Applications(United States)
IPC IPC(8): A61B5/055A61B6/03G06T15/08
CPCA61B5/055A61B6/03G06T15/08G06T2200/24A61B6/5247
Inventor BAUCH, THOMASFRIELINGHAUS, NILS
Owner BRAINLAB
Why Eureka
Try Eureka