
Digital phosphor spectrum analyzer

a digital phosphor spectrum and analyzer technology, applied in the field ofspectrum analysis, can solve the problem of not being able to see otherwise unobservable frequency characteristics of input signals, and achieve the effect of improving the ratio of waveform acquisition to non-acquisition tim

Inactive Publication Date: 2005-03-17
GEE EDWARD C +4
View PDF13 Cites 24 Cited by
  • Summary
  • Abstract
  • Description
  • Claims
  • Application Information

AI Technical Summary

Benefits of technology

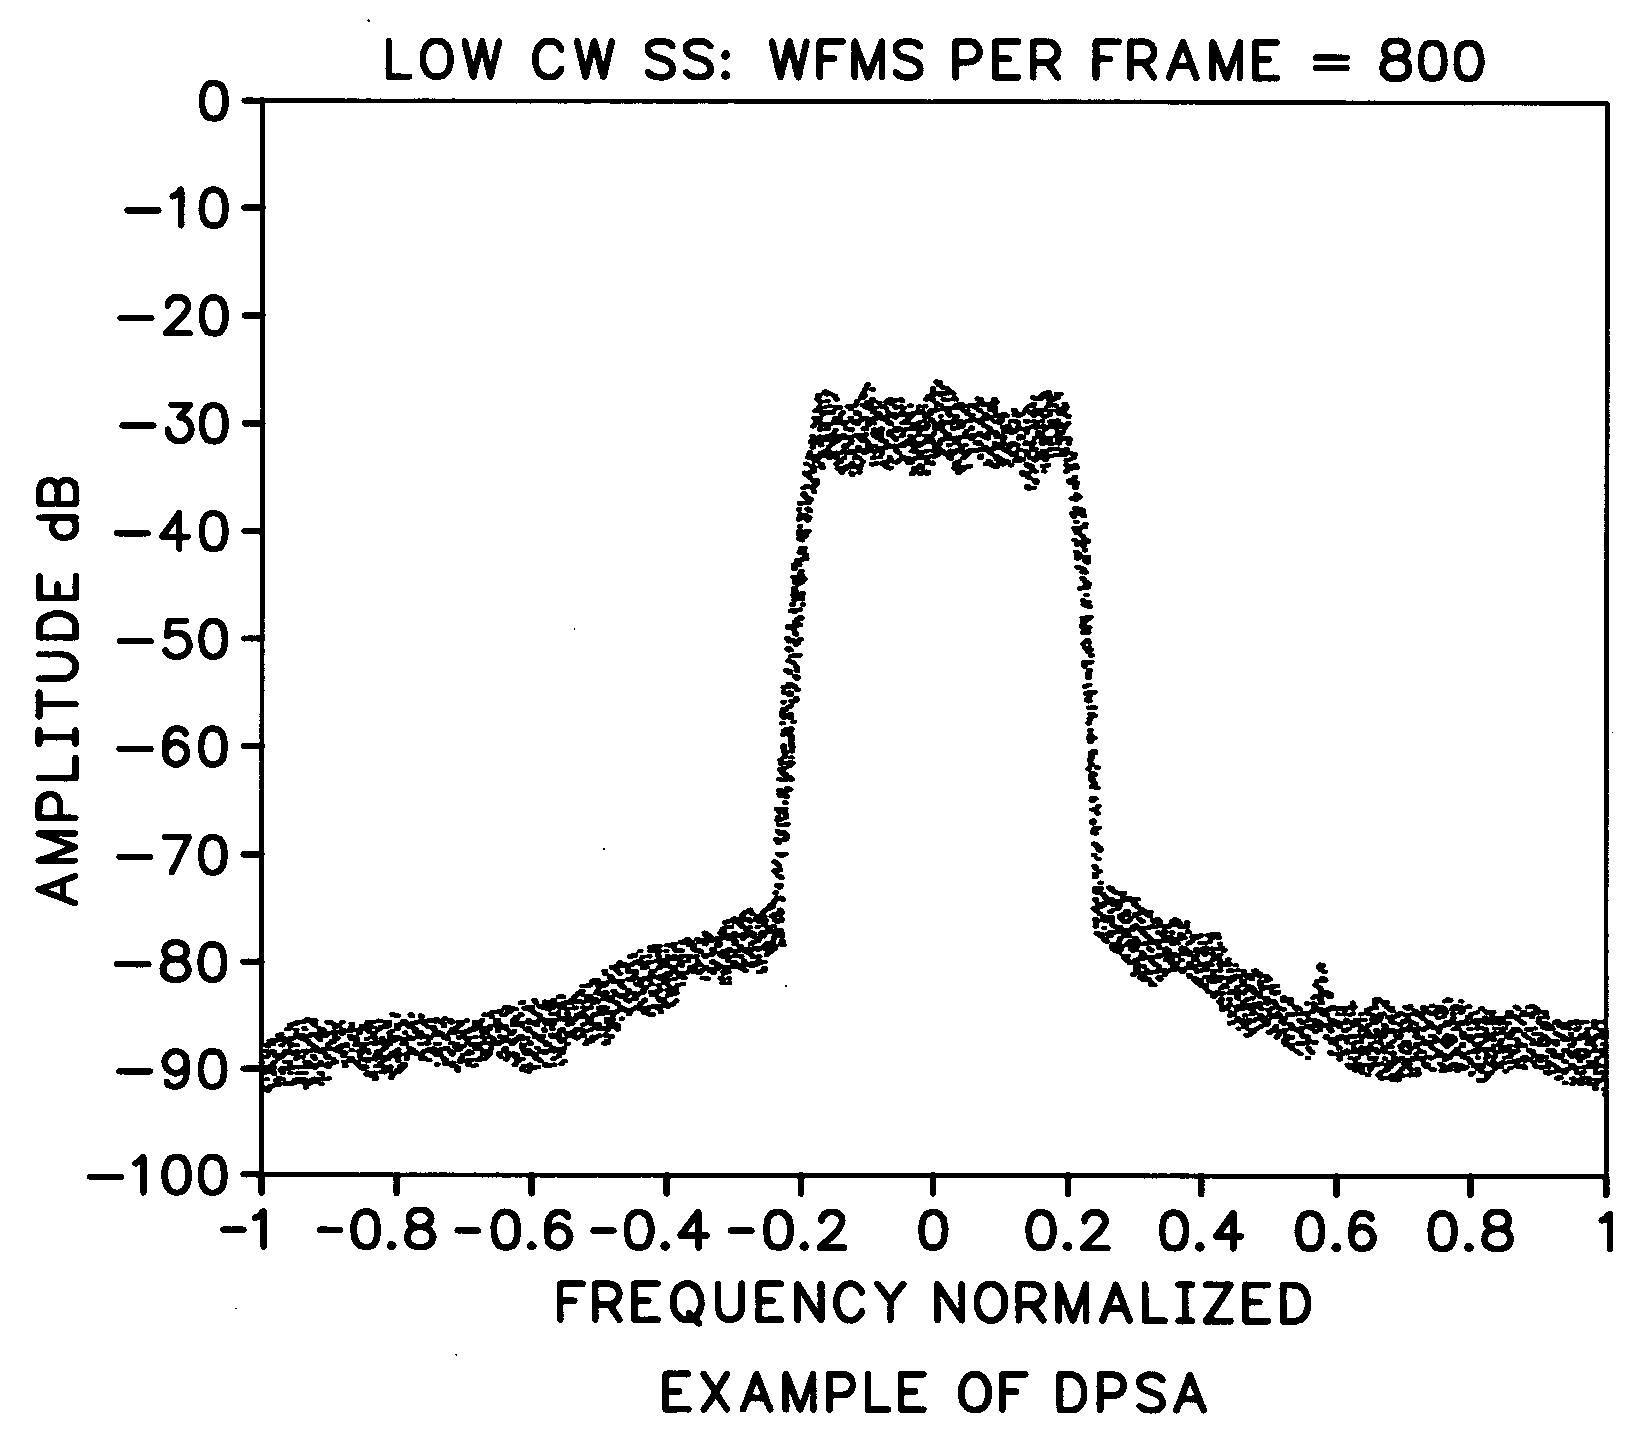
[0006] Accordingly the present invention provides a digital phosphor spectrum analyzer that uses fast rasterization and decay processing to emulate the look and feel of an analog phosphor display while improving the ratio of waveform acquisition to non-acquisition time. Multiple acquisitions of complex digital data for an input signal being analyzed across a frequency span are accumulated in a raster memory at a waveform update rate to produce a composite waveform or “frame.” A decay function is applied to the composite waveform to produce a display waveform. The display waveform is viewed on a display device at a frame or display update rate, resulting in the ability to see otherwise unobservable frequency characteristics of the input signal.

Problems solved by technology

The display waveform is viewed on a display device at a frame or display update rate, resulting in the ability to see otherwise unobservable frequency characteristics of the input signal.

Method used


Image

  • Digital phosphor spectrum analyzer
  • Digital phosphor spectrum analyzer
  • Digital phosphor spectrum analyzer

Examples


Embodiment Construction

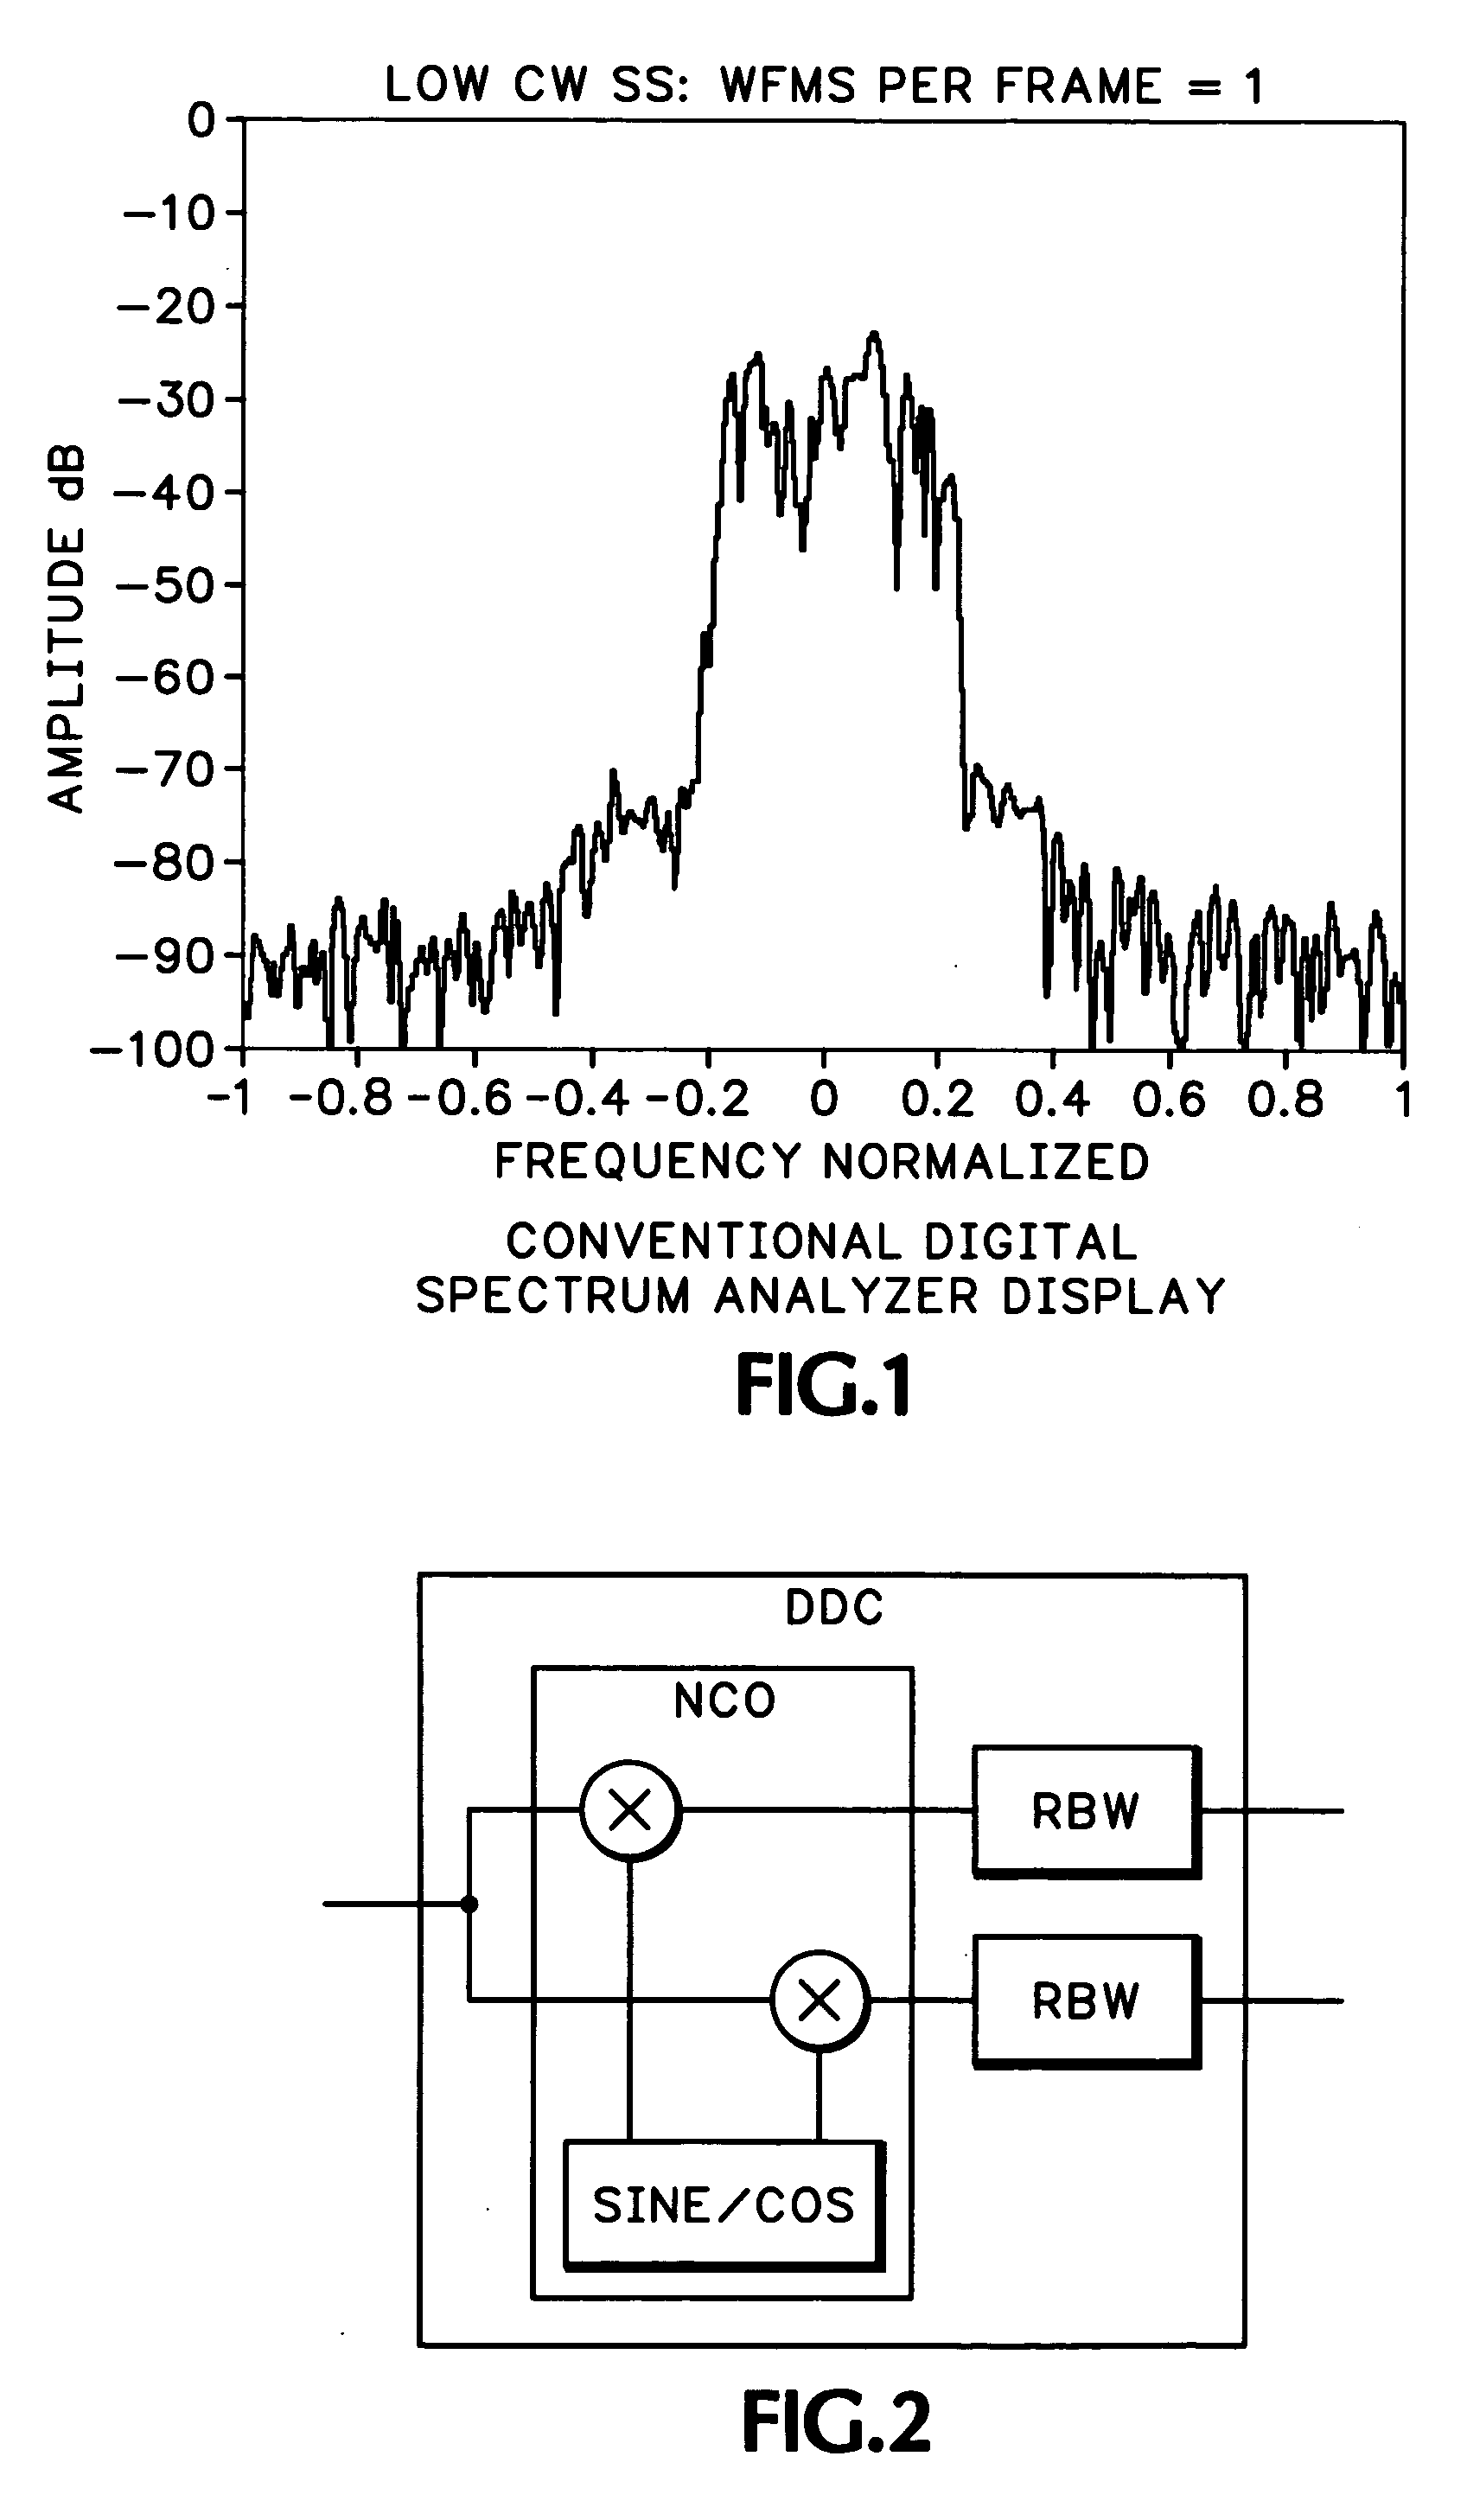
[0016] A digital phosphor spectrum analyzer (DPSA) may be implemented in one of two forms—a parallel configuration using a “bank of filters” in the form of a fast discrete Fourier transform (DFT) or a swept configuration that is functionally similar to a traditional swept spectrum analyzer. In the parallel configuration channel characteristics are determined by a “window” applied to the digitized data prior to the DFT, the window being equivalent to a resolution bandwidth (RBW) filter. The acquisition time is determined by window length and sample rate. In the swept configuration the RBW filter may be implemented as a pair of finite impulse response (FIR) filters following a numerically controlled oscillator (NCO) in a digital down-converter (DDC), as shown in FIG. 2.

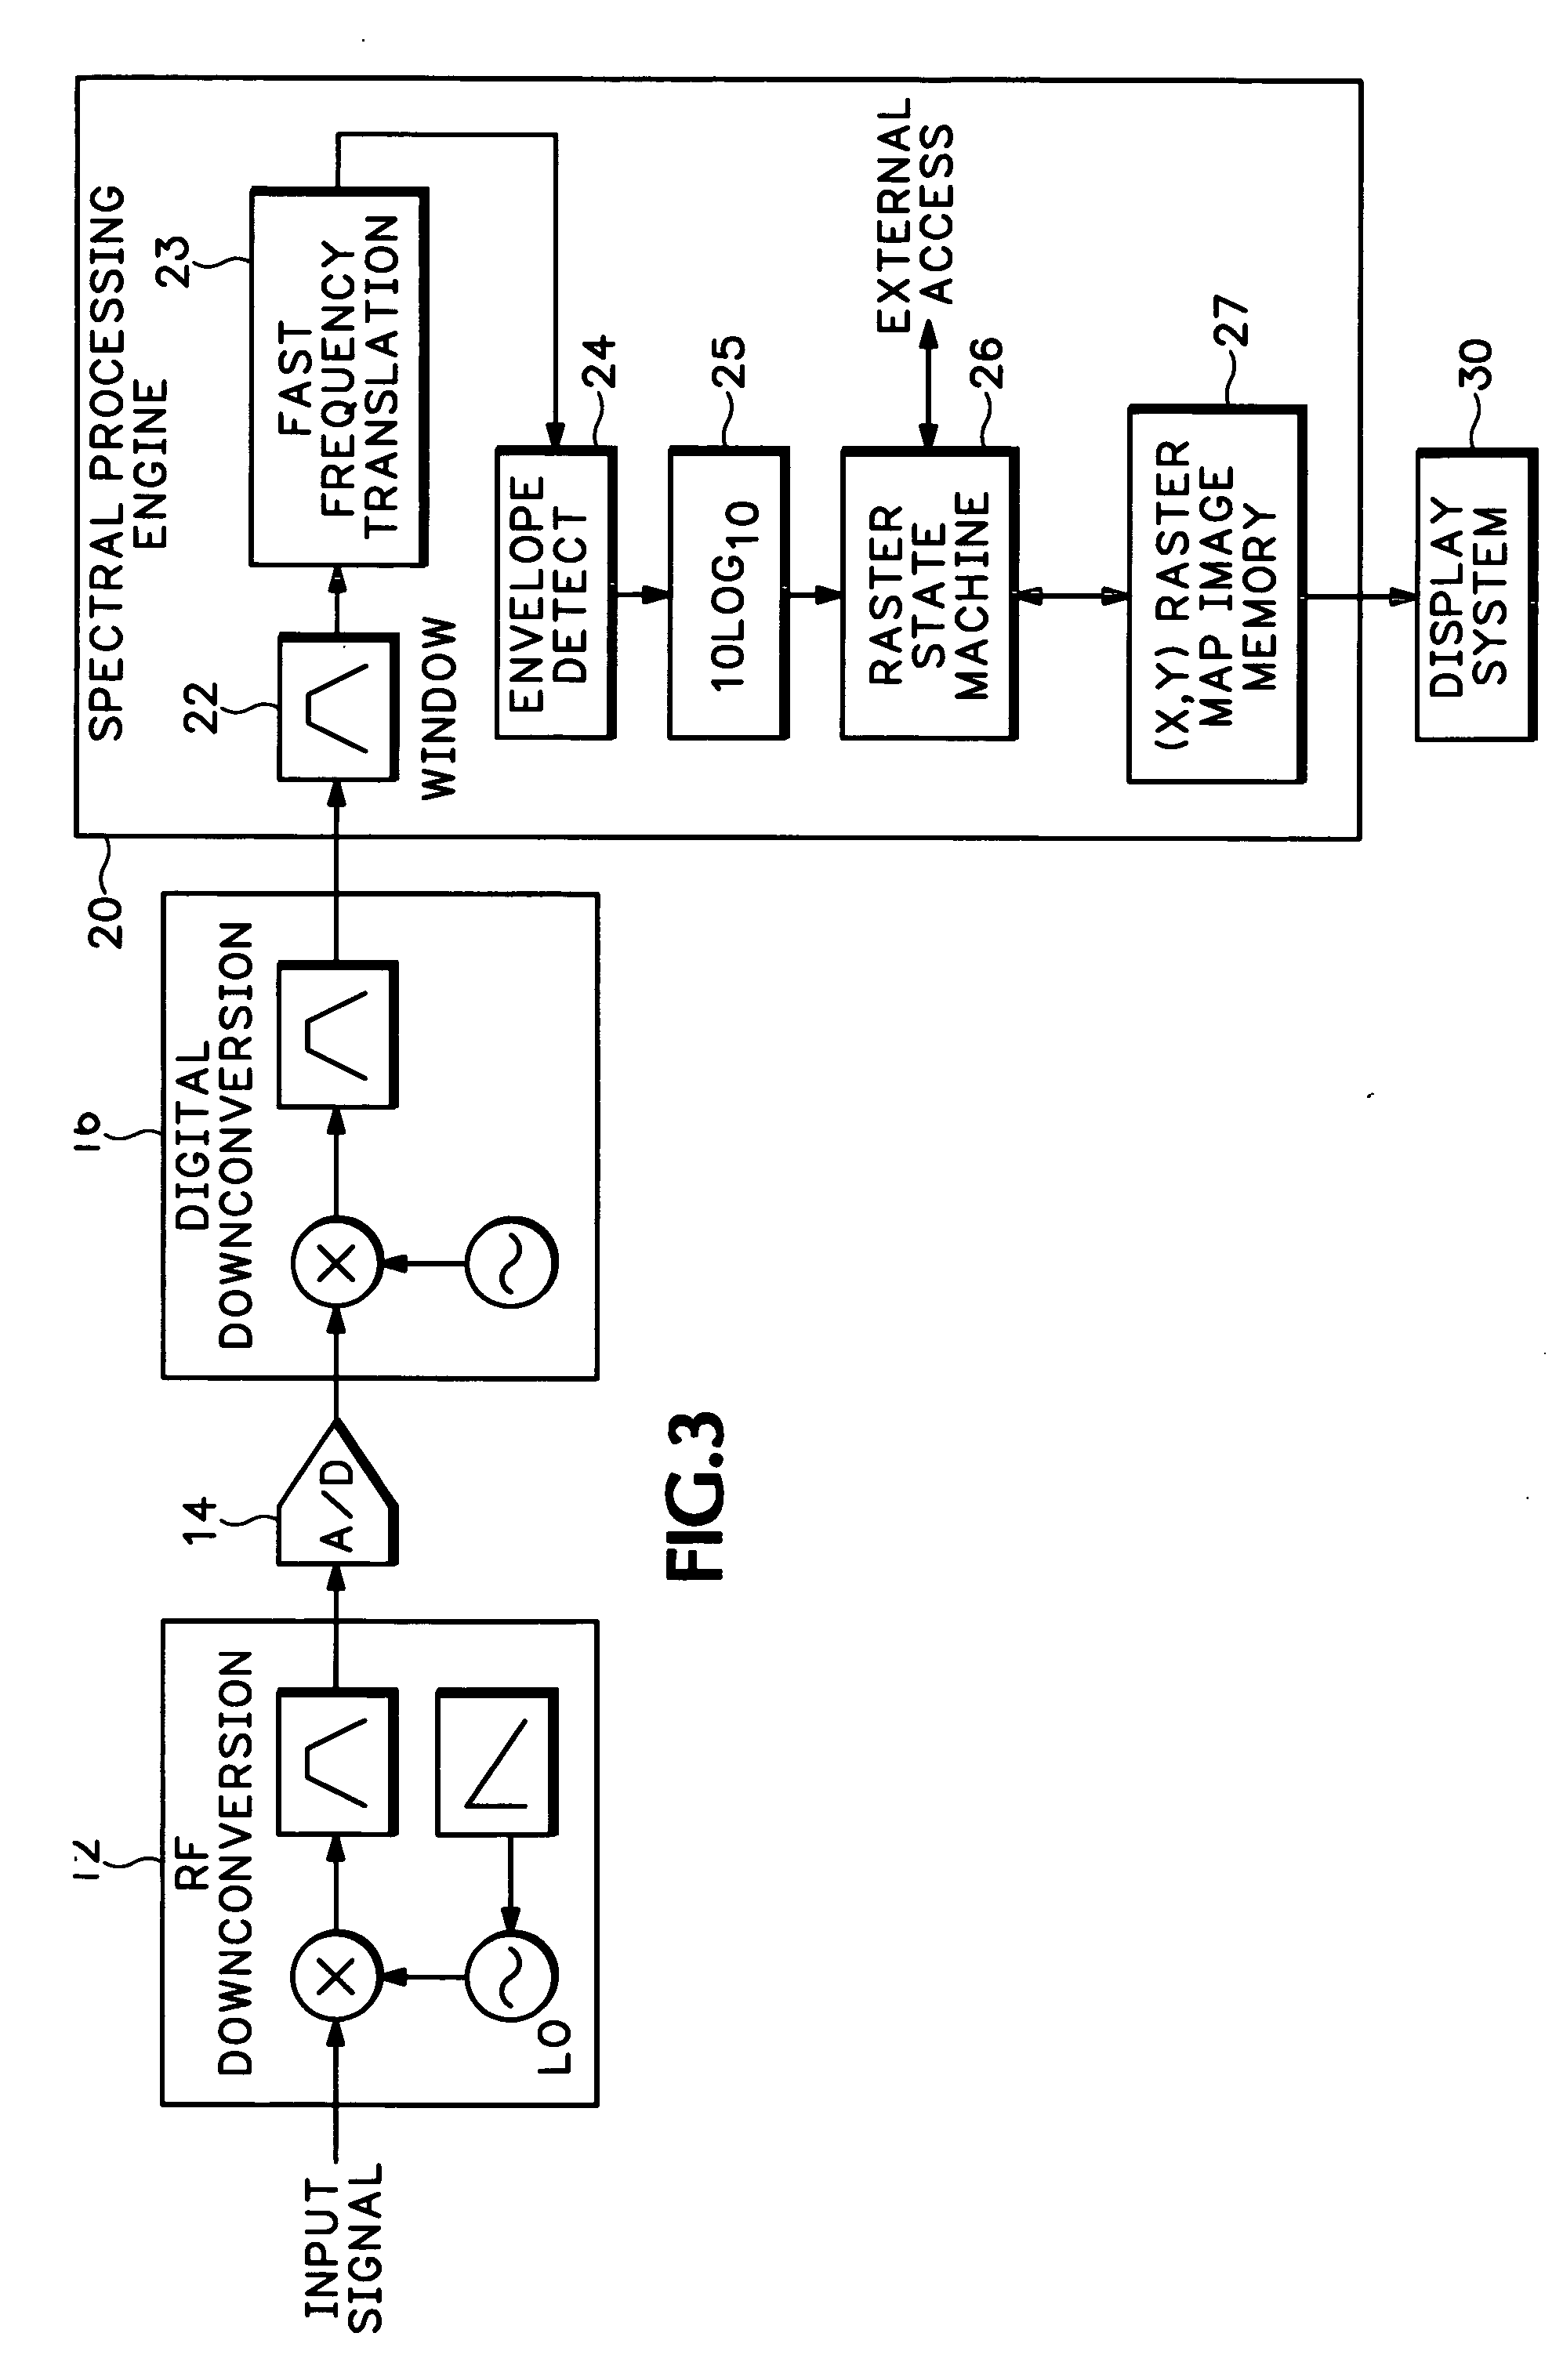
[0017] Referring now to FIG. 3 a digital phosphor spectrum analyzer (DPSA) is shown having a conventional RF down-converter 12 followed by an analog-to-digital (A / D) converter 14 and a conventional digital down-convert...


PUM


Abstract

A digital phosphor spectrum analyzer (DPSA) uses a fast rasterization and decay process to emulate the look and feel of an analog phosphor display while improving the ratio of waveform acquisition to non-acquisition time. Multiple acquisitions of complex digital data for an input signal being analyzed across a frequency span are accumulated in a raster memory at a waveform update rate to produce a composite waveform. A decay function is applied to the composite waveform to produce a display waveform. The display waveform is viewed on a display device at a display update rate, resulting in the ability to see otherwise unobservable frequency characteristics of the input signal.

Description

BACKGROUND OF THE INVENTION [0001] The present invention relates to spectrum analysis, and more particularly to a digital phosphor spectrum analyzer (DPSA) using fast rasterization and decay processing to emulate the look and feel of an analog phosphor display. [0002] In a typical digital spectrum analyzer a signal being monitored is actually sampled during a very small percentage of time when presenting data to a user. For example a swept-frequency digital spectrum analyzer only observes signal content within a frequency range of a resolution bandwidth (RBW) filter at any given instant. For a digital spectrum analyzer with a sweep rate of 15 msec spanning 5 MHz in frequency with an RBW of 30 kHz and a waveform update rate of 30 waveforms per second, a specific frequency may be observed for less than 90 μsec [(0.015×3×104) / 5×10⁶] per sweep, or about 2.7 msec (9×10−5×30) in a one-second period, where each waveform represents a complete frequency span. Also a digital spectrum analyzer...

Claims


Application Information

Patent Timeline
IPC IPC(8): G01R13/02G01R23/16
CPCG01R13/02G01R23/18G01R23/16
Inventor GEE, EDWARD C.HILLMAN, ALFRED K.FOLLETTT, STEPHEN D.CAMERON, RICHARD A.SIVULA, ANTTI
Owner GEE EDWARD C
Learn More