

Phase determination of a radiation wave field
- Summary
- Abstract
- Description
- Claims
- Application Information
AI Technical Summary
Benefits of technology
Problems solved by technology
Method used
Image

Examples
example 2
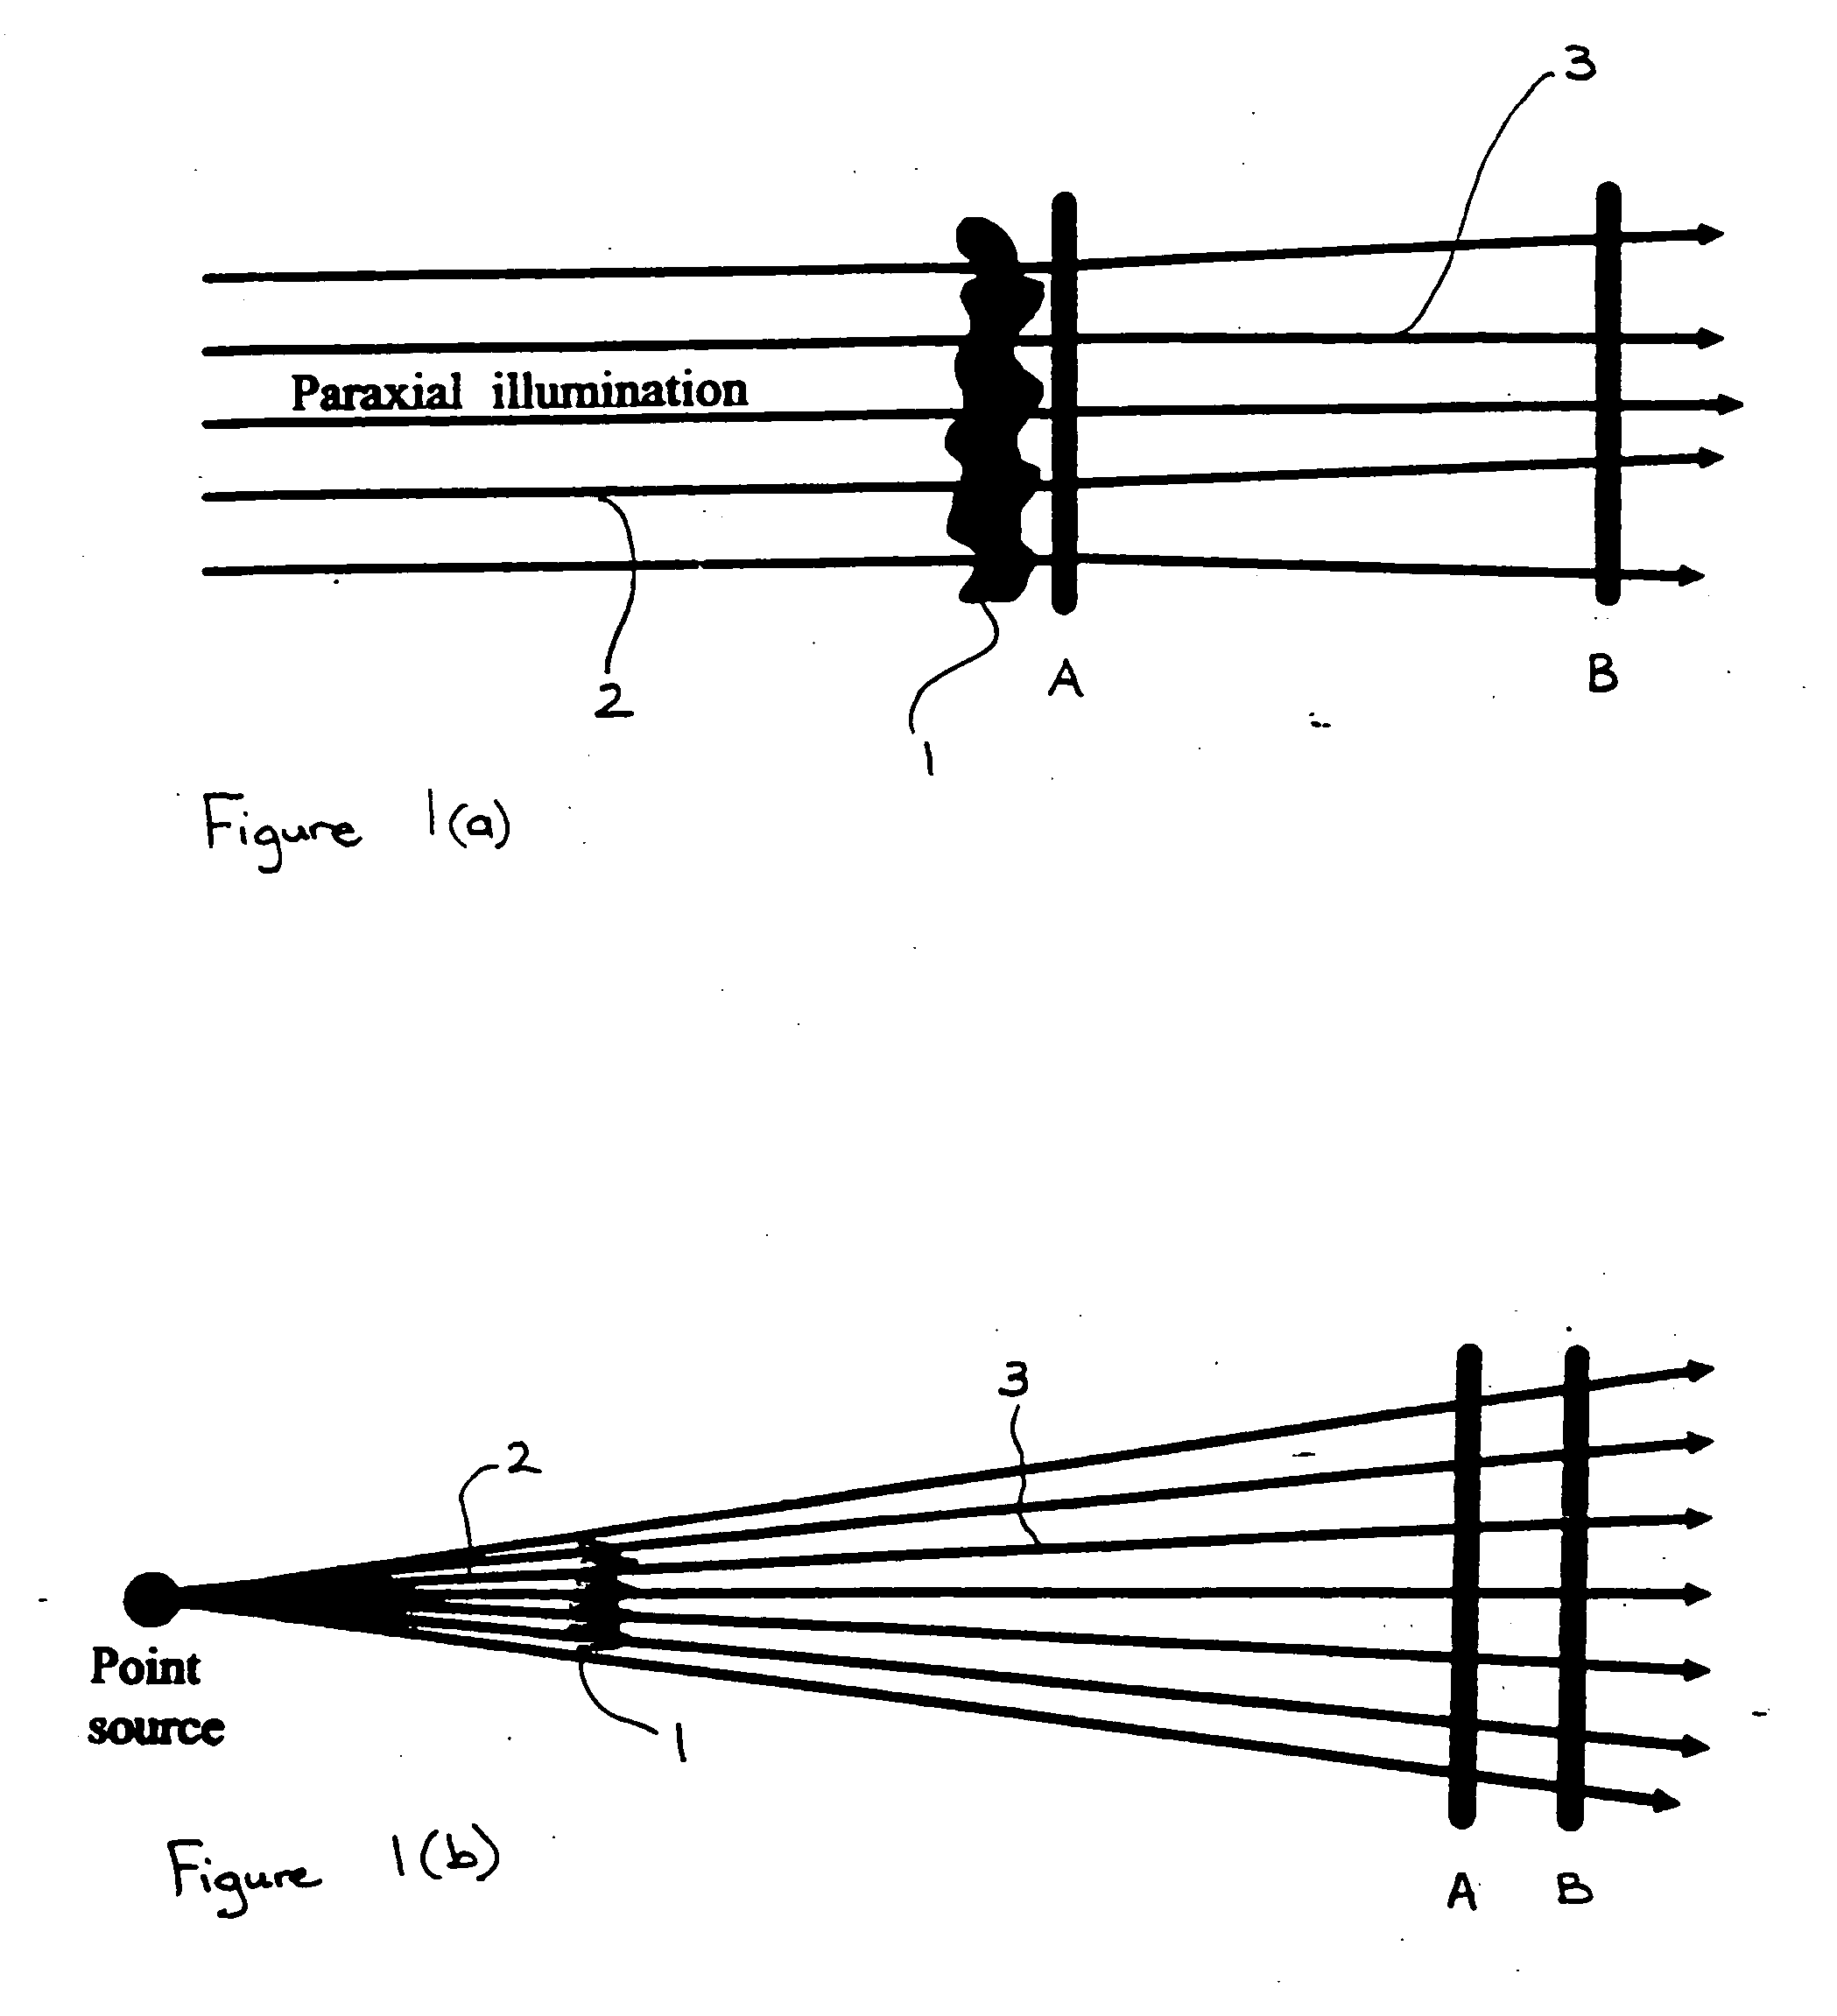
As shown in FIG. 5, radiation such as X-rays, visible light or electrons from a point source 10 is allowed to propagate through free space to the object 11, located at a distance dso from the source. The radiation passes through the object 11, and is allowed to propagate a further distance dod to one of the image planes I1, I2 . . . In in which the intensity of the radiation is detected. This detection is performed using a standard device such as a CCD camera, image plate or other device capable of registering and digitising the intensity distribution. One or both of the distances dso and / or dsd is then changed so as to introduce defocus into the images and the intensity distribution is measured once again. The case of dod=0 corresponding to contact-imaging with zero propagation distance is included as one possible measurement.
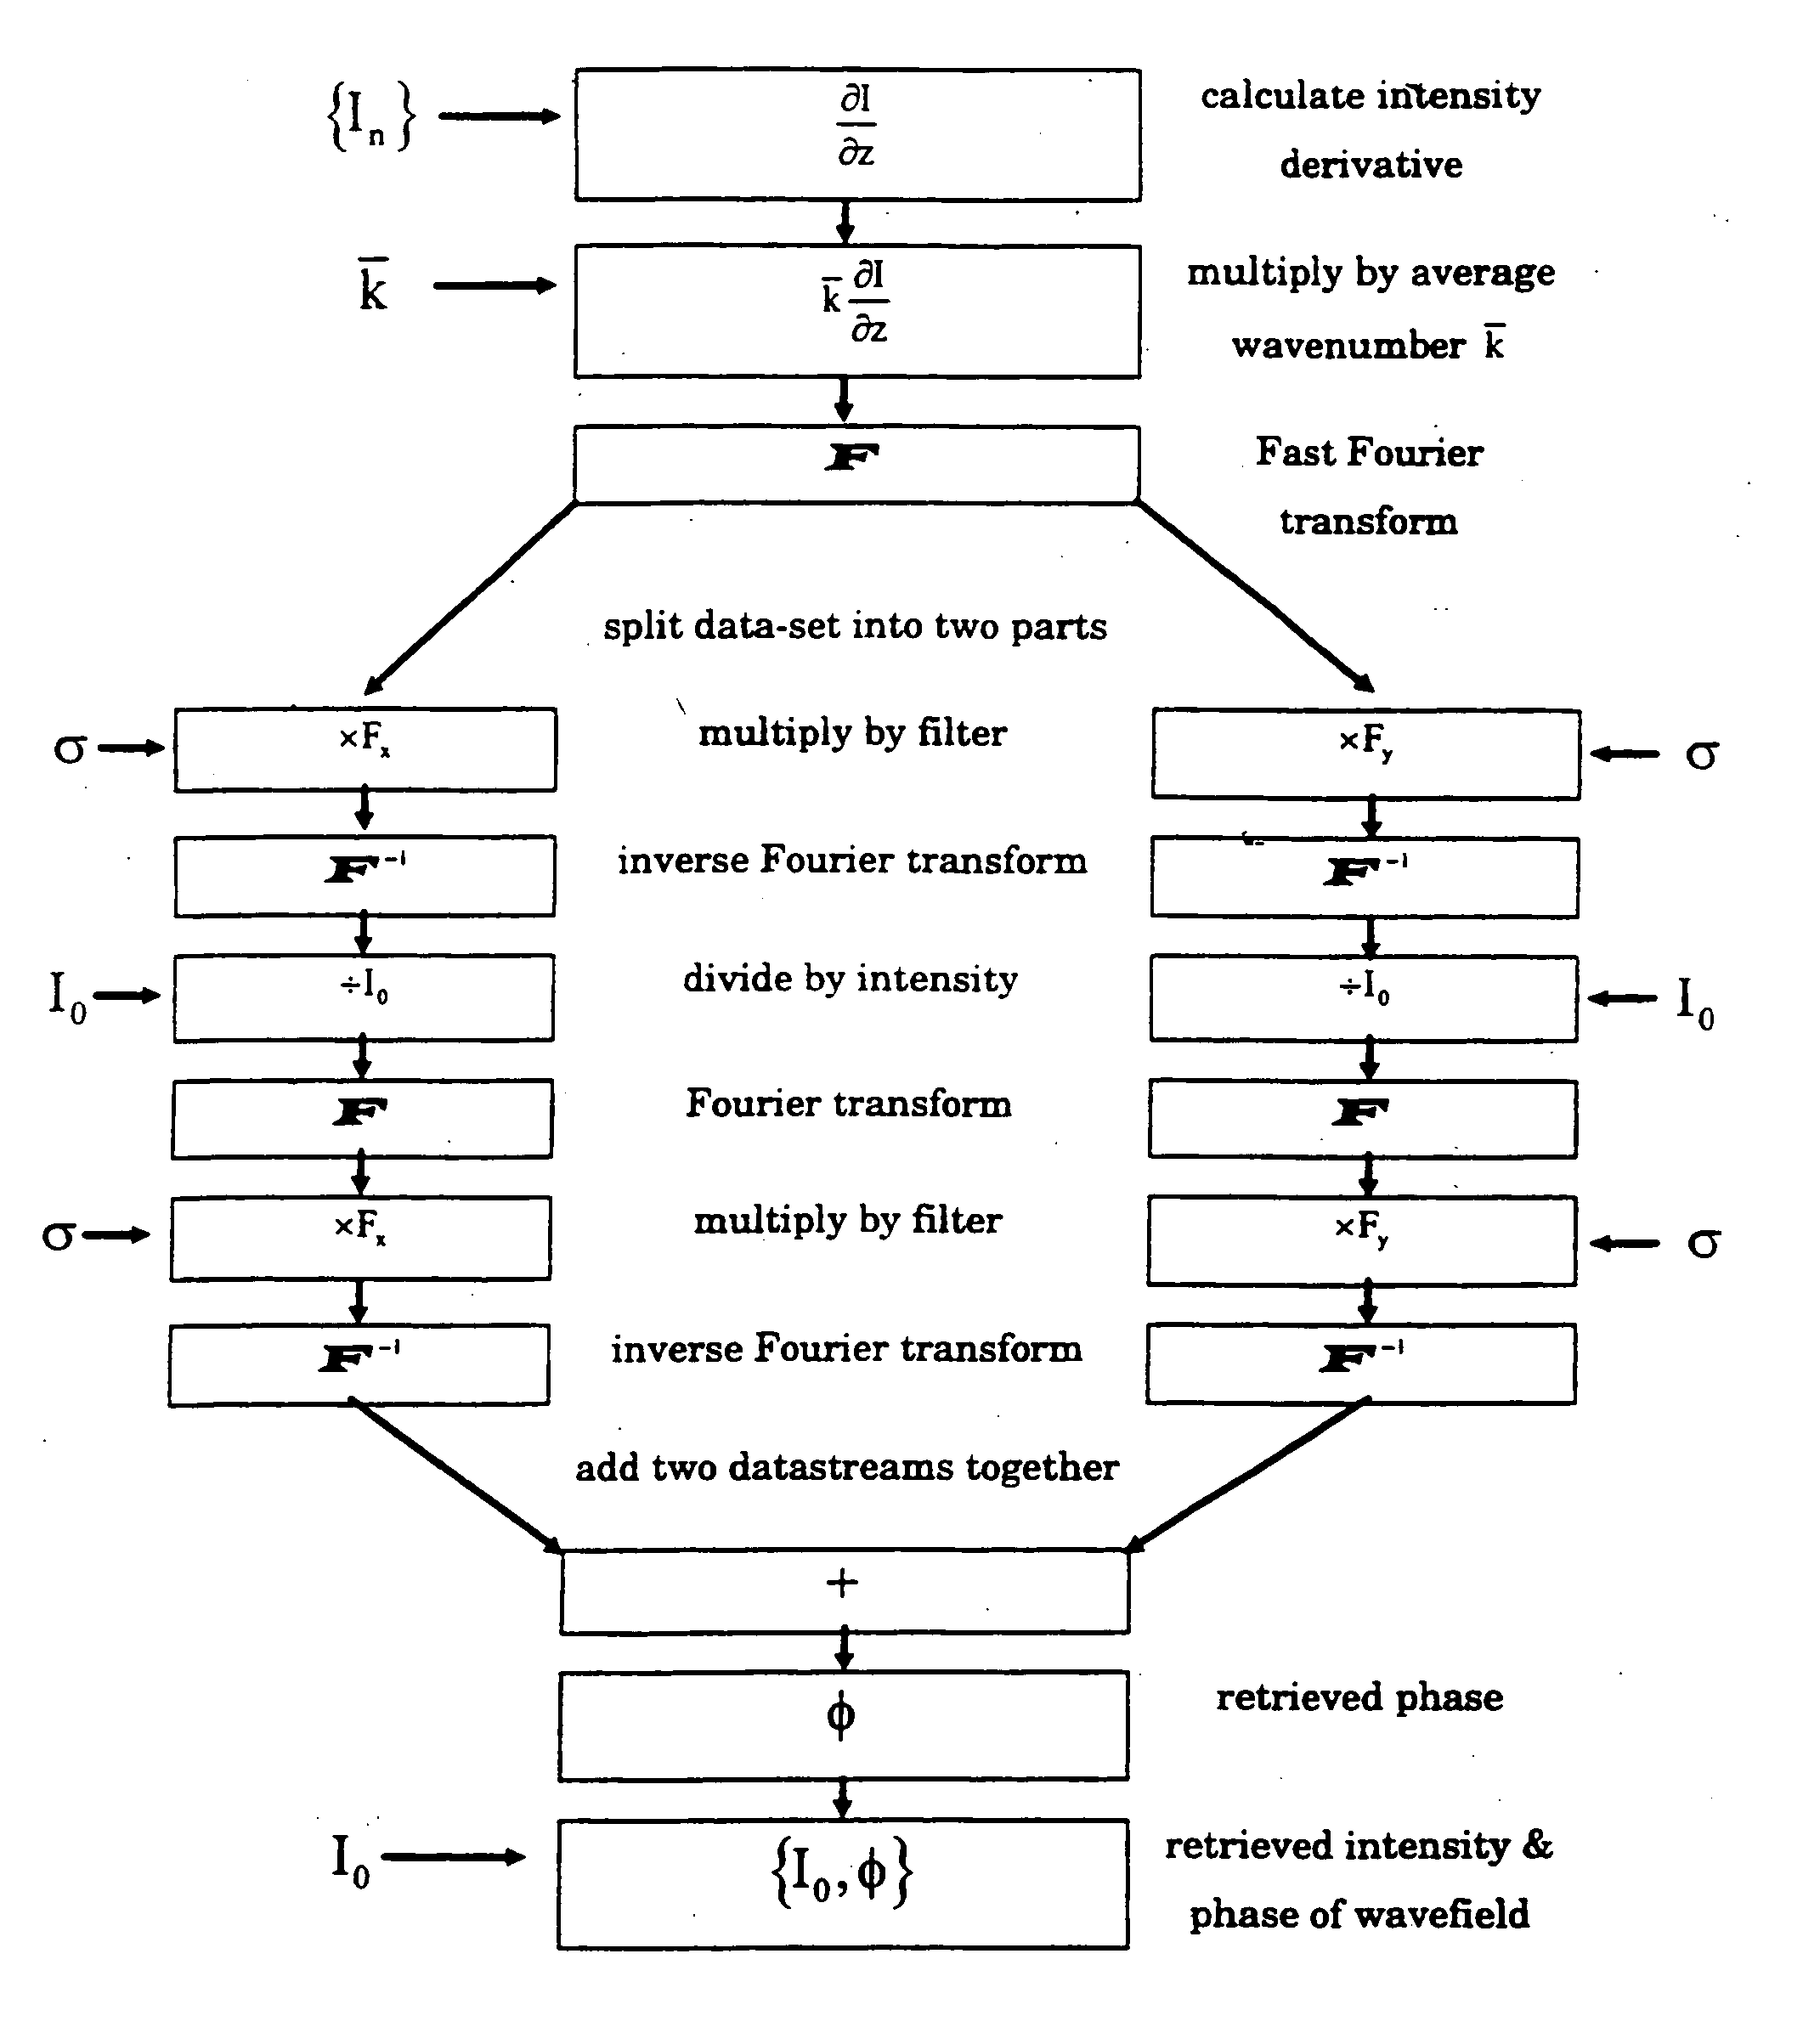
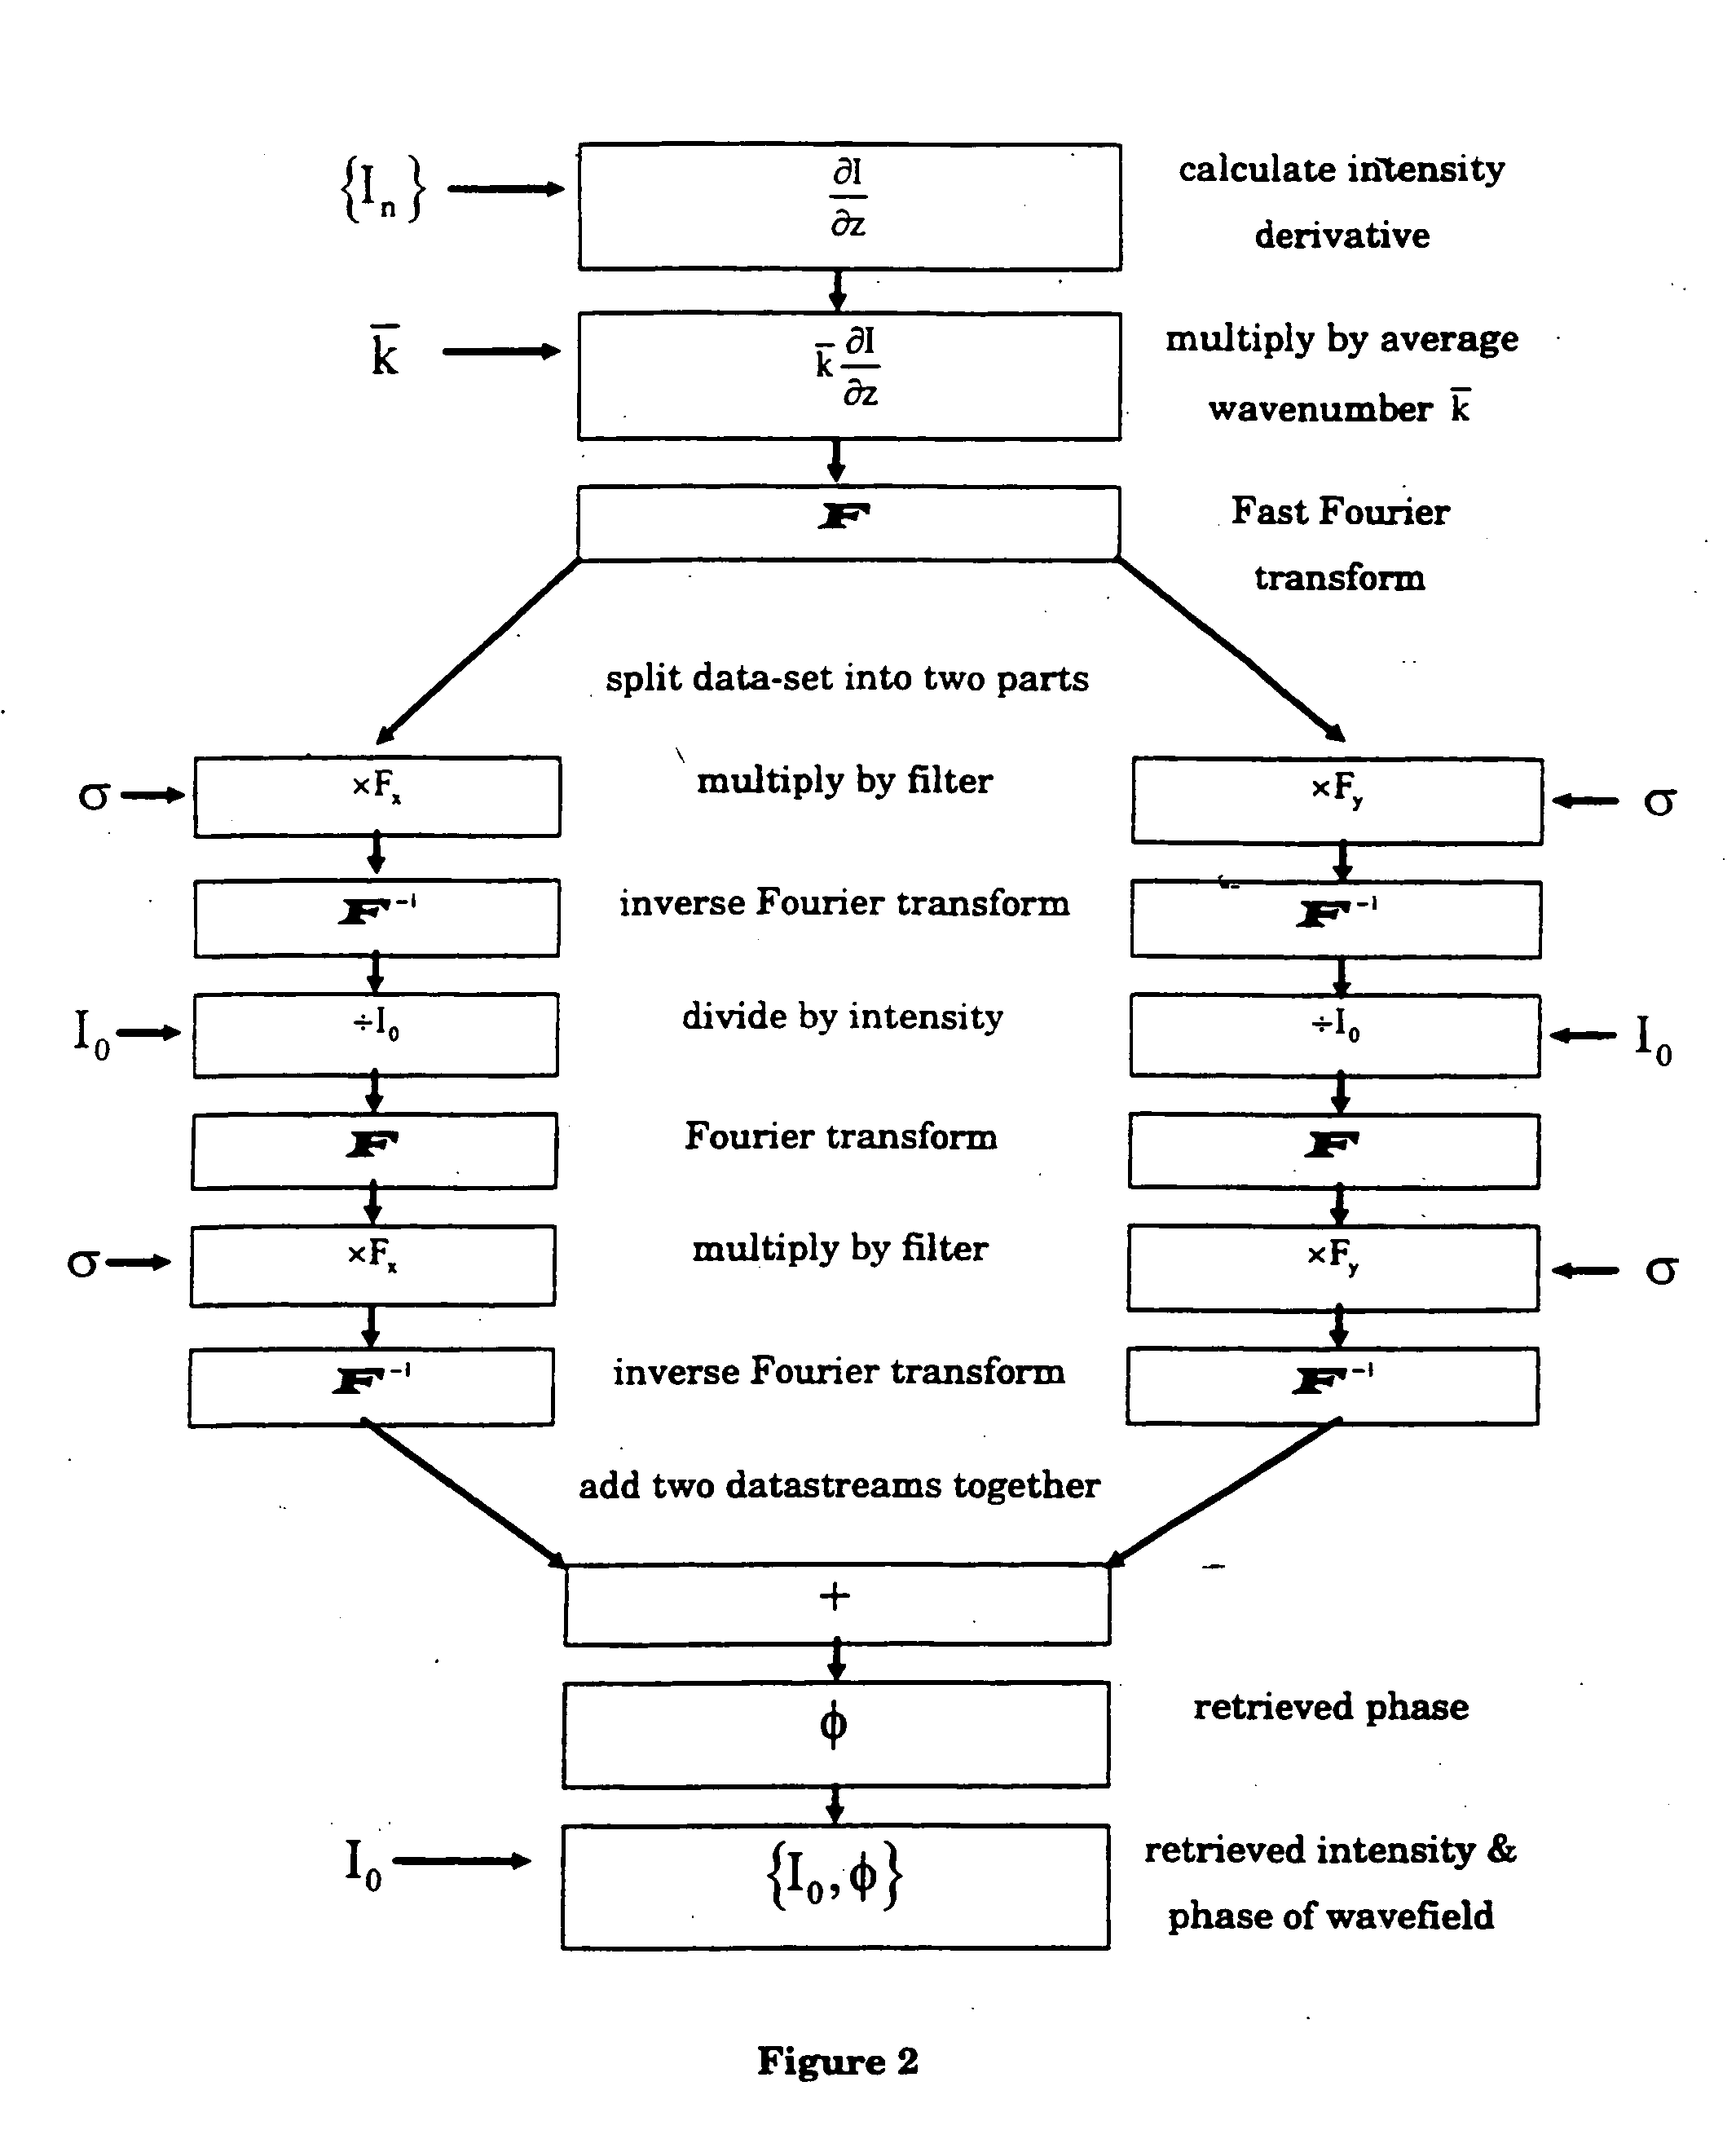
The intensity data is then processed using the above phase recovery method, to recover the decoupled intensity and phase inform...
example 3
Quantitative Chase Amplitude Microscopy
FIG. 6 schematically shows an arrangement for quantitative phase amplitude microscopy. A sample is illuminated using a source of white light Köhler illumination 15, commonly found on optical microscopes. The light is transmitted through an object 16 and collected by a microscope imaging system 17 and relayed to a CCD camera 18 or other digital imaging device having a planar imaging surface. Three images are collected: an in-focus image, I0, and two slightly out of focus images I+ and I−. The defocus is obtained by suitable means such as a drive system 19 to adjust the microscope focus knob. The defocus introduced is usually quite small so that degradation in spatial resolution is minimised, although the optimal amount of defocus to use is determined by sample properties and imaging geometry such as magnification, numerical apertures, etc.
When taking the images the numerical aperture of the condenser is chosen to be less than the numerical ap...
example 4
Three-Dimensional Optical Phase Tomography
This example demonstrates the application of quantitative phase microscopy to the three-dimensional imaging of objects through the use of computed-tomography techniques. This is possible using the techniques of this invention because the phase shifts introduced by the object can be directly measured independently of any intensity variations in the object, thus an inverse Radon transform can be used to recover the three-dimensional structure directly from the projection data. Although the experimental demonstration provided is in the optical regime, the same principles are equally applicable to X-ray, electron and neutron phase tomography.
For the purposes of collecting three dimensional data sets the same optical microscope described in the previous example is used with the addition of a rotation stage 24 for the purposes of rotating the sample within the confines of the optical microscope imaging area as shown in FIG. 10. The rotation st...
PUM
 Abstract
Description
Claims
Application Information