Computer systems and methods for genotype to phenotype mapping using molecular network models

a computer system and network model technology, applied in the field of molecular network models, can solve the problems of inability to account for nonlinear gene to gene interaction in models, the challenge of bridging molecular biology as well as genomics or proteomics, and the nontrivial nature of the older sciences of biology, medicine, and genetics, etc., to determine the environmental effect of phenotypic development of a genotyp

Inactive Publication Date: 2005-04-21
PIONEER HI BRED INT INC
View PDF4 Cites 44 Cited by
  • Summary
  • Abstract
  • Description
  • Claims
  • Application Information

AI Technical Summary

Problems solved by technology

The challenge of bridging molecular biology—as well as genomics or proteomics—and the older sciences of biology, medicine, and genetics is however nontrivial.
There is a lack of systematic approaches for relating such molecular biology concepts to the macroscopic notion of phenotype, genotype, and environment upon which the science of genetics has been built.
Although linear statistical models allow geneticists to decipher—whether qualitatively or quantitatively—the genetic architecture of a large number of simple traits, those models cannot account for the nonlinear gene to gene interactions.
There is a general lack of success in modeling non-linear properties of gene interactions.
Introduction of non-linear terms in the studies of gene interactions and the resulting phenotypes leads to considerable theoretical difficulties that prevent closed-form expression of model properties.
However, none of the existing work has offered a systemic approach for tracking phenotypic changes from genotypic variations based on a molecular network model that approximates both qualitative state information and quantitative dynamics features of a biological process or a biological system.

Method used


Image

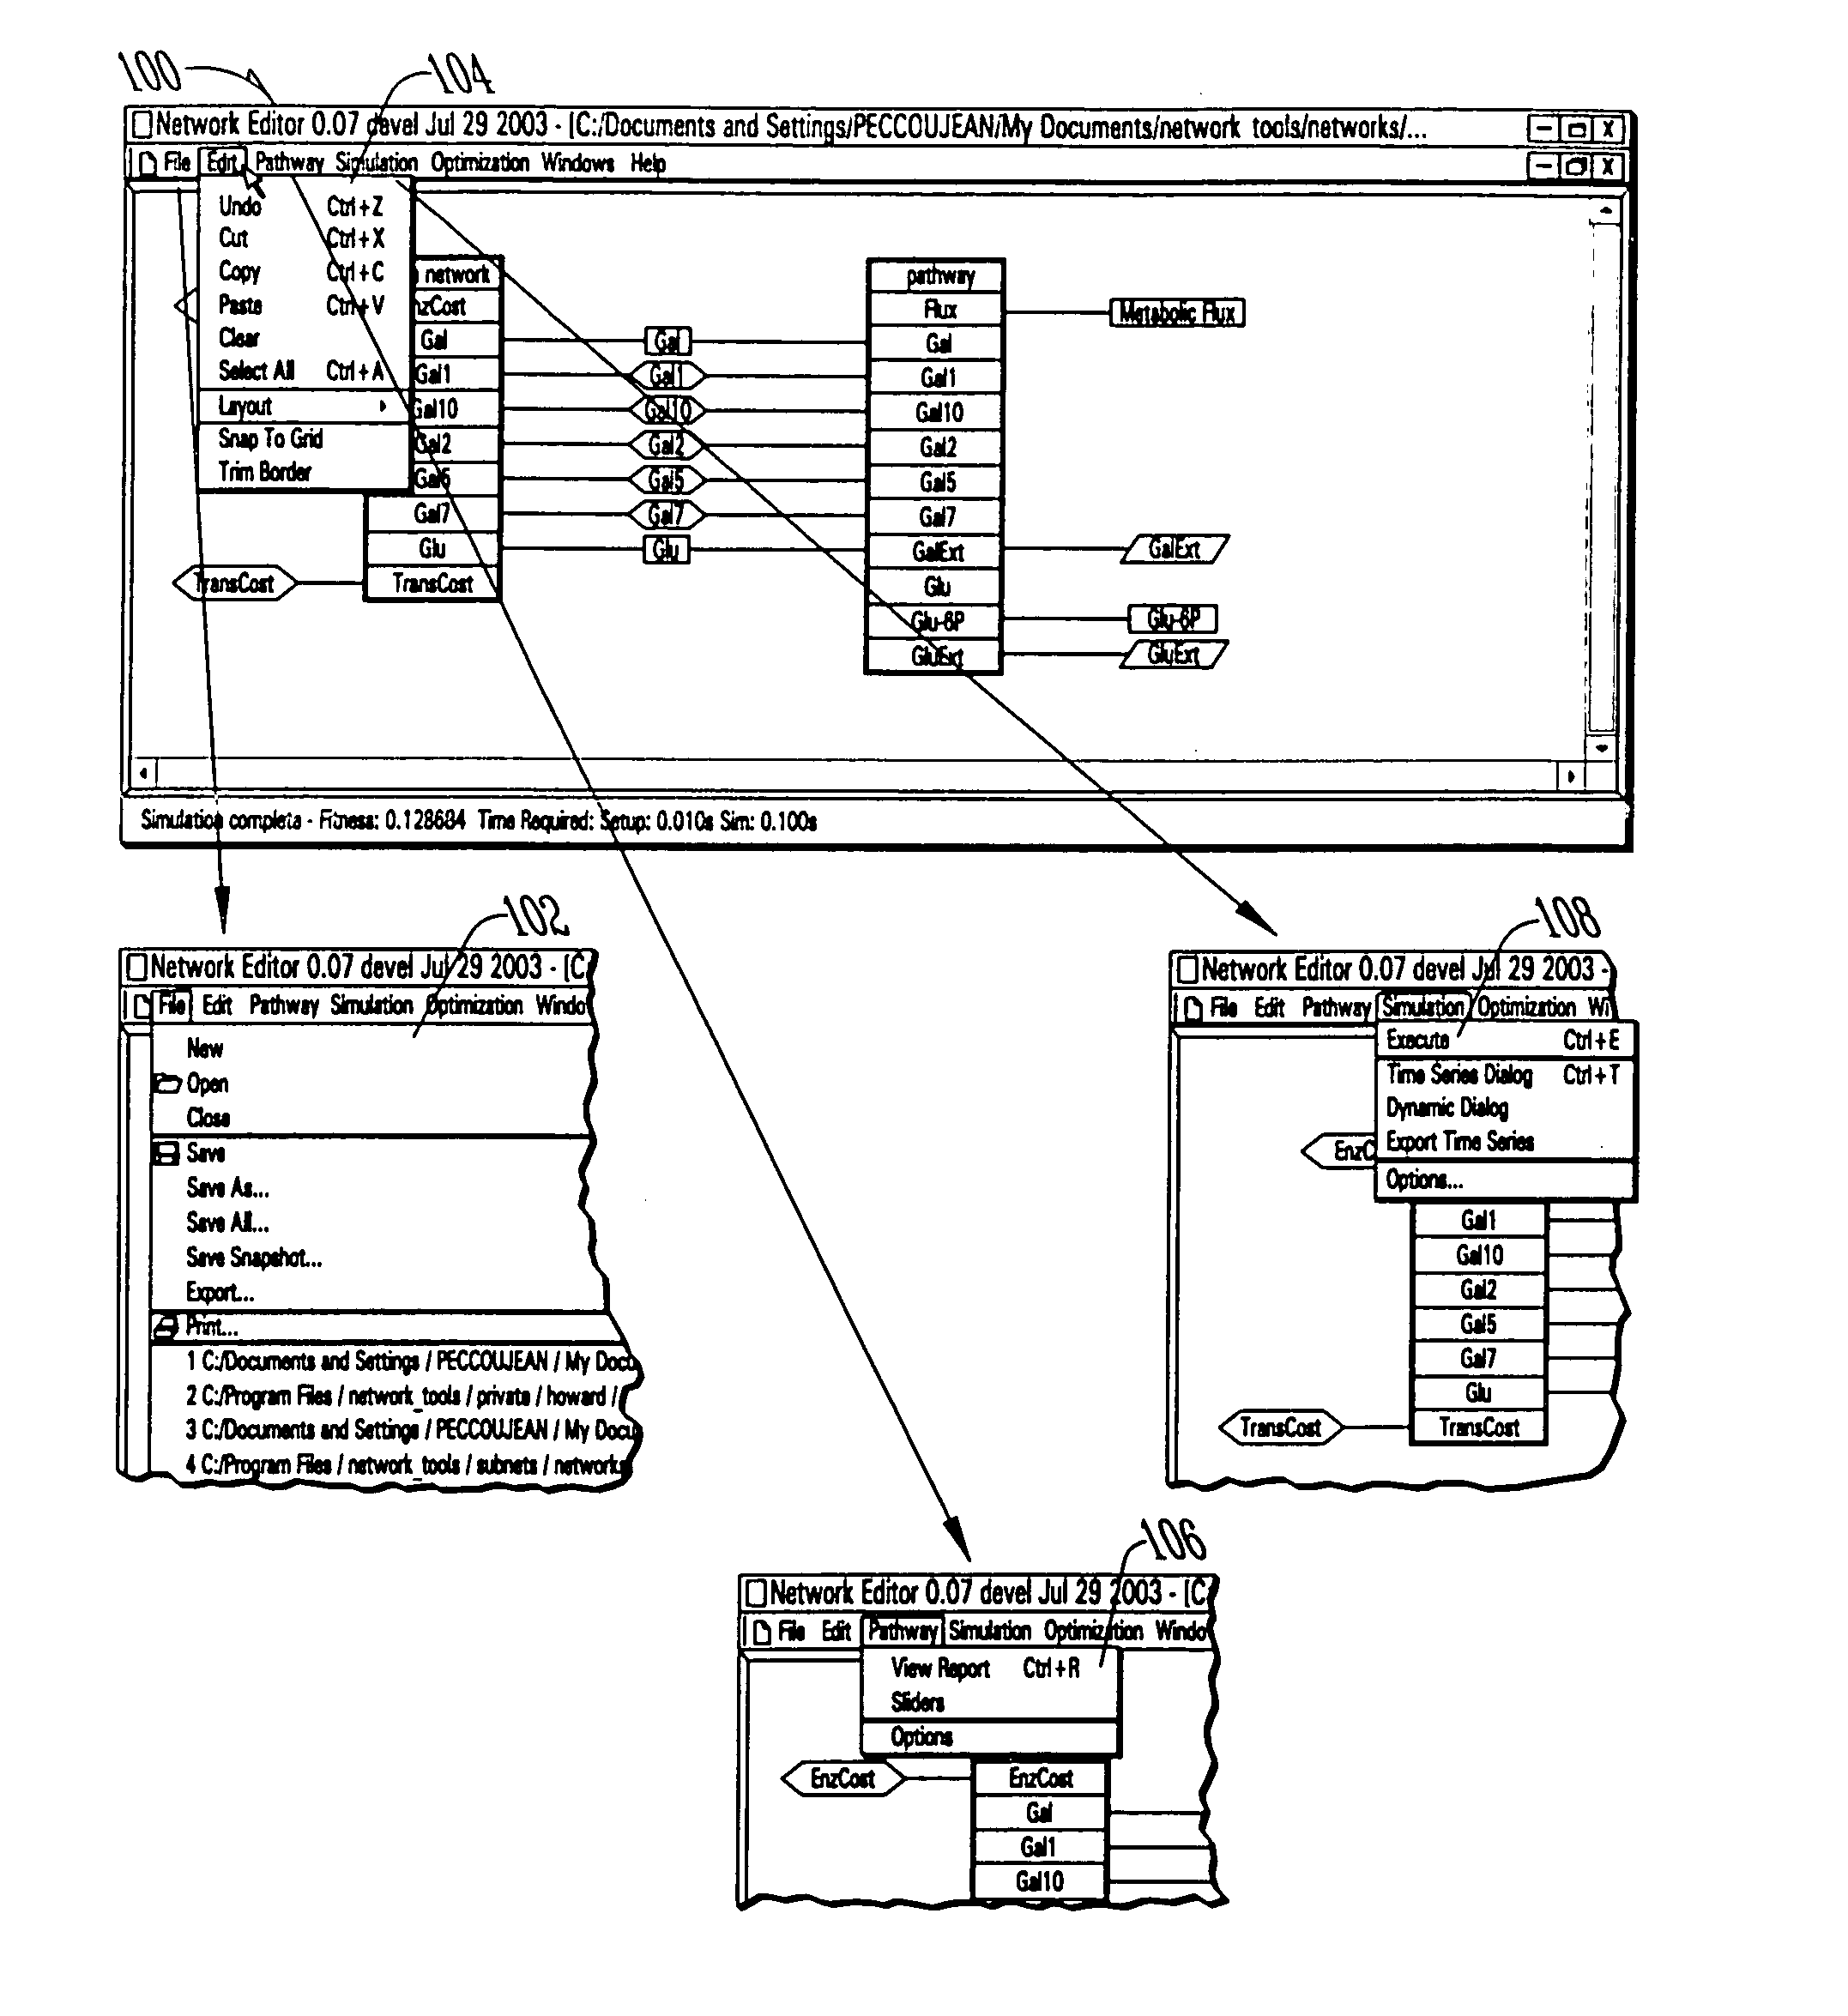
  • Computer systems and methods for genotype to phenotype mapping using molecular network models
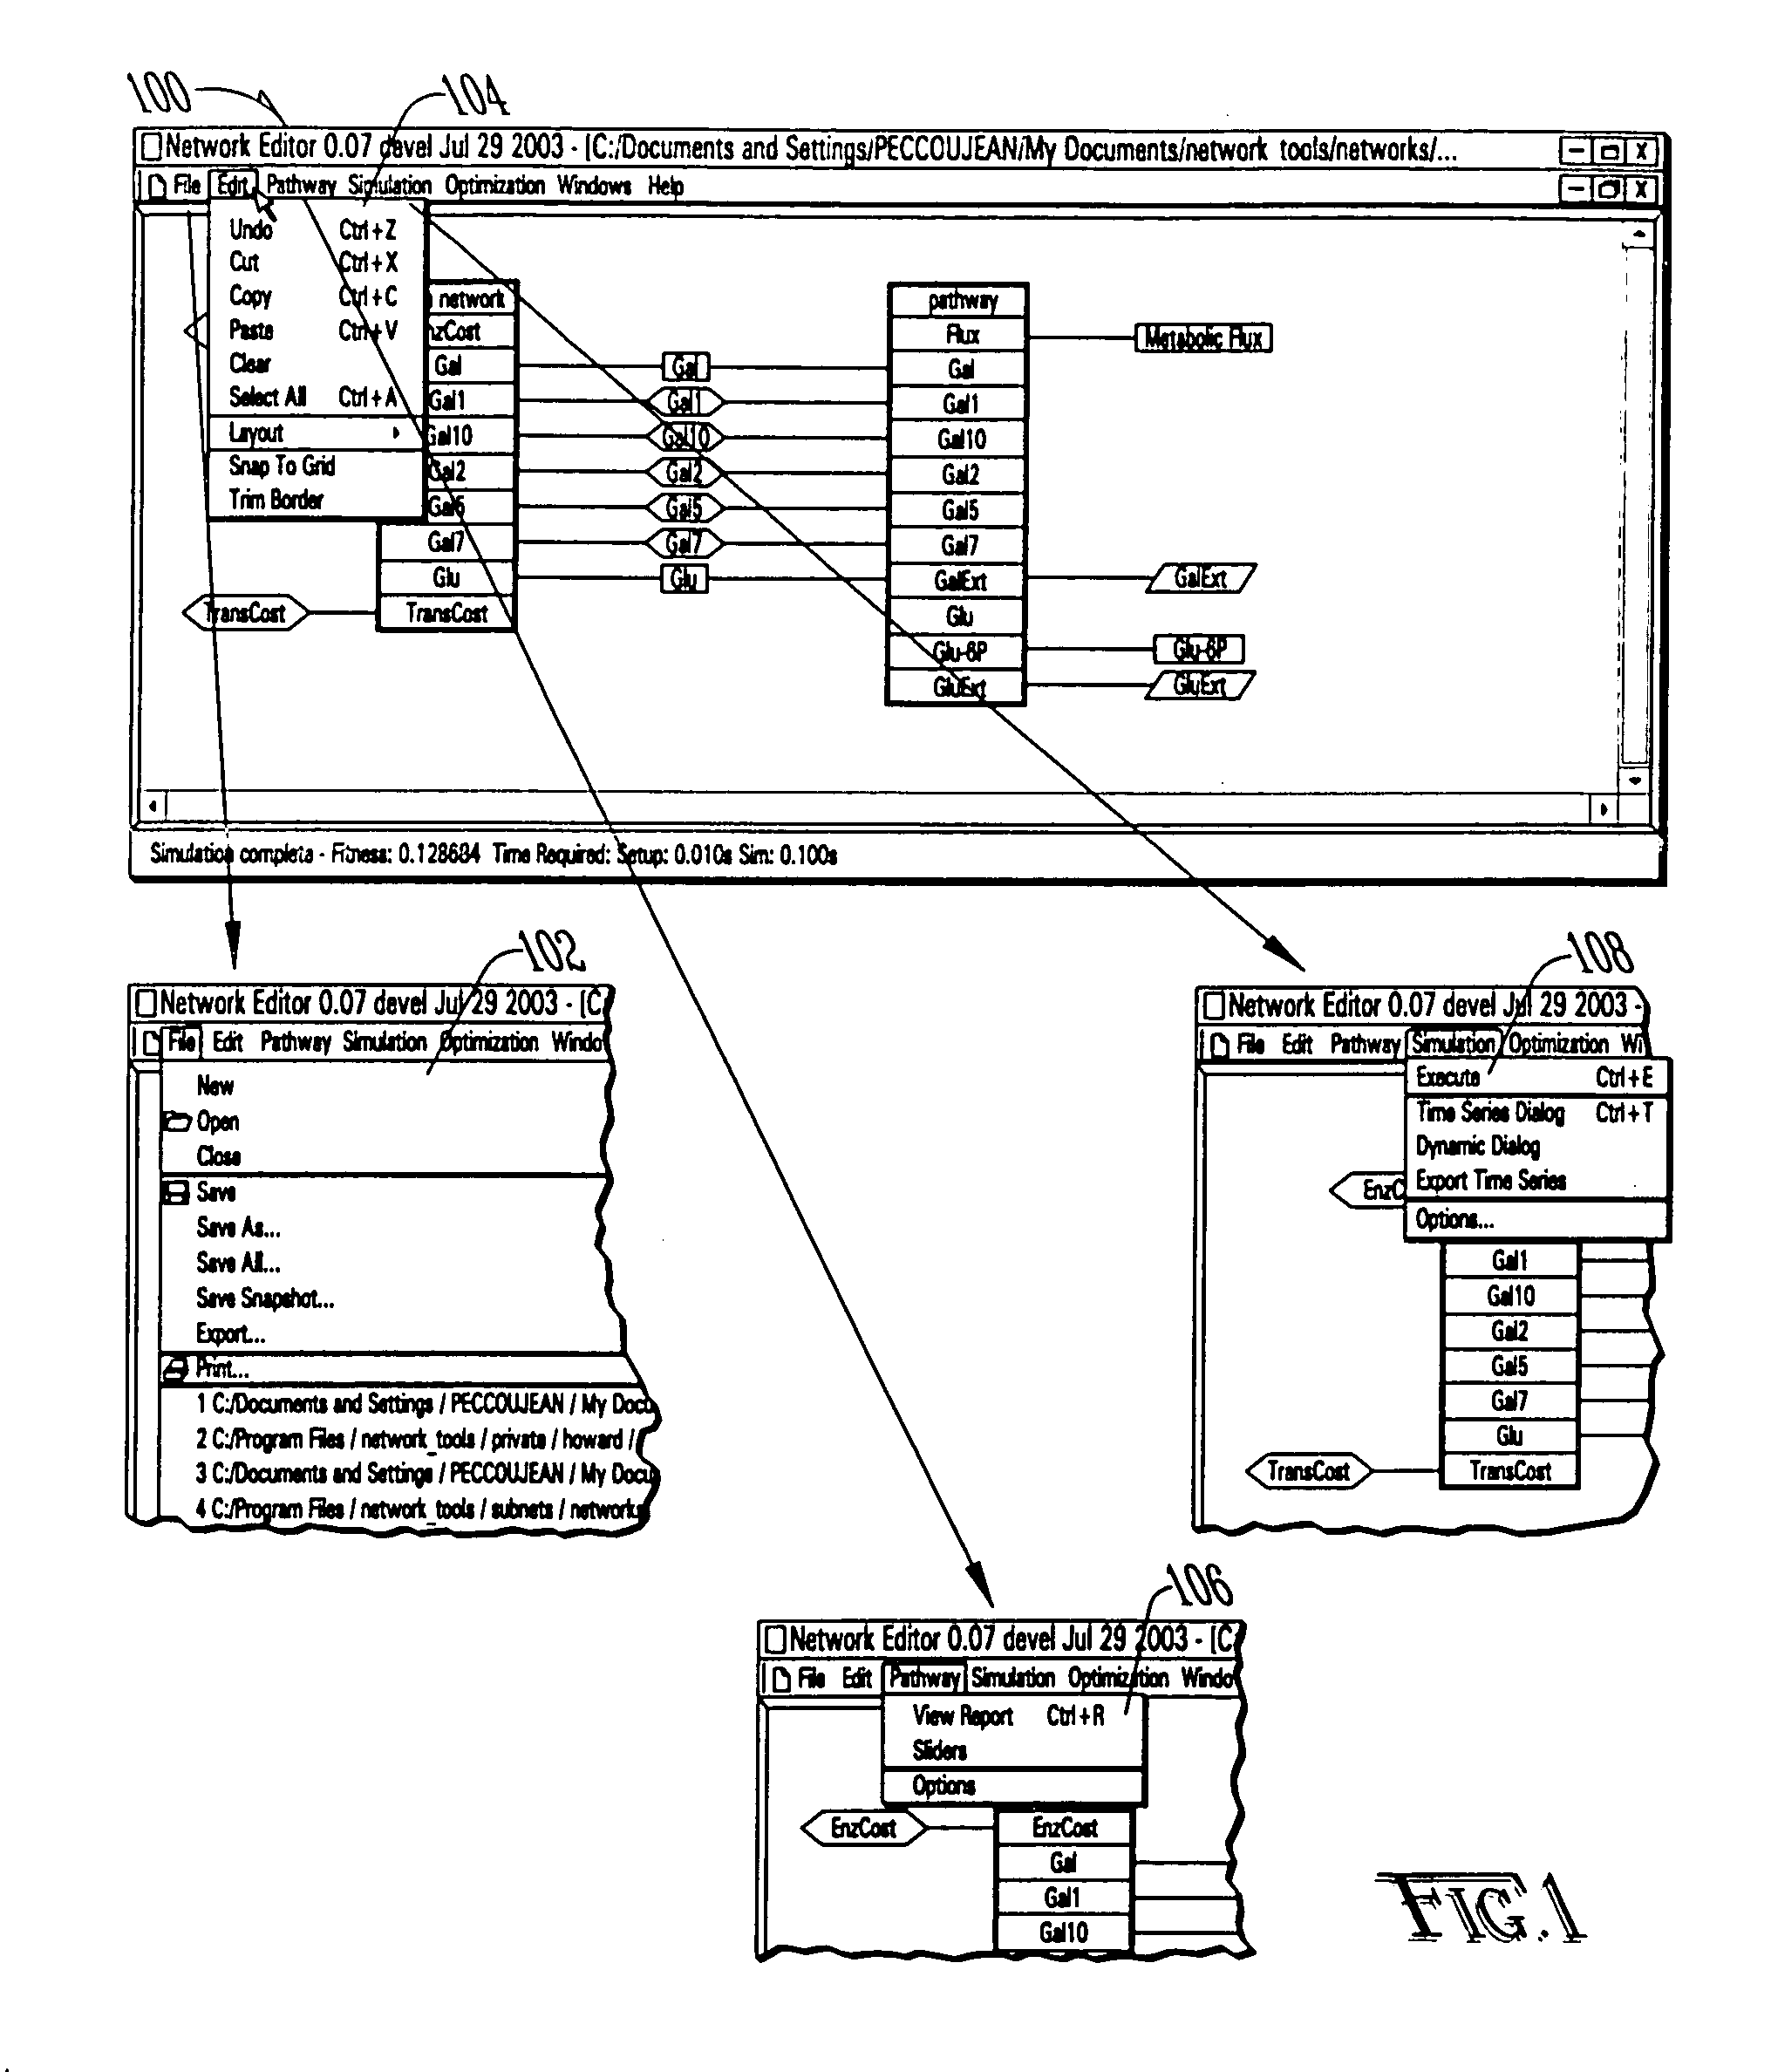
  • Computer systems and methods for genotype to phenotype mapping using molecular network models
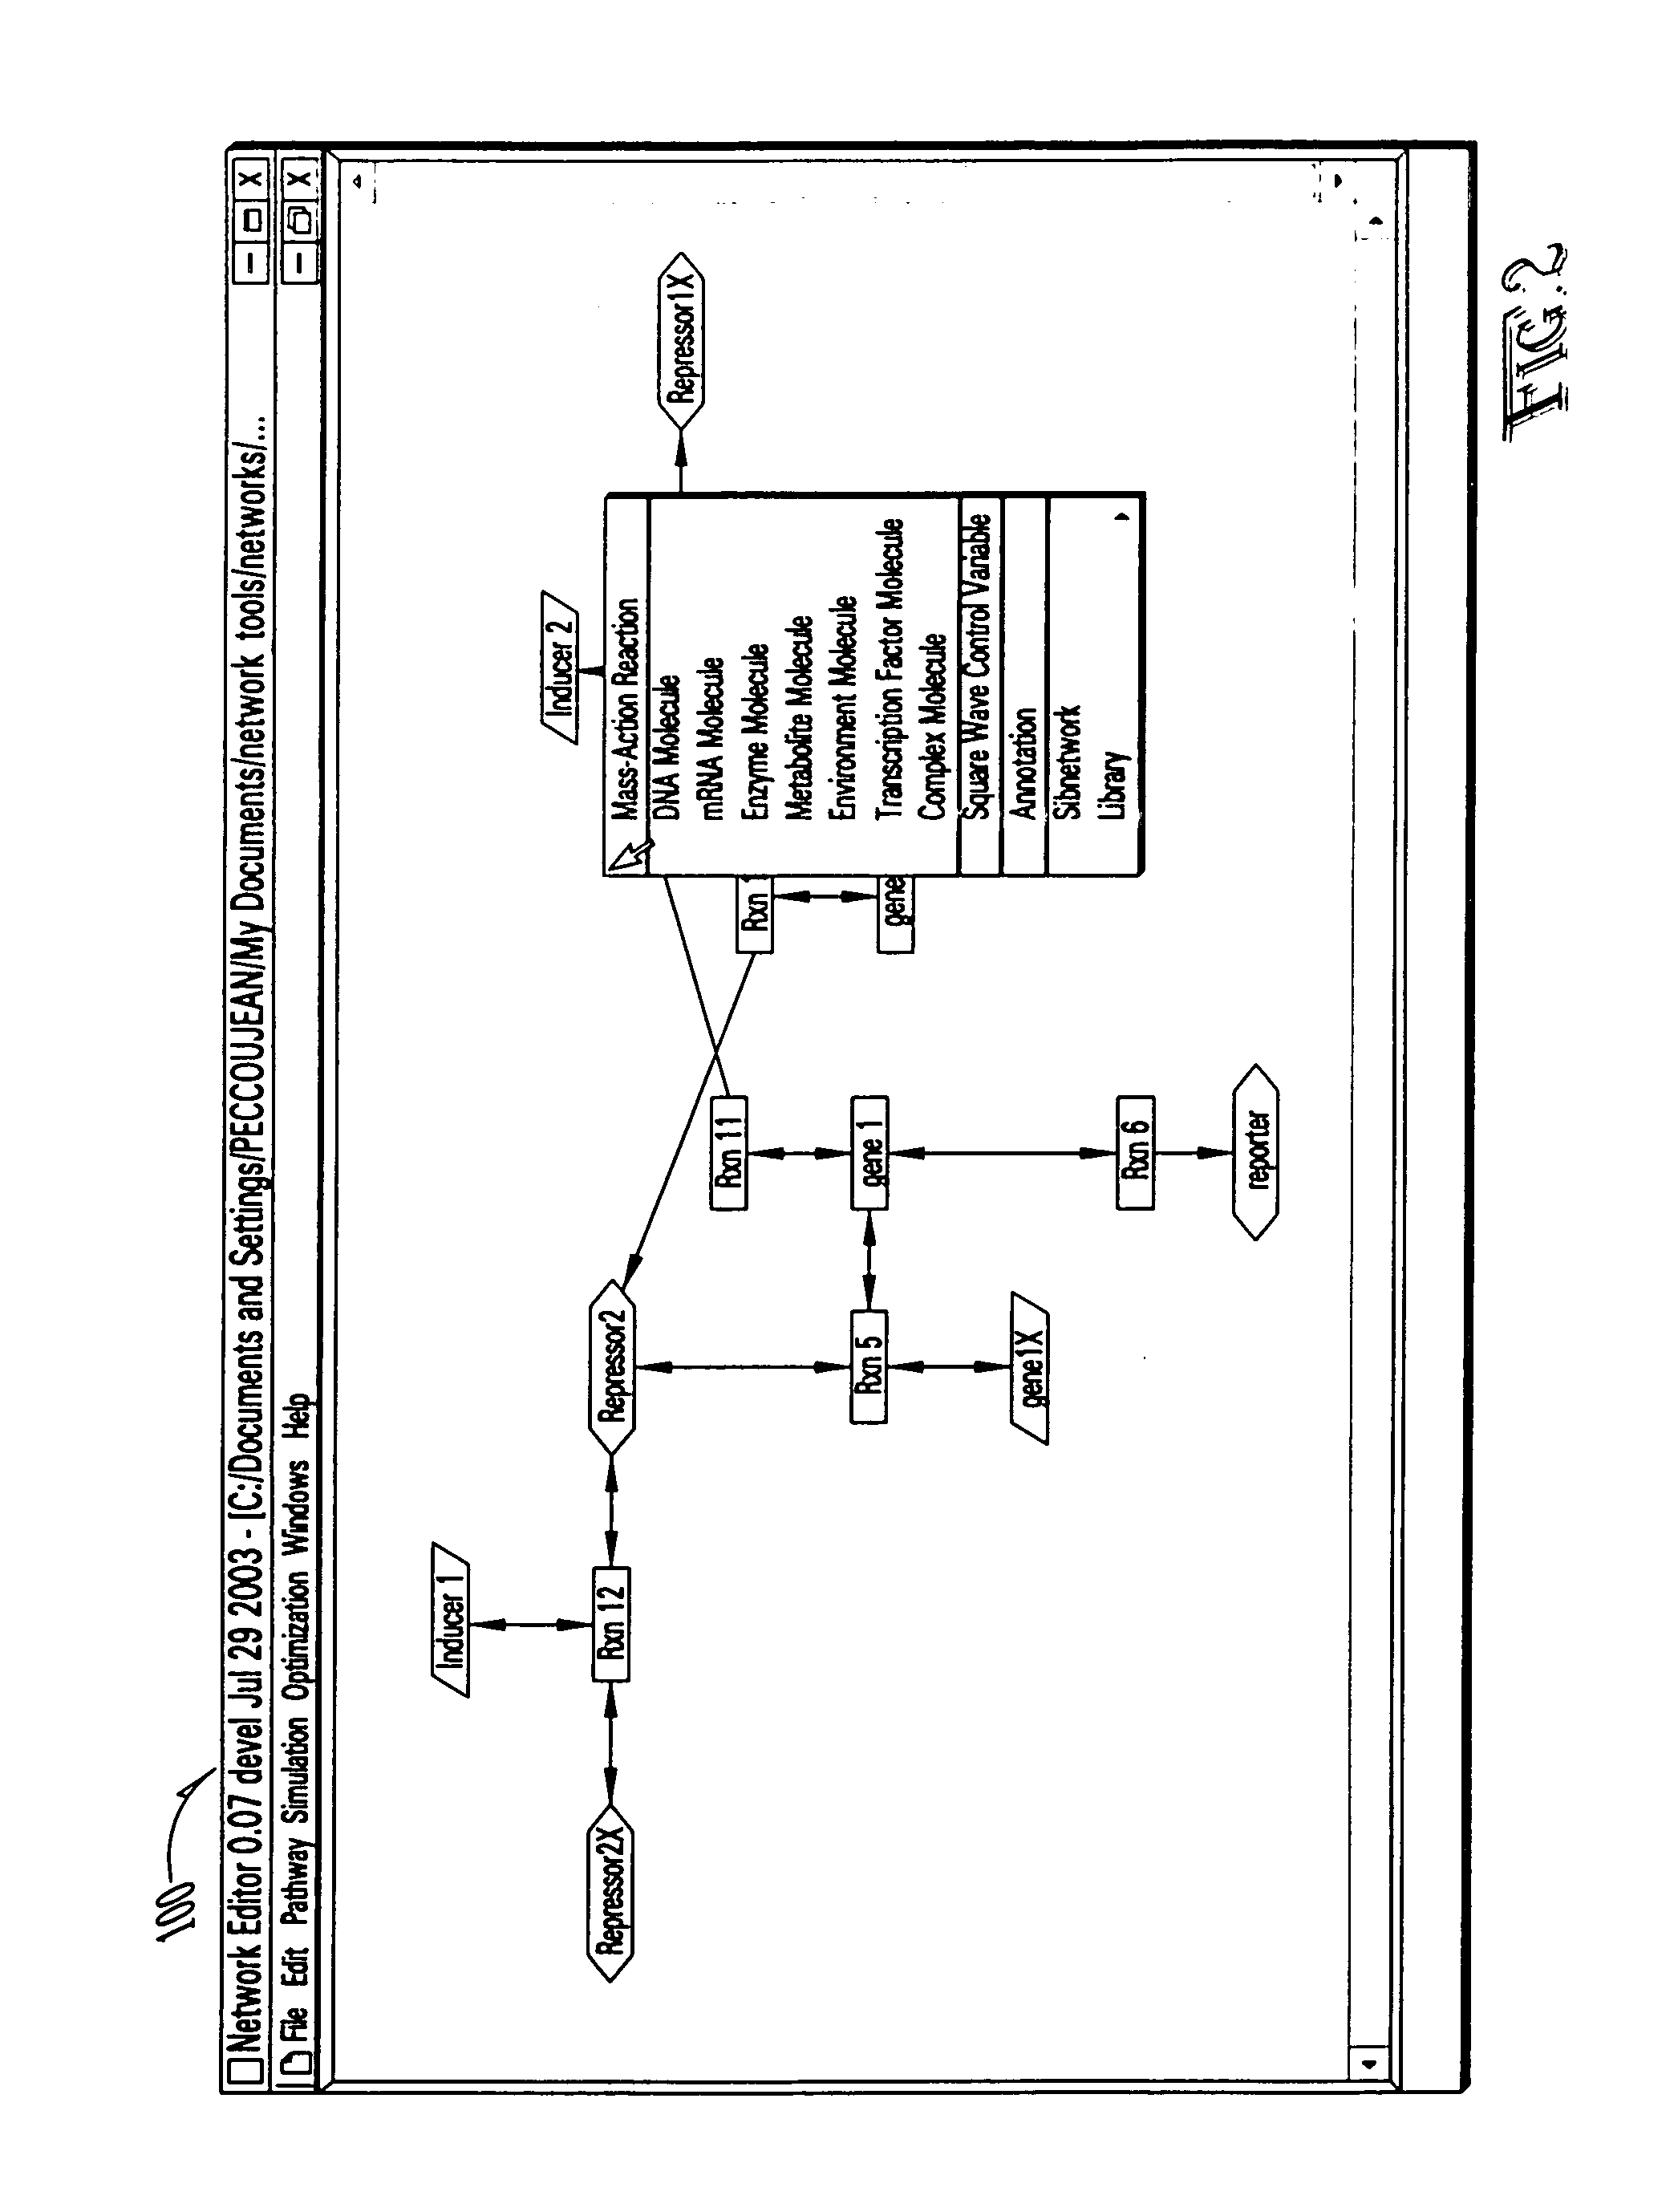
  • Computer systems and methods for genotype to phenotype mapping using molecular network models

Examples


code example 1

A Code Segment in C Implementing Differential Equations Representing Network Dynamics

[0131] f(integer N, real t, N_Vector Y, N_Vector Y2, void*f_data){const double*KC=(double*)f_data; [0132] double r0=KC[1]*N_VIth(Y, 0); [0133] double r1=KC[1]*N_VIth(Y, 0)*N_VIth(Y, 11); [0134] double r2=KC[2]*N_VIth(Y, 1)*N_VIth(Y, 11); [0135] double r3=KC[3]*N_VIth(Y, 2); [0136] double r4=KC[4]*N_VIth(Y, 8)*N_VIth(Y, 9); [0137] double r5=KC[5]*N_VIth(Y, 10); [0138] double r6=KC[6]*N_VIth(Y, 9); [0139] double r7=KC[7]*N_VIth(Y, 4)*N_VIth(Y, 12); [0140] double r8=KC[8]*N_VIth(Y, 13); [0141] double r9=KC[9]*N_VIth(Y)*N_VIth(Y, 13); [0142] double r10=KC[10]*N_VIth(Y, 6); [0143] double r11=KC[11]*N_VIth(Y, 6)*N_VIth(Y, 15); [0144] double r12=KC[12]*N_VIth(Y, 7); [0145] double r13=KC[13]*N_VIth(Y, 13); [0146] double r14=KC[14]*N_VIth(Y, 13); [0147] double r15=KC[15]*N_VIth(Y, 7); [0148] double r16=KC[16]*N_VIth(Y, 7); [0149] double r17=KC[17]*N_VIth(Y, 7); [0150] double r18=KC[18]*N_VIth(Y, 13); [0151]...

code example 2

A Code Segment in MATLAB Implementing Differential Equations Representing Network Dynamics

[0174] r1=KC(1)*Y(1); [0175] r2=KC(2)*Y(1)*Y(12); [0176] r3=KC(3)*Y(2)*Y(12); [0177] r4=KC(4)*Y(3); [0178] r5=KC(5)*Y(9)*Y(10); [0179] r6=KC(6)*Y(11); [0180] r7=KC(7)*Y(10); [0181] r8=KC(8)*Y(5)*Y(13); [0182] r9=KC(9)*Y(14); [0183] r10=KC(10)*Y(4)*Y(14); [0184] r11=KC(11)*Y(7); [0185] r12=KC(12)*Y(7)*Y(16); [0186] r13=KC(13)*Y(8); [0187] r14=KC(14)*Y(14); [0188] r15=KC(15)*Y(14); [0189] r16=KC(16)*Y(8); [0190] r17=KC(17)*Y(8); [0191] r18=KC(18)*Y(8); [0192] r19=KC(19)*Y(14); [0193] r20=KC(20)*Y(15); [0194] r21=KC(21)*Y(9); [0195] r22=KC(22)*Y(5); [0196] r23=KC(23)*Y(4); [0197] r24=KC(24)*Y(6); [0198] r25=KC(25)*Y(12); [0199] r26=KC(26)*Y(2)*Y(6); [0200] r27=KC(27)*Y(16); [0201] Y2=zeros(16, 1); [0202] Y2(2)=1.000000*r1+1.000000*r2+−1.000000*r3; [0203] Y2(3)=1.000000*r3+−1.000000*r4; [0204] Y2(4)=−1.000000*r10+1.000000*r11+1.000000*r14+1.000000*r16+−1.000000*r23; [0205] Y2(5)=1.000000*r7+−1.000...

code example 3

A Code Segment in C Implementing Trait Functions

[0216] A trait value may be defined for the simulated phenotype in the GP mapping system according to one embodiment. Below is an exemplary code segment that implements in C a number of trait functions defined for the molecular network of the yeast galactose genetic switch as well as a generic trait function based on root mean squared deviation from provided experimental measurements. See also, U.S. Provisional Application No. 60 / 499,955, filed Sep. 2, 2003 and U.S. Provisional Application No. 60 / 499,786 filed Sep. 2, 2003.

boolFitness::calculate (PathwayMatrix &pem, double &fitness, Matrix &mat) { fitness = 0.0; if(ff— == 0) {} else if(ff— == 1) {  int i, j;  int ne = targets_.ncolumns( );  int nm = targets_.nrows( );  if(pem.simulation.numEnvironment( ) != ne) {   pneDebug(“pem.simulation.numEnvironment( ) != ne”);   return false;  }IMatrix inds(nm, 1);for(i=0; i inds(i, 0) = pem.moleculeLookup(molecules_[i]); if(inds(i, 0) == −1) ...


PUM


Abstract

A computer system and methods are provided for mapping genotypes to phenotypes. The system includes a molecular network model and an optimizer. Functions of the molecular network model called trait functions are implemented to compute simulated phenotypes of the network. Simulated phenotypes are numerical properties of the molecular network that correspond to observed phenotypes which are observable properties of the biological system represented by the molecular network model. The optimizer optimizes the network to fit simulated phenotypes to observed phenotypes. The genotype to phenotype mapping system is useful in prediction of phenotypes, identification of phenotypic differences among polymorphic genotypes, determination of environmental effects on phenotypic development, determination of differences in patient response to a therapeutic agent due to genetic polymorphism, and genetic engineering of a target phenotype. Also provided are computer program products implementing the disclosed computer systems, computer data structures representing genotypic and phenotypic data, and computer readable media capable of storing such data structures.

Description

CROSS-REFERENCE TO RELATED APPLICATIONS [0001] This application claims priority to and benefit of U.S. Provisional Application No. 60 / 499,955, filed Sep. 2, 2003 and U.S. Provisional Application No. 60 / 499,786 filed Sep. 2, 2003, each of which are incorporated by reference herein.BACKGROUND OF THE DISCLOSURE [0002] 1. Field of the Disclosure [0003] The present disclosure relates in general to molecular network models. Specifically, the present disclosure provides computer systems and methods for molecular network modeling or simulation of biological processes in a living system. Qualitative as well as quantitative representation of macromolecules and their interactions is enabled. More specifically, the computer systems of this disclosure are capable of deriving genotype to phenotype maps based on molecular network models. Trait functions are provided in various embodiments, representing simulated phenotypes of the network. The system enables network optimization to match simulated ...

Claims


Application Information

Patent Timeline
Patent Type & Authority Applications(United States)
IPC IPC(8): G16B20/20G06F17/10G06F19/00G16B5/10G16B5/30G16B20/40
CPCG06F19/18G06F19/12G16B5/00G16B20/00Y02A90/10G16B5/30G16B5/10G16B20/20G16B20/40
Inventor PECCOUD, JEAN M.VANDER VELDEN, KENT A.
Owner PIONEER HI BRED INT INC
Why Eureka
Try Eureka