System and method for hyper-spectral analysis

a hyper-spectral analysis and system technology, applied in the field of methods for hyper-spectral data processing, can solve the problems of limiting the utility of imagers, prior art imagers using a single element detector can exhibit more and prior art imagers using a plurality of detectors at the image plane can exhibit serious signal-to-noise ratio problems

Inactive Publication Date: 2005-11-17
PLAIN SIGHT SYST
View PDF4 Cites 49 Cited by
  • Summary
  • Abstract
  • Description
  • Claims
  • Application Information

AI Technical Summary

Benefits of technology

[0023] In accordance with an embodiment of the present invention, the hyper-spectral analysis system and method utilizes the spectral data collected from a pathology slide using a tuned light source spectral imaging system. The local variability analysis in accordance with an embodiment of the present invention characterizes nuclei and other tissue types, and distinguishes normal from abnormal tissue in a mixed (cancer and non-cancer) patient population. It is appreciated that the present invention can be applied in a similar manner

Problems solved by technology

Prior art imagers using a plurality of detectors at the image plane can exhibit serious signal-to-noise ratio problems.
Prior art imagers using a single element detector can exhibit more serious signal-to-noise ratio problems.
Signal-to-noise ratio problems limit the utility of imagers applied to chemical imaging applications where subtle differences between a sample's constituents become important.
However, the use of a plurality of detectors or the use of a macro moving grating has signal-to-noise limitations.
Each filter element employed can be very expensive, difficult to manufacture and all are permanently set at the time of manufacture in the wavelengths (bands) of radiation that they pass or reject.
Physical human handling of the filter elements can damage them and it is time consuming to change filter elements.
Clearly, however, this

Method used


Image

  • System and method for hyper-spectral analysis
  • System and method for hyper-spectral analysis
  • System and method for hyper-spectral analysis

Examples


Embodiment Construction

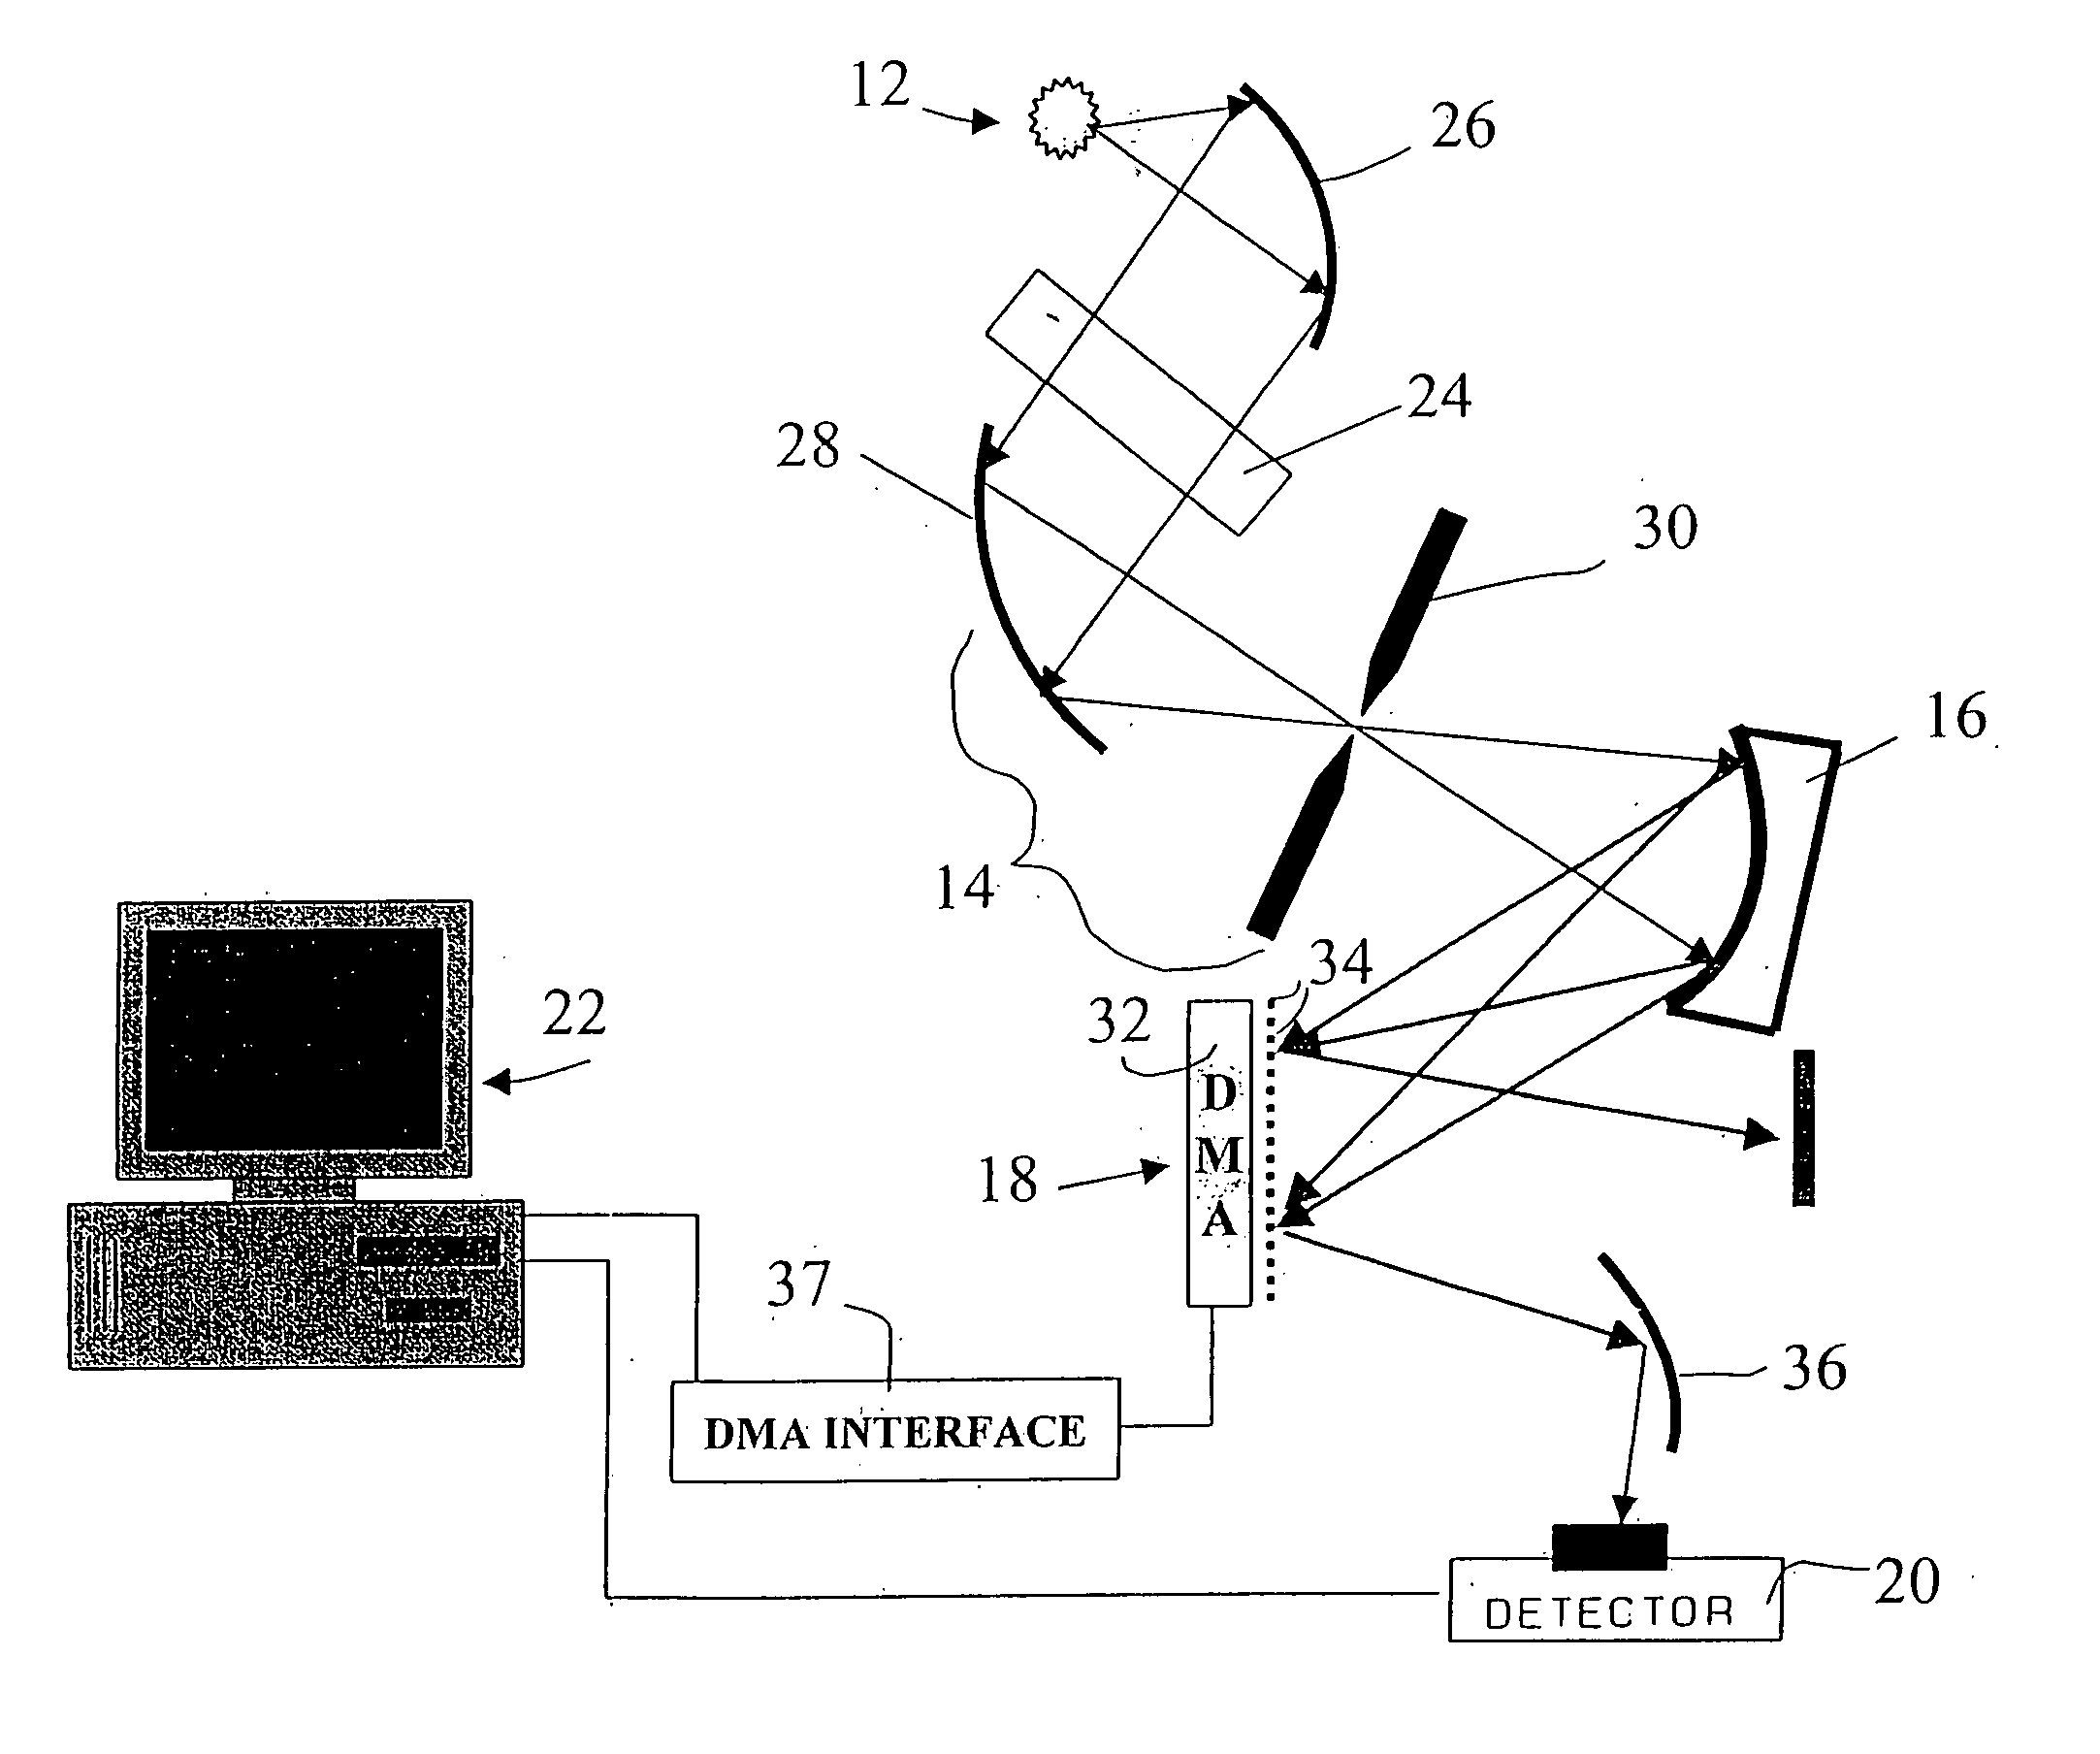
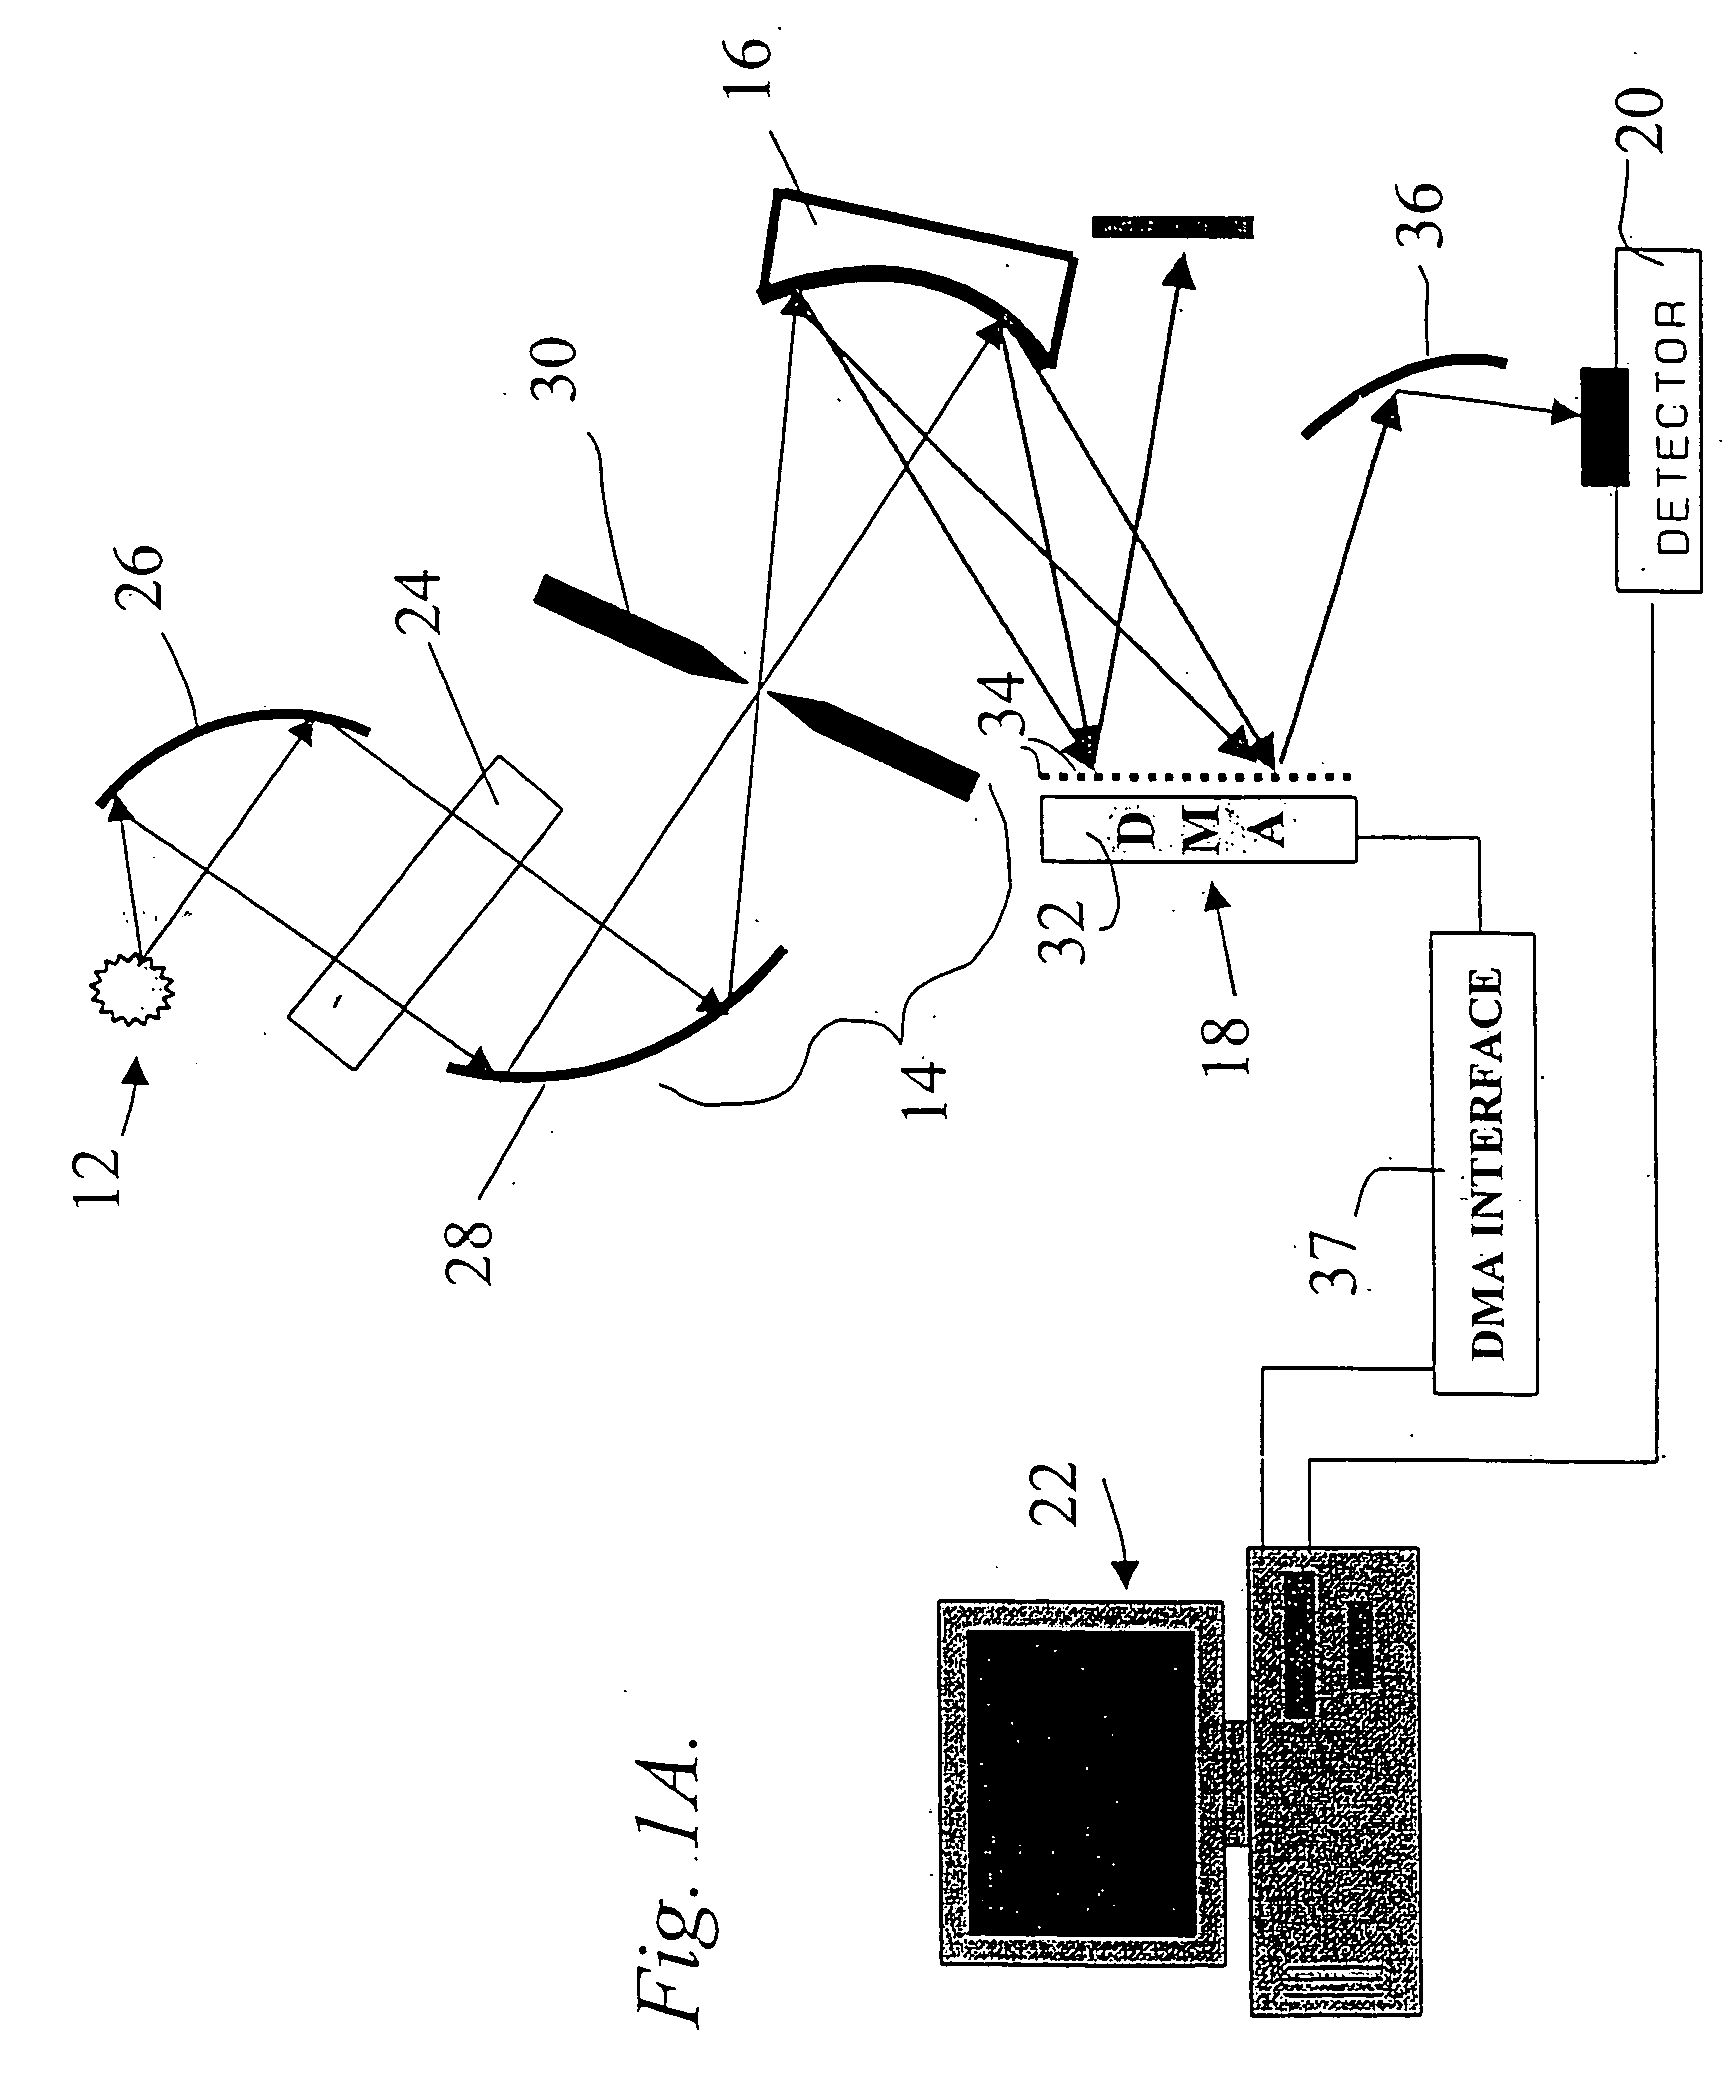
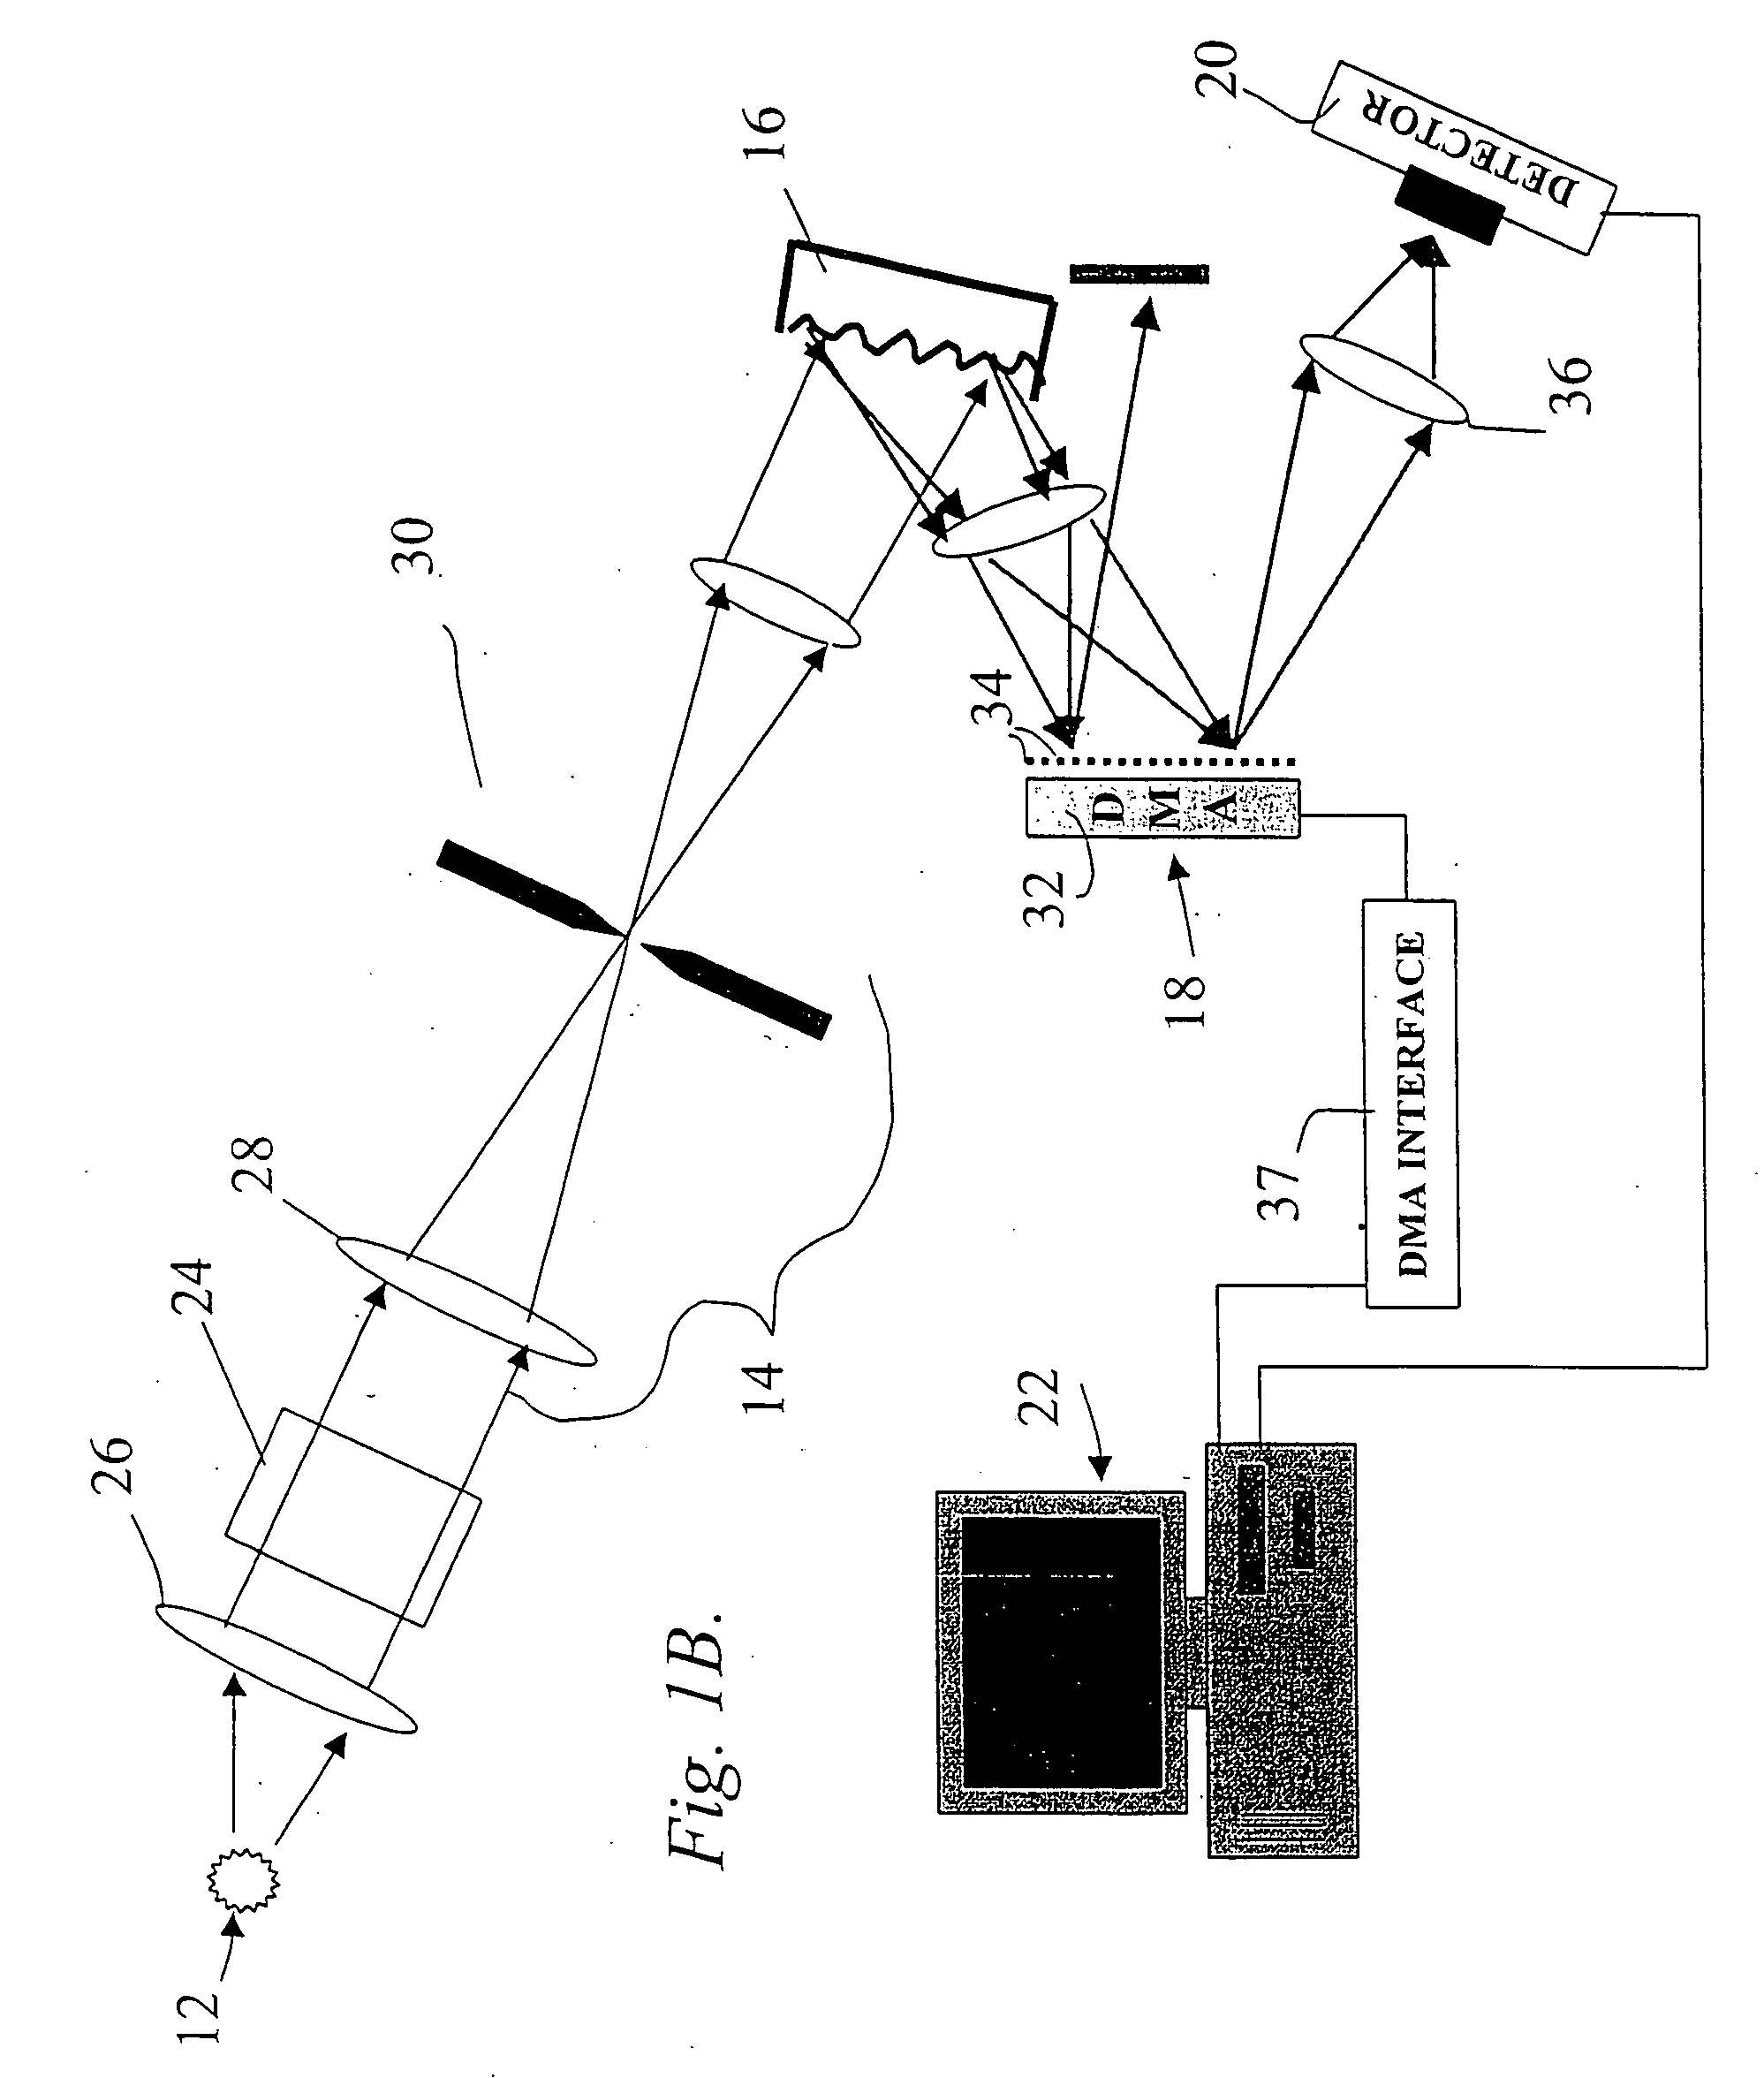
[0062] Turning now to the drawing figures and particularly FIG. 1A and 1B, a spectrometer assembly 10 constructed in accordance with one embodiment of the invention is illustrated. With reference to FIG. 1A the device broadly includes a source 12 of electromagnetic radiation, a mirror and slit assembly 14, a wavelength dispersing device 16, a spatial light modulator 18, a detector 20, and an analyzing device 22.

[0063] In particular, the electromagnetic radiation source 12 is operable to project rays of radiation onto or through a sample 24 that is to be analyzed, such as a sample of body tissue or blood. The radiation source can be any device that generates electromagnetic radiation in a known wavelength spectrum such as a globar, hot wire, or light bulb that produces radiation in the infrared spectrum. To increase the amount of rays that are directed to the sample, a parabolic reflector 26 can be interposed between the source 12 and the sample 24. In a specific embodiment, the sou...


PUM


Abstract

A hyper-spectral analysis method for characterizing or distinguishing diverse elements within hyper-spectral images. A plurality of patches of pixels from within the hyper-spectral images are extracted as being patches around pixels of the elements to be characterized or distinguished. The statistics of spectra for each patch of pixels are computed. A first classifier is computed from frequency-wise standard deviation of the spectra in each patch and a set of second classifiers are computed from principal components of the spectral in each patch. A combined classifier is computed based on the output of the first classifier and at least one of the second classifiers. The elements are characterized or distinguished based on the output of at least one of the classifiers, preferably the combined classifier.

Description

RELATED APPLICATION [0001] This application claims priority benefit of provisional patent application no. 60 / 550,615, filed Mar. 6, 2004, which is incorporated by reference in its entirety and is a continuation-in-part of application Ser. No. 10 / 832,684, filed Apr. 26, 2004, which is a divisional of application Ser. No. 09 / 798,860, filed Mar. 1, 2001, now U.S. Pat. No. 6,859,275, which is a continuation-in-part of application Ser. No. 09 / 672,257, filed Sep. 28, 2000, now U.S. Pat. No. 6,392,748, which is a continuation of application Ser. No. 09 / 502,758 filed Feb. 11, 2000, now U.S. Pat. No. 6,128,078, which is a continuation of application Ser. No. 09 / 289,482 filed Apr. 9, 1999, now U.S. Pat. No. 6,046,808, each of which is incorporated by reference in its entirety.FIELD OF THE INVENTION [0002] The present invention relates generally to methods for hyper-spectral data processing and more particularly to a method and system for characterizing diverse elements within hyper-spectral i...

Claims


Application Information

Patent Timeline
IPC IPC(8): G01J3/02G01J3/10G01J3/28G01J3/36G06V10/56G06V20/13G06V30/224
CPCG01J3/02G01J3/0208G01J3/021G01J3/0218G06K9/4652G01J3/28G01J3/2823G01J3/36G01J3/10G06V20/13G06V10/56
Inventor GESHWIND, FRANKCOIFMAN, RONALD R.COPPI, ANDREASDAVIS, GUSTAVE L.DEVERSE, RICHARD A.FATELEY, WILLIAM G.WARNER, FREDERICK J.
Owner PLAIN SIGHT SYST
Why Eureka
Try Eureka