Aerated products with reduced creaming
Inactive Publication Date: 2007-05-24
CONOPCO INC D B A UNILEVER
80 Cites 35 Cited by
AI-Extracted Technical Summary
Problems solved by technology
In contrast, a combination of stabilisers with other surface active agents, such as sodium caseinate, instead of hydrophobin did not result in a stable foam.
Use of a continuous...
Benefits of technology
[0007] In our co-pending application WO 06/010425, we have found that a fungal protein termed hydrophobin allows the production of foam with excellent stability to disproportionation and coalescence. Hydrophobin is an aerating agent that we have f...
Abstract
A flowable aerated composition is provided which comprises hydrophobin and a yield stress agent, the composition having a continuous phase viscosity, measured at a shear rate of 10 s−1, of from 0.01 to 2000 Pa s, and a continuous phase apparent yield stress of at least 4 Pa.
Application Domain
Milk preparationFrozen sweets +2
Technology Topic
HydrophobinOrganic chemistry +1
Image
Examples
- Experimental program(3)
Example
Example 1
Flowable Stable Foams with Reduced Creaming
Materials and Formulations
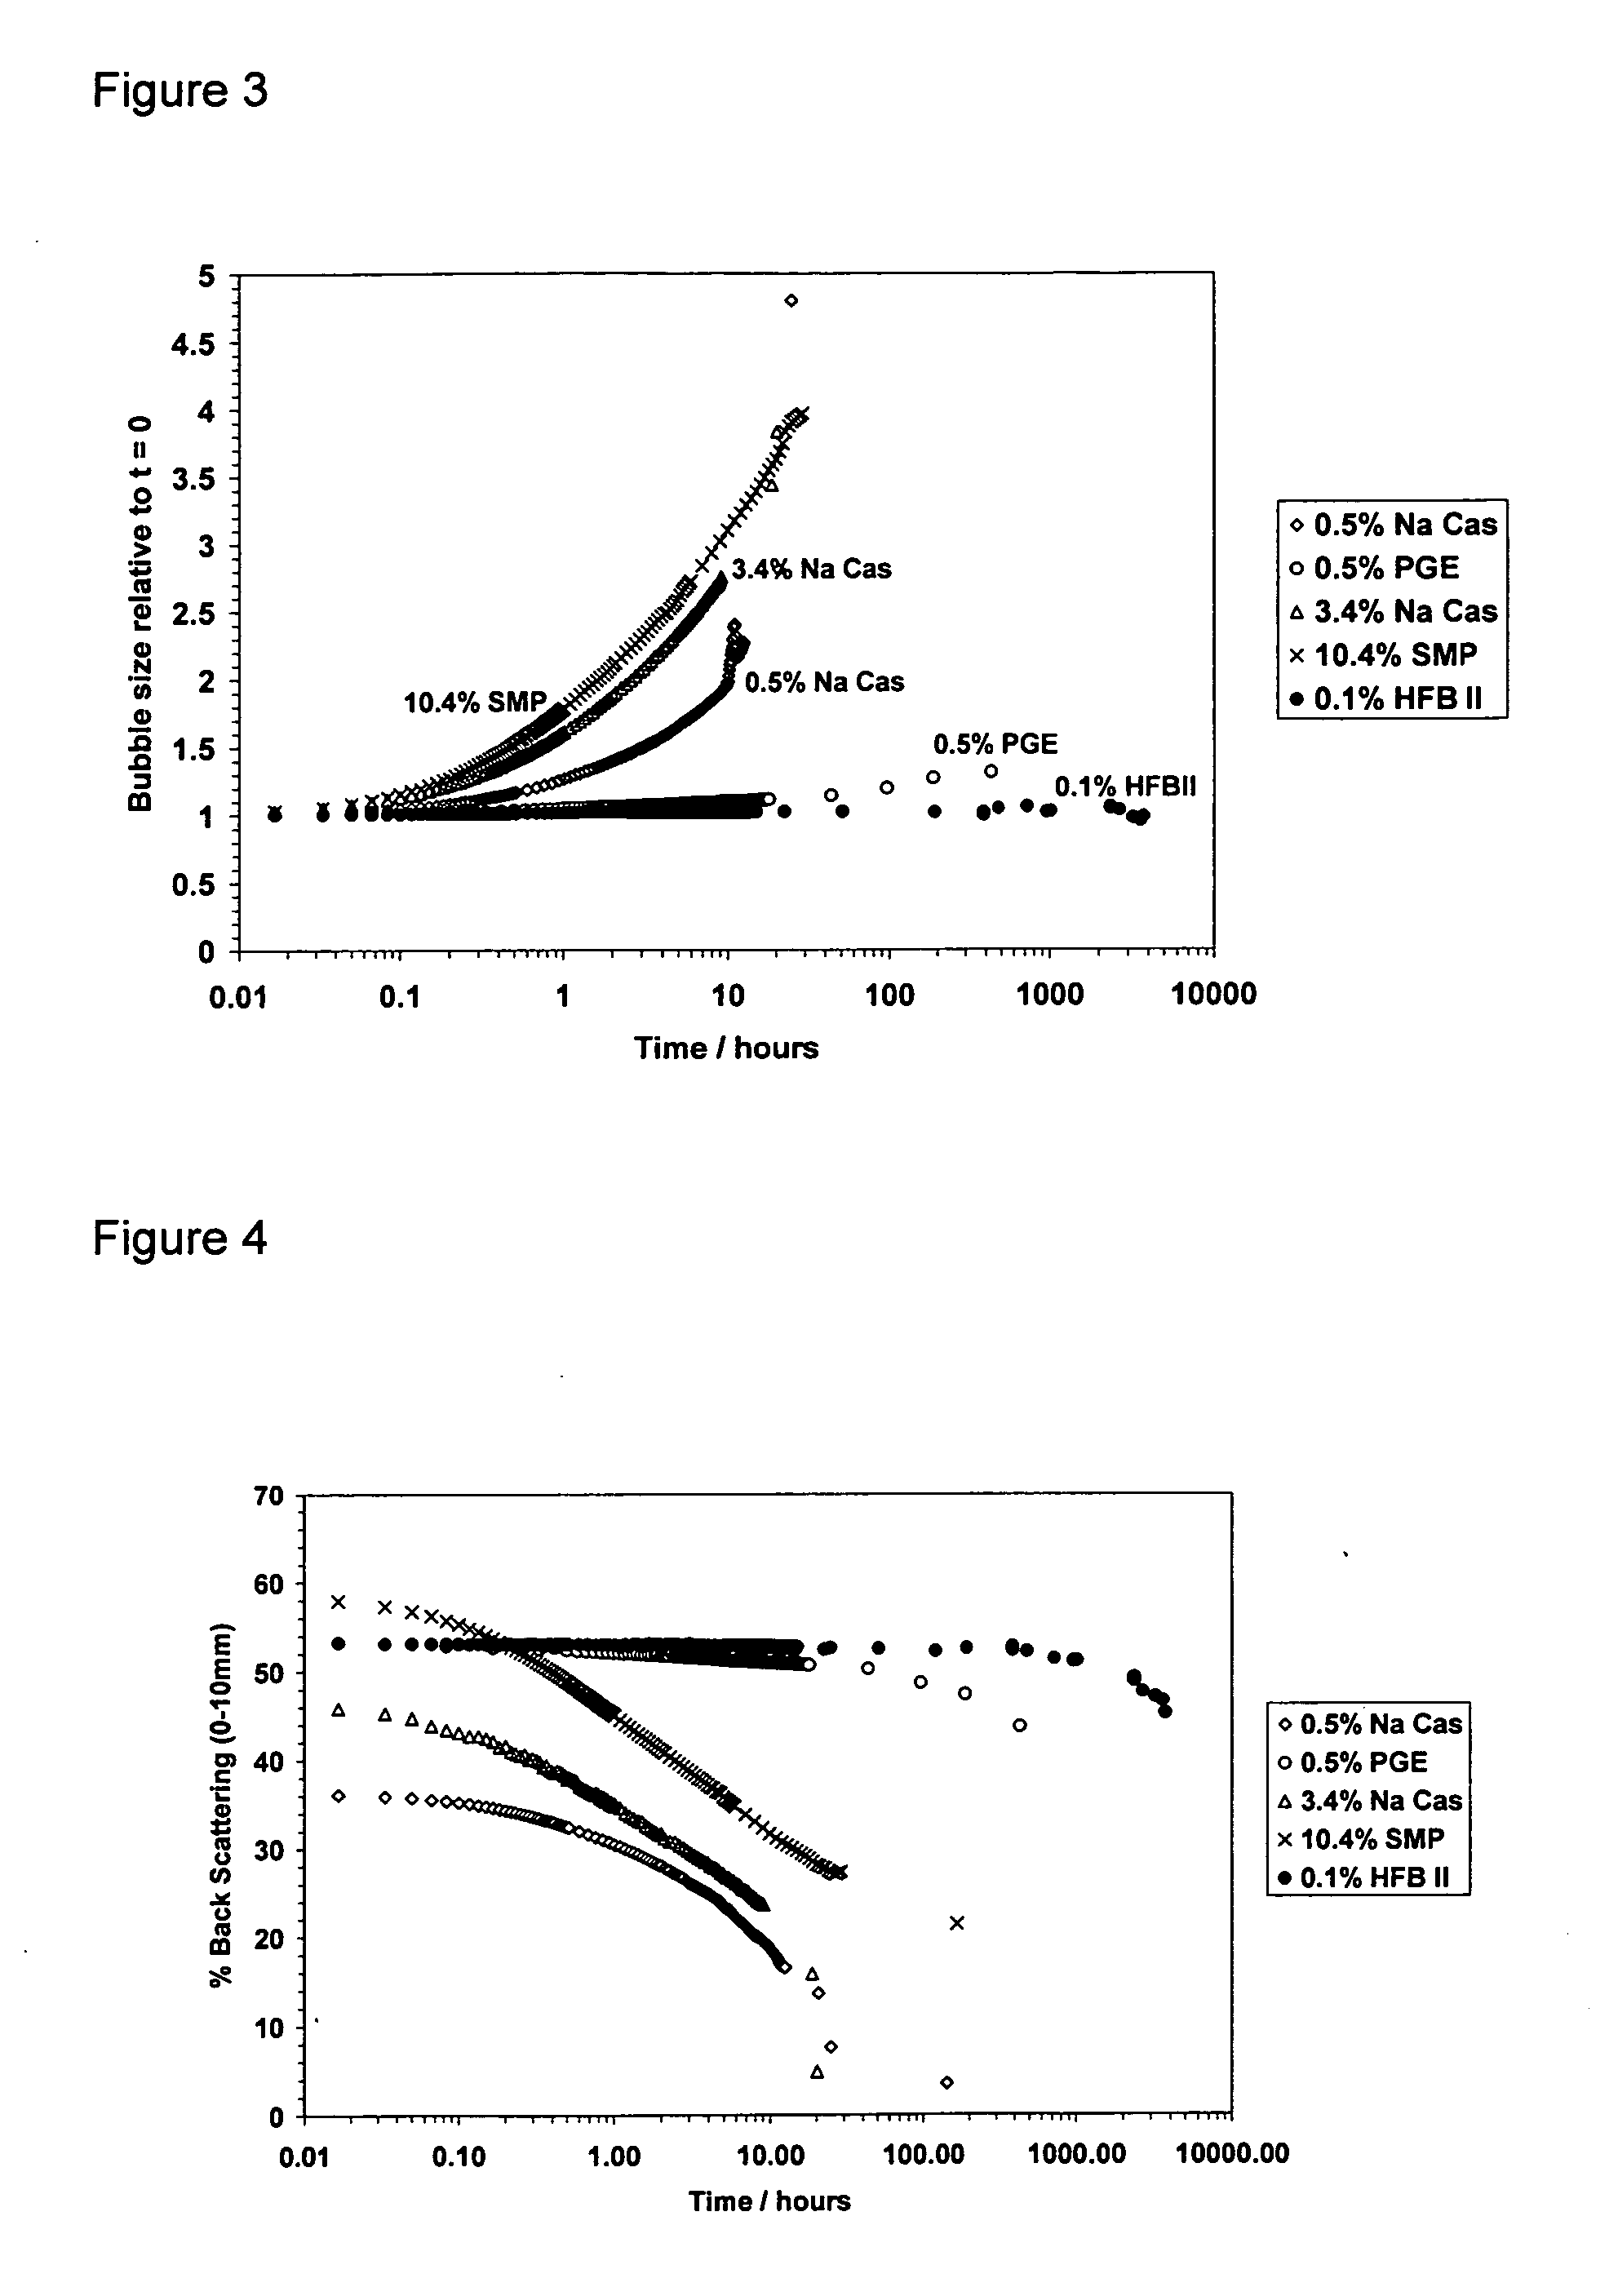
[0106] Examples of aerated chill products were prepared using 3 types of surface active protein (A to C) and a lipogel forming emulsifier (D):
[0107] A: Sodium Caseinate (Na Cas)
[0108] B: Skimmed Milk Powder (SMP)
[0109] C: Hydrophobin (HFBII) from Trichoderma reesei
[0110] D: Polyglycerol ester of saturated fatty acids (PGE)
[0111] Details of the materials used are summarised in Table 1 and the formulations from which each of the chill foam samples was prepared are shown in Table 2. Foams were prepared and stored at chill temperatures (5° C.). Their foam stability, with respect to bubbles size and creaming were monitored over time using the Turbiscan instrument. TABLE 1 Ingredients used with supplier information Ingredient Composition Supplier Sodium caseinate 88-90% protein, 1.5% DMV International, fat, 6% moisture The Netherlands. Skimmed milk powder 33-36% protein, 0.8% United Milk, UK. fat, 3.7% moisture Polyglycerol ester 100% fat Danisco (PGE 55) HFB II Purified from T. reesei* VTT Biotechnology, Finland. Xanthan Gum polysaccharide CP Kelco (Keltrol RD)
*Class II hydrophobin purified from Trichoderma reesei essentially as described in WO00/58342 and Linder et al., 2001, Biomacromolecules 2: 511-517).
[0112] TABLE 2 Formulations Mix Mix Mix Mix Mix Mix Mix A B C D E F G Ingredient Concentration/wt % Sodium caseinate 3.4 0.5 — — — — — Skimmed milk powder — — 10.4 — — — — PGE 55 — — — — — — 0.5 HFB II — — — 0.1 0.1 0.1 — Xanthan gum 0.5 0.5 0.5 0.5 0.4 0.3 0.5 Water 96.9 99.0 89.1 99.4 99.5 99.6 99.0
Preparation and Analysis of the Aerated Products
Mix Preparation
[0113] All mixes were made in 100 g batches. For Mixes A, B and C (containing sodium caseinate and skimmed milk powder, respectively), the protein and xanthan gum were blended and added slowly into stirred water at room temperature. The solutions were subsequently heated (to 55° C. for Na Cas and to 40° C. for SMP) to ensure that proteins were properly hydrated. The mixes were cooled and stored at 5° C. until further use.
[0114] Mix G was prepared by blending the xanthan gum powder and PGE powder together, dispersing in cold de-ionised water and then heating to 60° C. with stirring for 30 minutes. This solution was then cooled and stored at 5° C. until further use.
[0115] For Mixes D, E, and F (containing HFB II), the xanthan was first dispersed into cold water with stirring for at least 30 minutes. Then, the required concentration of HFB II was added to this as an aliquot. The solution was then gently sonicated in a sonic bath for 30 seconds to fully dissolve the HFB II. The mix was cooled and stored at 5° C. until further use.
[0116] The high levels of Na Caseinate and SMP were chosen as the protein concentrations are proportionate with the levels found in commercially sold milk shake drinks.
Aerating Process
[0117] 80 mL of mix was sheared in a stirred pot apparatus (cooled to 5° C.) at a rate of 1200 rpm for a timed duration that corresponded to obtaining 100% overrun. Aeration times to reach 100% overrun are summarised in Table 3. The stirred pot equipment consists of a cylindrical, vertically mounted, jacketed stainless steel vessel with internal proportions of 105 mm height and diameter 72 mm.
[0118] The rotor used to shear the sample consists of a rectangular impeller of the correct proportions to scrape the inner surface of the vessel as it rotates (dimensions 72 mm×41.5 mm). Also attached to the rotor are two semi-circular (60 mm diameter) high-shear blades positioned at a 45° angle to the rectangular attachment. Post aeration, samples were stored at 5° C. in 100 mL measuring cylinders or standard Turbiscan vials before further analysis. TABLE 3 Aeration time and overrun for mixes A-G Sample Aeration time/mins Overrun/% Mix A 1 100 Mix B 1.16 100 Mix C 1 100 Mix D 2 100 Mix E 2 100 Mix F 2 100 Mix G 10 100
Viscosity and Apparent Yield Stress Measurements
[0119] Rheological measurements were made using an AR-G2 rheometer (TA Instruments Ltd, Crawley, UK). Stepped flow experiments were performed on unaerated mixes to determine viscosity versus shear stress and viscosity versus shear rate curves. All measurements were carried out at 5° C. (using peltier-controlled cooling). A cone and plate geometry was used. The cone was made of stainless steel and was 6 mm in diameter with a 2° angle. From these data, plots of viscosity as a function of shear stress and viscosity as a function of shear rate could be determined. Using the Hershel Bulkley model (which fits to data at the high shear stress end of the data), an apparent yield stress can be determined.
Measurement of Foam and Bubble Stability and Extent of Foam Creaming
[0120] The stability of the foam and the bubbles therein was measured using the Turbiscan TLab, the operating details of which were discussed previously. This enables the determination of the following as a function of time: (1) The foam volume (i.e. measurement of overall air phase loss). (2) The average bubble size. (3) The extent of creaming in the foam.
[0121] The produced foam was dosed into a Turbiscan glass sample tube up to a height of about 42 mm, corresponding to approximately 20 mL of foam. The equipment then scans and measures both the backscattered and transmitted light between the height of 2 and 55 mm. Measurements were taken over a period of several weeks. Since data is collected over the full sample height, from this, the mean values of the backscattering profiles between defined limits (lower and upper height) give specific information with respect to changes in the sample in that area, e.g. bubble size or creaming.
[0122] Bubble size: From the backscattered data measured between 20 and 30 mm, the average bubble size was calculated automatically from the backscattered light. The refractive indices were taken as those of water and air. The air phase volume fraction of the foam was 0.5. Although the air phase volume fraction of the foam can change over time, particularly if it is not stable and creaming takes place, we found that taking measurements between 20 and 30 mm height of the sample gave reliable size data unless the foam was very unstable. If the foam was highly unstable, then the size data needs to be treated with caution in a quantitative sense but can be compared with that of other foams.
[0123] Foam creaming: The extent of creaming in the foam was measured by two methods.
[0124] 1. Light scattering using the Turbiscan: The amount of foam creaming over time was determined by measuring the change in backscattered light over time between the sample height of 0 to 10 mm. As the foam creams, the backscattering intensity between these heights will be expected to decrease, since more light will be backscattered in the presence of air bubbles. These data were obtained principally for the HFBII foams because the stability of the bubbles means that the changes in backscattering can be attributed solely to changes in the volume of air bubbles within a region of the sample cell. For less stable foams that exhibit both rapid bubble growth and creaming, it is more difficult to quantitatively de-convolute the two since both processes occur at the same time.
[0125] 2. Visual observations in a measuring cylinder. 100 mL of produced foam were placed in a 100 mL measuring cylinder and the top covered with cling film to prevent drying of the top of the foam. The height of the foam and the height of serum (continuous phase) as the foam creams over time were recorded. Even when bubble growth and serum separation (creaming) occur at the same time, the extent of creaming can be quantitatively stated.
RESULTS AND DISCUSSION
Viscosity and Yield Stress of Mixes
[0126] The viscosity and the yield stress of the mix is important in preventing or controlling the rate of bubble creaming. Therefore, in formulating aerated products where creaming is arrested, it is appropriate to make some analysis of the rheology to aid in predictive capability. Here we describe some of the main rheological features of Mixes D, E, and F, containing 0.1 wt % HFBII and 0.5, 0.4, and 0.3 wt % xanthan in the solution, respectively.
[0127]FIGS. 1 and 2 both show important rheological conditions for the enabling of pourable foams. The data in FIG. 1 show the effect of xanthan concentration on the apparent yield stress and on the viscosity of the solution. Using the Hershel Bulkley model (which fits to data at the high shear stress end of the data), an apparent yield stress can be determined. From the data, we calculate for:
[0128] 0.3 wt % xanthan solution with 0.1% hydrophobin−apparent yield stress=2.8 Pa
[0129] 0.4 wt % xanthan solution with 0.1% hydrophobin−apparent yield stress=4.5 Pa
[0130] 0.5 wt % xanthan solution with 0.1% hydrophobin−apparent yield stress=5.5 Pa
[0131] The apparent yield stress is the main parameter that will govern the rate and extent of creaming. The data in FIG. 2 shows the effect of xanthan concentration on the viscosity of the mixes at high shear. We suggest that the viscosity of the mix at shear rates between 10 and 100 s−1 is comparable to the viscosity that would be experienced in flow or consumption. For each of the xanthan concentrations, the mix viscosity over the shear rate regime 10 to 100 s−01 is less than 1 Pa s.
Bubble Stability
[0132] The change in relative average bubble size (dr) of in the foams as a function of time are shown in FIG. 3. In the case of HFBII, the bubbles are very stable and no change in average size is seen after several weeks storage at chill. 0.5% PGE also shows good stability, although the average bubble size does gradually increase. Further, the level of PGE used (0.5 wt %) is higher than that normally permitted in foodstuffs. Each of the non-HFB proteins show poor stability. Rapid bubble growth occurs over just a few hours for each of the aerated mixes. Coarsening of these foams accelerates over the short life time, ultimately leading to complete foam break down.
Creaming of the Foam
[0133]FIG. 4 shows the changes in back scattering as a function of time over the height range 0 to 10 mm in the sample vial. In the case of PGE and HFBII, where the bubble sizes were shown to stay near constant over long periods of time (particularly with HFBII), it is apparent that the backscattering also does not change significantly. Only a small amount of creaming is observed over long time scales (over 1000 hours, which equates to in excess of one month).
[0134] In the case of the foams stabilised by the dairy proteins (SMP and Na Cas), interpreting the light scattering data is somewhat more complex since both creaming and bubble growth will occur concurrently. However, some general remarks can be made. Using a concentration of 0.5% xanthan, at time=0 the bubbles are of comparable initial size to those made with HFBII. Therefore, we expect creaming to be inhibited at this point. However, bubble growth does occur (due to disproportionation and coalescence) leading to a decrease in the measured backscattering. Ultimately, the bubbles will exceed a critical average diameter and then they will start to cream as the buoyancy force exceeds the yield stress holding the bubbles in place. Although the presence of xanthan gum provides a yield stress to the system which is expected to prevent creaming of small bubbles (ca.<200 μm diameter), eventually the bubbles grow beyond this and the yield stress is not enough to prevent the rise of the bubbles. This process, and further bubble growth, leads to an accelerating rate of decrease in the backscattering over time.
[0135] Foam stabilised by HFB II clearly shows superior stability to any of the other surfactants investigated here.
Effect of Xanthan Concentration (i.e. Effect of Apparent Yield Stress)
[0136] The data presented in FIGS. 5 and 6 demonstrate the effect of xanthan concentration, and hence yield stress, on the extent of creaming in a foam consisting of stable bubbles produced using 0.1% HFBII.
[0137] In FIG. 5, it is clear that at 0.5% xanthan concentration, over a period of 1000+hours, the bubble size in the sample area measured changes very little. Decreasing the concentration of xanthan to 0.4% leads to a small decrease in measured bubble size over long time periods. This is probably not due to bubble shrinkage, but rather due to creaming of bubbles. The larger bubbles rise out of the measurement zone, leaving a larger proportion of bubbles in the measurement zone. This leads to an apparent decrease in average bubble size. The same effect is seen at 0.3% xanthan over a shorter time period. The effect is quicker due to the lower yield stress. It should be highlighted, however, that the changes observed at 0.4 and 0.5% xanthan concentrations are relatively small.
[0138] The conclusions drawn from FIG. 5 are further demonstrated in FIG. 6. This shows the extent of creaming through the measured backscattering at the bottom of the sample vial (0 to 10 mm). Clearly, at 0.5% xanthan, creaming is inhibited with only a small amount of visible serum layer apparent after over a month's storage. Creaming takes place more quickly and to a greater extent as the amount of xanthan is reduced and the yield stress is reduced. These changes occur at the same time as the bubble size changes seen in FIG. 5.
[0139] The visual appearance of the aerated foams containing HFBII and xanthan after storage at 5° C. are shown in FIGS. 7 and 8. It is clear that after extended storage time, using 0.5% xanthan as the thickening agent, bubble creaming is almost entirely inhibited and only slight phase separation can be seen. Using 0.4% xanthan, there is a greater (although still only small) amount of creaming. Using 0.3% xanthan, the apparent yield stress is not great enough to prevent creaming over the storage time. This particular product would not be acceptable (the level of serum separation noted at the bottom of the vial exceeds 10% after 3 weeks), whereas using 0.4 and 0.5% xanthan would be acceptable (level of serum was less than 10% after 3 weeks).
[0140] Accordingly, since the apparent yield stress of the continuous phase calculated above for 0.3, 0.4 and 0.5% xanthan is 2.8, 4.5 and 5.5 Pa, respectively, we have determined that the minimum apparent yield stress should be at least about 4 Pa.
Example
Example 2
Aerated Chocolate Milkshake
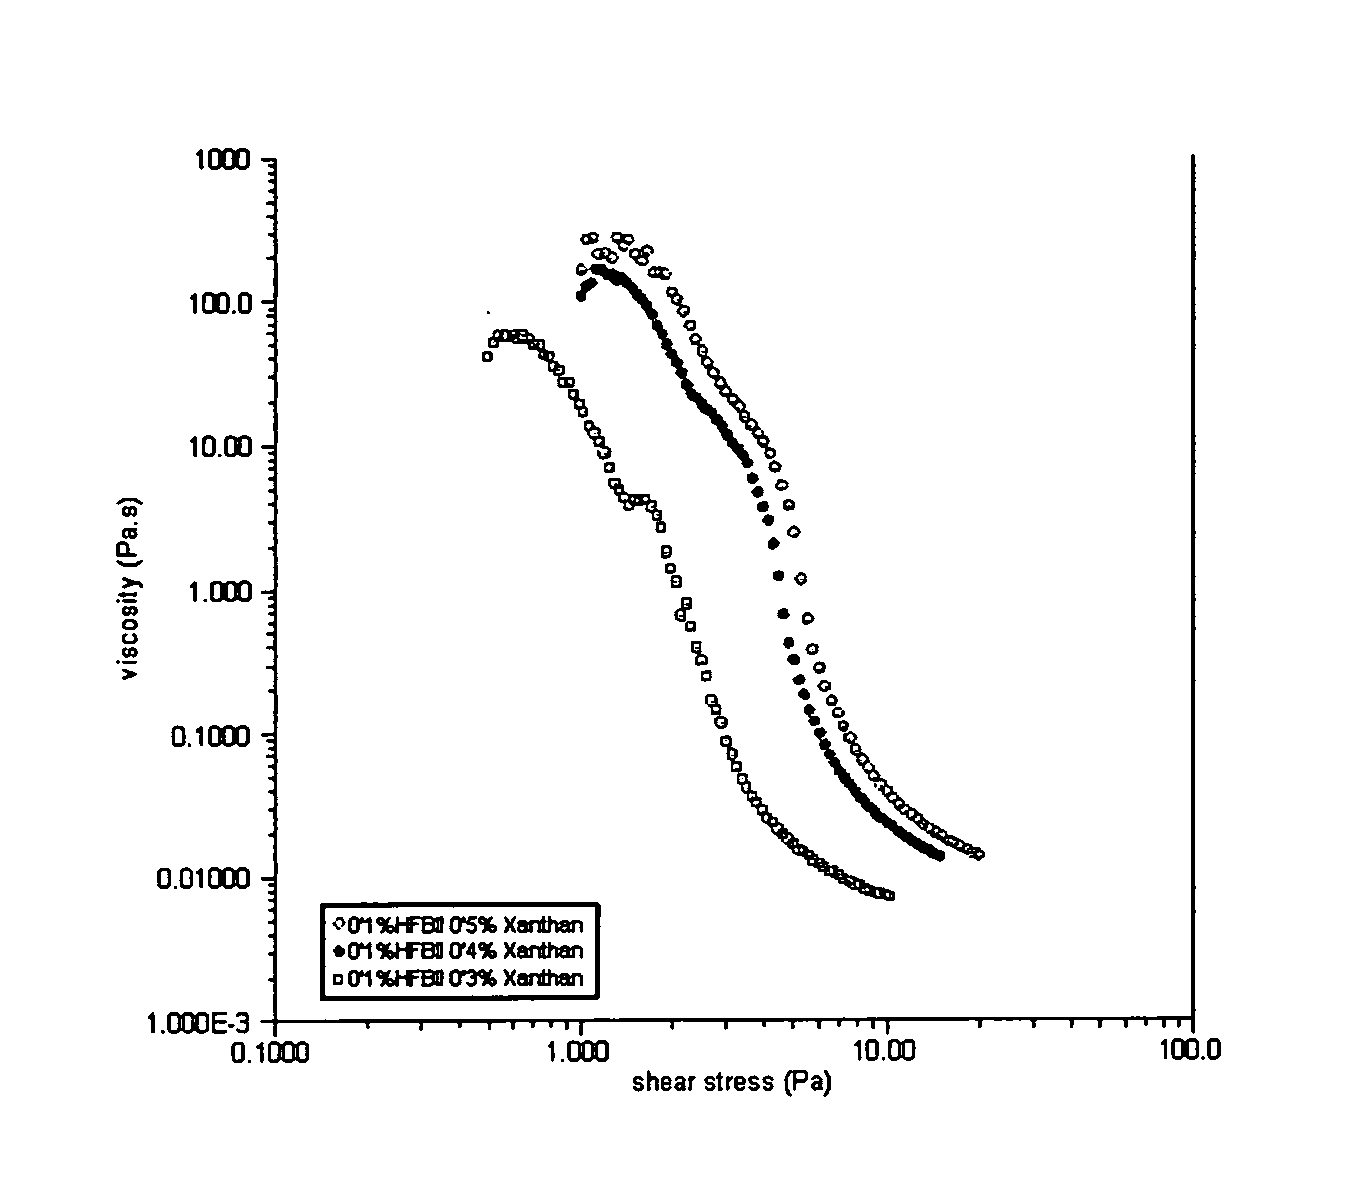
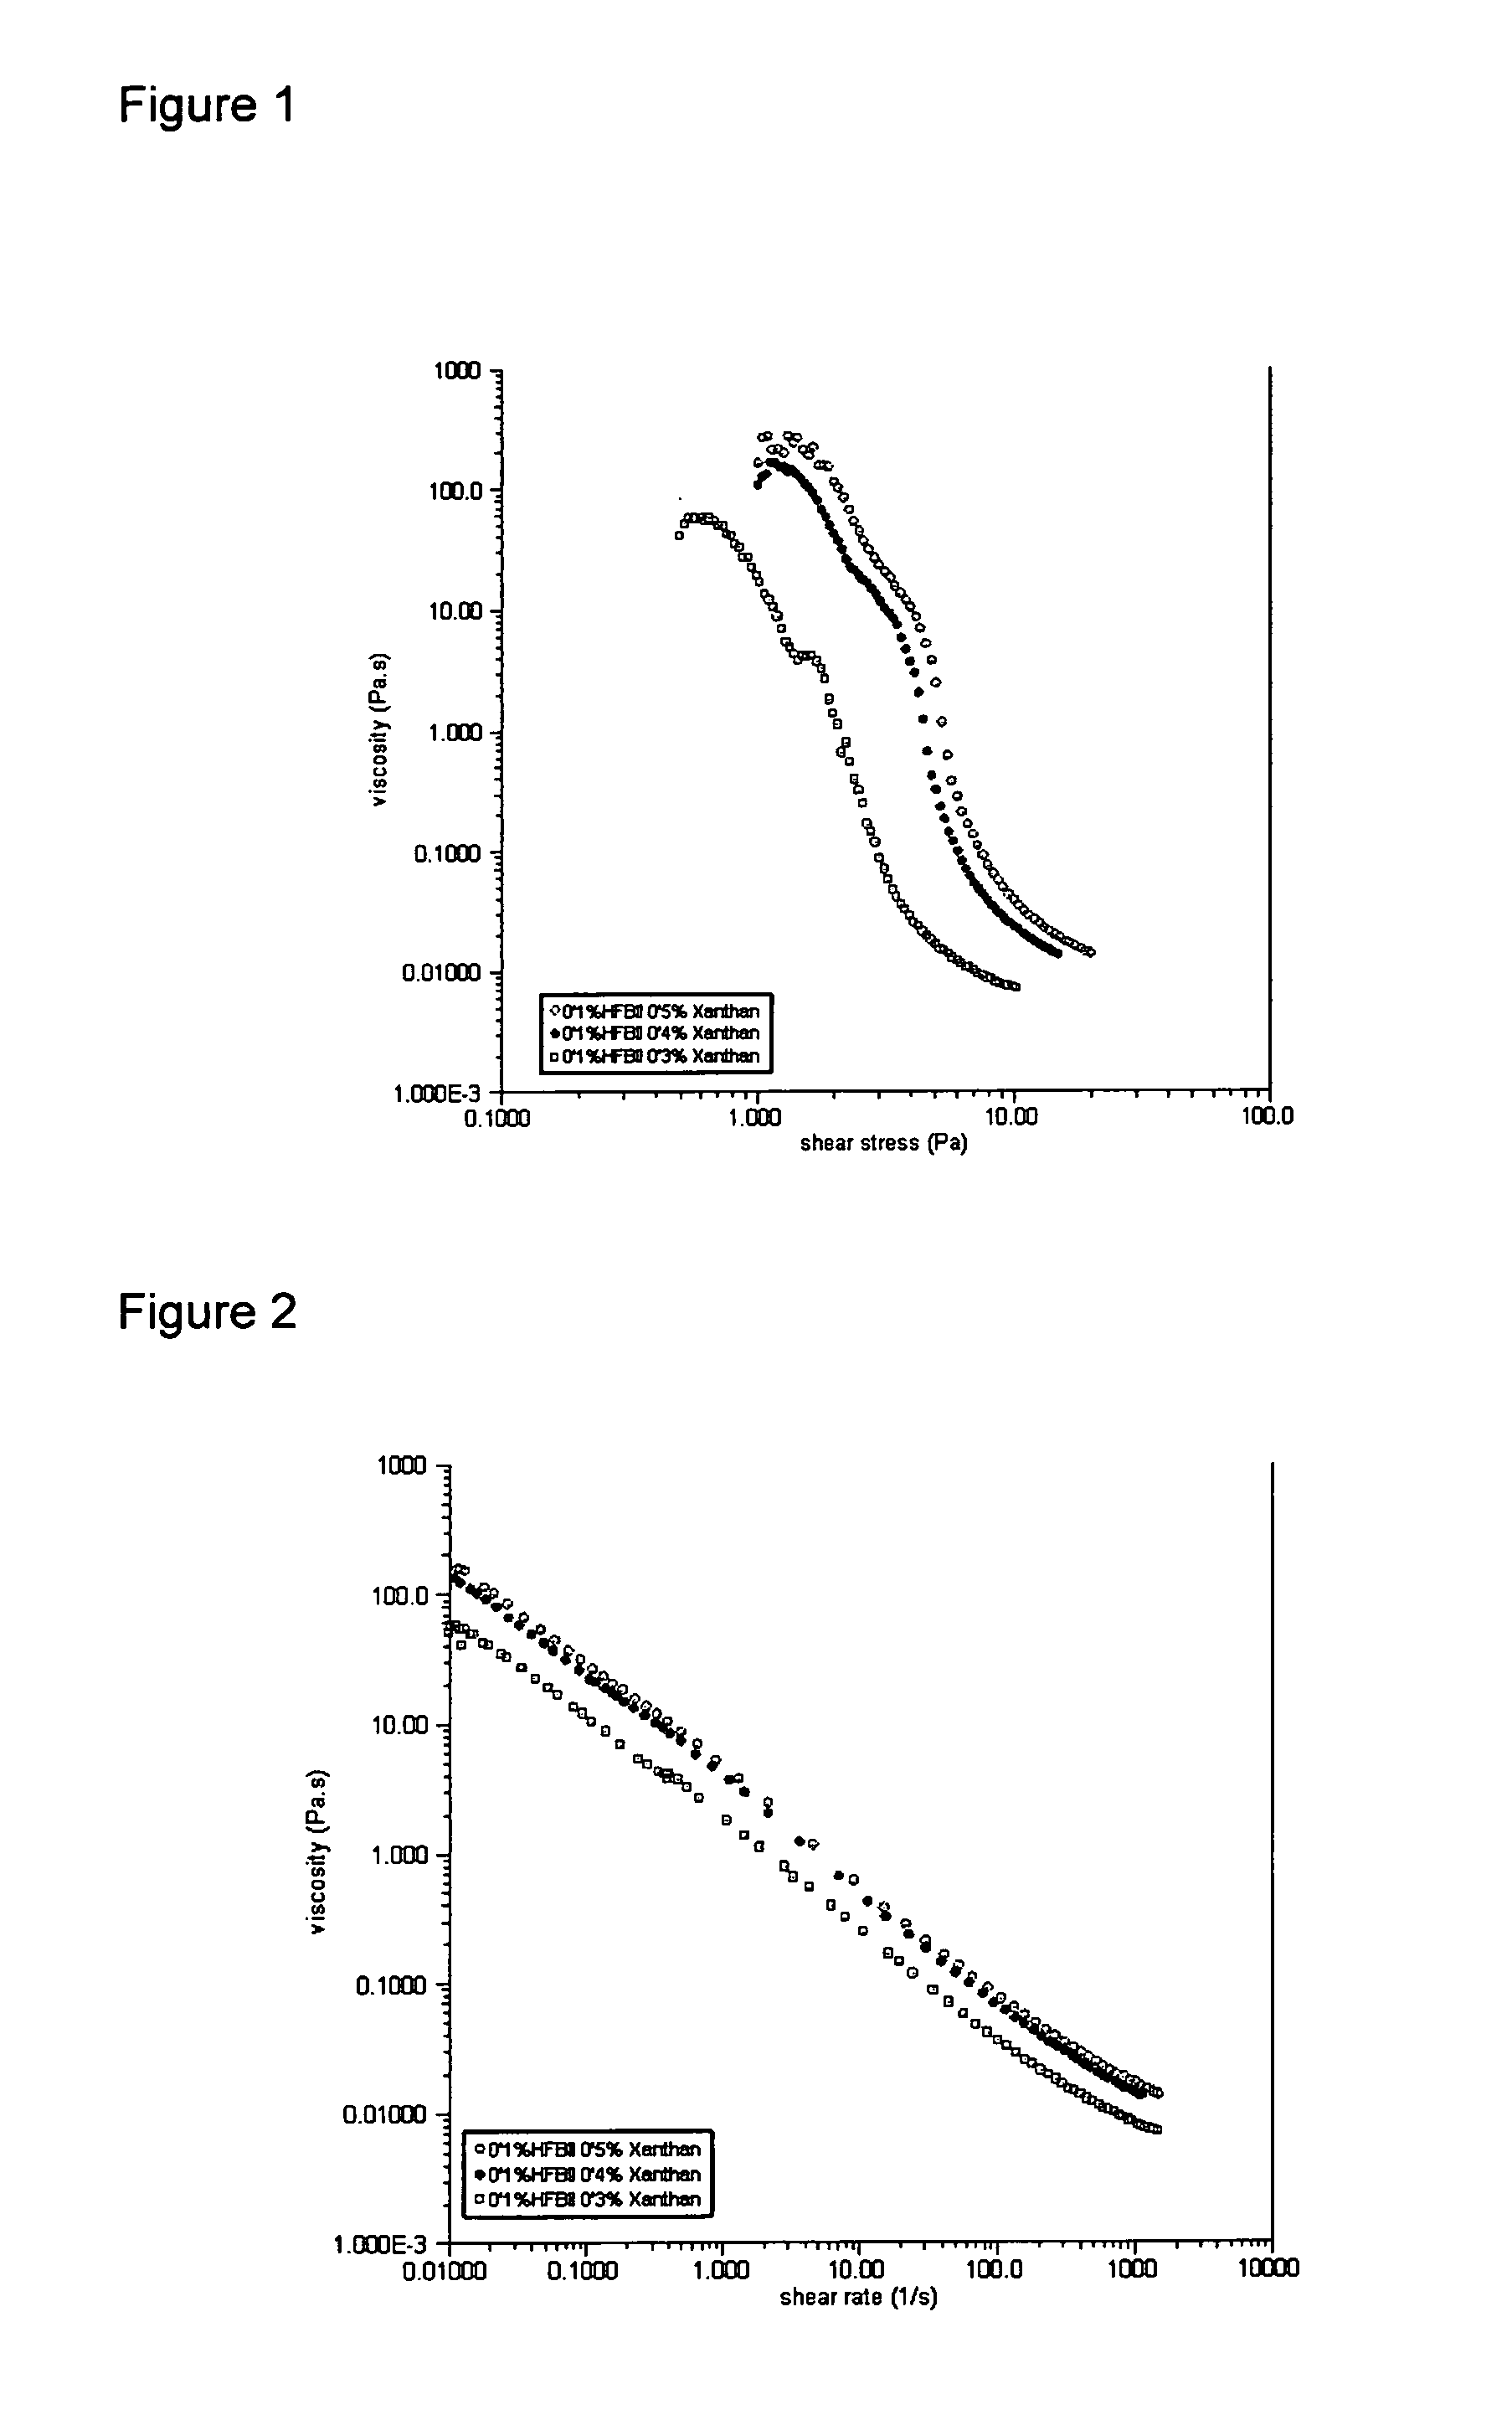
[0141] An aerated chocolate-flavoured milk shake was prepared as follows. A commercially available milkshake (Frijj™ Thick Fresh Milkshake produced by Dairy Crest Ltd, Shropshire, UK) was purchased. This is an unaerated product and, according to the ingredient list, contained: skimmed milk, whole milk, sugar, modified maize starch, fat reduced cocoa powder, buttermilk powder and stabilisers (carrageenan and guar gum). Xanthan gum was slowly added to the milk shake with stirring to a concentration of 0.5 wt %. This was then mixed for 20 minutes to allow the xanthan gum to hydrate fully. A known volume of 0.5 wt. % hydrophobin solution was aerated to 400% overrun using a hand held aerolatte™ device. This was added to the milk shake to give an aerated milkshake product with 100% overrun, an overall hydrophobin concentration of 0.1 wt % and an overall xanthan concentration of about 0.41 wt %. The aerated milkshake product was then stored at 5° C. and its stability monitored over a period of three weeks. FIG. 9 shows that after 3 weeks, the aerated milkshake product retained a stable air phase which did not cream or collapse and showed no significant bubble growth.
Example
Example 3
Aerated Fruit Smoothie
[0142] An aerated fruit smoothie was prepared using a Vie Shots™ drink, produced by Unilever UK as a fruit puree base. The Vie Shot™ contained: banana puree (28%), orange juice concentrate (26%), carrot juice concentrate (23%), pumpkin juice concentrate (14%), orange pulp (4%), lemon juice concentrate, acerola cherry concentrate (1.5%), and apple pectin. The pH was measured (at room temperature) to be 4.17. Xanthan gum was slowly added to the fruit puree with stirring to a concentration of 0.5 wt %. This was then mixed for 20 minutes to allow the xanthan gum to hydrate fully. A known volume of 0.5 wt. % hydrophobin solution was aerated to 400% overrun using a hand held aerolatte™ device. This was added to the fruit puree to give an aerated fruit smoothie product with approximately 100% overrun, an overall hydrophobin concentration of 0.1 wt % and an overall xanthan concentration of about 0.41 wt %. The aerated fruit smoothie product was then stored at 5° C. and its stability monitored over a period of three weeks. FIG. 10 shows that after 3 weeks the aerated fruit smoothie product retained a stable air phase and that no significant bubble growth or creaming occurred.
[0143] The various features and embodiments of the present invention, referred to in individual sections above apply, as appropriate, to other sections, mutatis mutandis. Consequently features specified in one section may be combined with features specified in other sections, as appropriate.
[0144] All publications mentioned in the above specification are herein incorporated by reference. Various modifications and variations of the described methods and products of the invention will be apparent to those skilled in the art without departing from the scope of the invention. Although the invention has been described in connection with specific preferred embodiments, it should be understood that the invention as claimed should not be unduly limited to such specific embodiments. Indeed, various modifications of the described modes for carrying out the invention which are apparent to those skilled in the relevant fields are intended to be within the scope of the following claims.
PUM


Description & Claims & Application Information
We can also present the details of the Description, Claims and Application information to help users get a comprehensive understanding of the technical details of the patent, such as background art, summary of invention, brief description of drawings, description of embodiments, and other original content. On the other hand, users can also determine the specific scope of protection of the technology through the list of claims; as well as understand the changes in the life cycle of the technology with the presentation of the patent timeline. Login to view more.
Similar technology patents
Fluorescent silver cluster, and preparation method and application thereof
Owner:SUZHOU INST OF NANO TECH & NANO BIONICS CHINESE ACEDEMY OF SCI
Method for deoxidizing iron base catalyst of Fisher-Tropsch synthesis in slurry bed
Owner:SYNFUELS CHINA TECH CO LTD
Preparation method of paper reinforcing agent
Owner:GUANGDONG PAPER IND RES INST
Automatic focusing method and automatic focusing device
Owner:ALTEK SEMICON
Automatic ship tracking method and system based on deep learning network and mean shift
Owner:ZHUHAI DAHENGQIN TECH DEV CO LTD
Classification and recommendation of technical efficacy words
- good stability
- excellent stability
Nano Anticancer Micelles of Vinca Alkaloids Entrapped in Polyethylene Glycolylated Phospholipids
Owner:BEIJING DIACRID MEDICAL TECH
Screw-driven lifting platform
Owner:TSANG LINGCHU
Alumina supporter and preparation method thereof
Owner:SHANXI UNIV
Digital inkjet thermal transfer printing water-based ink for textiles and preparation method of ink
Owner:HANGZHOU HIWETECH CHEM TECH CO LTD
High-speed rotation testing machine and method for testing high-speed rotation strength performance of rotor
Owner:HANGZHOU HAILUOMA SCI & TECH
Azomethine compound and oily magenta ink
Owner:FUJIFILM HLDG CORP
Tetracyclic compound
Owner:CHUGAI PHARMA CO LTD
Light emitting diode driver
Owner:VASTVIEW TECH
Catalyst for preparing hydrocarbon
Owner:KOREA RES INST OF CHEM TECH
Ink container and method of storing ink
Owner:SEIKO EPSON CORP