Laser peening for reducing hydrogen embrittlement
Active Publication Date: 2007-09-27
LAWRENCE LIVERMORE NAT SECURITY LLC +1
6 Cites 11 Cited by
AI-Extracted Technical Summary
Problems solved by technology
Penetration of hydrogen into metals initiates an embritt...
Benefits of technology
[0025] Experimental results generated by exposing treated and untreated samples to a dense hydrogen environment have shown that the samples treated with the present process of laser peening had a three times reduction in the transm...
Abstract
A laser peening process for the densification of metal surfaces and sub-layers and for changing surface chemical activities provides retardation of the up-take and penetration of atoms and molecules, particularly Hydrogen, which improves the lifetime of such laser peened metals. Penetration of hydrogen into metals initiates an embrittlement that leaves the material susceptible to cracking.
Application Domain
Laser beam welding apparatus
Technology Topic
EmbrittlementOptoelectronics +5
Image
Examples
- Experimental program(1)
Example
[0034] Deleterious effects due to hydrogen embrittlement can be significantly reduced by applying a process that densifies the material deeply beyond the surface, cutting off penetration paths for the hydrogen and at the same time induces compressive stress to retard propagation of cracks created locally by hydrogen induced internal flaws.
[0035] As such, a laser peening process that simultaneously induces residual stress and increases the density of the material as deeply as possible in the near surface material with minimal generation in intergranular disruptions will be the preferred approach to minimize the penetration of hydrogen. Consequently a laser peening process which peens with a long pulse (greater than 20 ns), with a large footprint (greater than 20 mm2 area) and with repeated applications (3 or more layers of peening) will have the best performance in retarding hydrogen penetration and thus hydrogen embrittlement.
[0036] Since the intense laser-generated shock front is the mechanism that compresses the material, a longer shock pulse enables this compression to run deeper before the rarefaction, due to the end of the laser pulse, catches up to the shock front and dissipates the peening action. A 20 ns pulse runs deeper than a 10 ns pulse and a 30 ns pulse would run even deeper yet. For hydrogen embrittlement applications, a 20 ns or longer pulse duration is effective.
[0037] Of equal importance to achieving a deep penetration of the compression is to perform the peening with a relatively large footprint. As the laser beam penetrates into the material it naturally diffracts and consequently loses intensity as the refraction penetrates into the beam center from the edges. As the compression shock wave penetrates into the material at the speed of sound, the refraction wave propagates in from the sides at essentially the speed of sound also. Thus, the larger the initial footprint of the laser, the deeper will be the penetration of the high intensity before rarefaction. In order to achieve a penetration of several millimeters, a beam with at least 16 J of energy was delivered to the metal and configured into a footprint of at least 3 mm on a side comprising a 9 mm2 spot area. Even larger spots using greater laser energy are preferred.
[0038] Multiple layers of peening can produce deeper levels of compression as a shock wave that is propagating through once compressed material will run faster and consequently with less rarefaction. Thus repeated processing of an area will result in deeper levels of compressed material and consequently greater resistance to hydrogen penetration. Thus, a process for reducing hydrogen embrittlement utilized three or more layers of peening each layer being a full coverage of the intended area. By using a processing beam that has a square or rectangular cross-section, peening areas next to each other with approximately 3% overlap of spots is achievable.
[0039] One exemplary test studied laser peening for the reduction in hydrogen permeation in a Titanium alloy. Three areas of study were conducted: laser peening the material, hydrogenation, and hydrogen detection. Of particular interest is the potential benefit for applications in deuterium and tritium production and storage. Equipment used in the production of these hydrogen isotopes often have finite service lives due to degradation by hydrogen penetration. Extending the lifetime would potentially have significant cost savings as well as implications for higher performance. Hydrogen embrittlement also will have significant impact as the USA moves to a hydrogen based fuel economy. This process could potentially improve fuel cell performance and could allow for safer and denser storage of hydrogen.
[0040] The particular Titanium alloy tested was Ti-6Al-4V double phase. One coupon was laser peened with a beam comprising a power density of 10 GW/cm2 at an 18 ns pulse width. Two layers of peening were applied to all sides of the coupon. This treatment is abbreviated: “10-18-2”.
[0041] Cathode charging process was performed on as-received and laser peened specimens. Each specimen was fully immersed in a vessel of a four-port electrochemical cell containing an aqueous electrolytic charging solution of 5% H2SO4 at ambient temperature. A precision power supply was connected by clip leads to the three electrodes and provided a constant, uniform exchange current density of 10 mA/cm2 onto the specimen over a charging duration of 144 hours.
[0042] The parameters for the secondary ion mass spectroscopy (SIMS) measurement are as follows: A pattern 250 μm×250 μm in size was rastered across the surface of the coupon, to a depth of 85 μm. The ions collected from this trace were compared with a standard reference material (352c) containing Hydrogen concentration of 49.0±0.9 μg/g in unalloyed Titanium. The trace made on the NIST standard material was assumed to be homogeneous.
[0043] Four main ions were recorded in each sample, 16O−, 1H1−, (48Ti+16O)−, and O3−. The scans of each coupon showed very consistent levels of each ion to the depth measured and the counts of each ion were consistent over each scanned volume. This shows the material to be fairly uniform in the region measured, allowing a fair comparison of each ion concentration between the two samples.
[0044] The data showed the recorded ion counts for each ion measured. When compared to the standard, our samples showed almost ten times the ratio of H1− ions as compared to the standard, or roughly 490 μg/g. This demonstrates our ability to measure the H content in our Ti-6Al-4V material and quantify its concentration. Since we wanted to compare the H embedding depth in laser peened (LP) versus non-laser peened (nonLP) samples, our next step was to measure three coupons with various treatments using a step scan method.
[0045] For this test on Titanium, the step-scans performed on the H-Charged (HC) and the laser peened plus H-Charged (LP+HC) suggest the hydrogen to Titanium ratio (H—Ti) was roughly constant through the sample. The data shows that the laser peened plus H-Charged (LP+HC) sample contained significantly less hydrogen than the otherwise identical non laser peened sample. Specifically the LP+HC sample contained roughly the same hydrogen content as the uncharged samples; whereas the HC coupon contained roughly three times the background level of hydrogen.
[0046] Another exemplary test studied the effects of laser peening on hydrogen permeation behavior in austenitic 3161 stainless steel. Before fully investigating the effects of laser peening on the problems of hydrogen embrittlement, it is important to first understand the migration behavior of hydrogen when it is diffused into the material and what impacts are generated from laser peening on the diffusion behavior. Thus in light of interests and as an attempt to clarify the uncertainties, an initial experiment was been performed to explore the effects of laser peening on hydrogen diffusion behavior in the austenitic stainless steel by comparing the hydrogen concentration of peened and non laser peened samples exposed to hydrogen-rich environments.
[0047] In the study of the effect of laser peening on the hydrogenation of austenitic stainless steel, three steps were taken: laser peening, hydrogenation, and hydrogen detection. The basic physics and theories behind laser peening are well understood and have been presented. See, e.g., J. E. Rankin, M. R. Hill, L. A. Hackel, Material Science and Engineering, A00 (2003) 1-13; and G. Hammersley, L. A. Hackel, F. Harris, Optics & Lasers in Engineering, 34 (2000) 327-337. Until now, however, the laser peening parameters required to effectively retard uptake of Hydrogen were unknown.
[0048] Hydrogenation is a hydrogen absorption process in which hydrogen atoms are cathodically charged and uploaded into a metal sample. The sample essentially behaves as an “ionic sink” in which a supplied current donates e− into the metal, making it an attractive “sponge” for the positive ions. The H+ ion in the solution will then be attracted to the metal e− due to the charge balance for neutralization. When two hydrogen H+ ions combine with the metal e−, a H2 atom is formed. See, e.g., A. Valiente, L. Caballero, J. Ruiz, Nuclear Engineering and Design, 188 (1999) 203-216. The deposition process can be described as
2H++2e−→H2. (1)
[0049] For diffusion to occur into the material, a majority of the H2 atoms must permeate through the surface of the metal and into interstitial lattice sites or through microstructural channels and remain trapped inside the metal. See, e.g., G. M. Fontana, N. D. Greene, Corrosion Engineering 2nd Ed. McGraw Hill (1978) 109-115, 301-303.
[0050] Several hydrogen detection techniques have been proposed in literature (e.g., electrochemical permeation, Gorsky relaxation, gas permeation, internal friction measurements, etc). See, e.g., R. Balasubramaniam, Journal of Alloys and Compounds, 293-295 (1999) 279-281. However, a simpler method of subsurface Vickers microhardness profiling proposed by Balasubramaniam et al. was utilized in place of other complex techniques for this work. See, e.g., P. Kumar, R. Balasubramaniam, Journal of Alloys and Compounds, 255 (1997) 130-134. Studies have demonstrated the usefulness of this method for determining hydrogen diffusivities in several materials (e.g., Al—Li alloys, austenitic stainless steels, and several iron aluminides). The motivations for employing this method are based on the direct correlation of the behavior of microhardness and of hydrogen concentration, which is derived from Fick's Second Law of Diffusion, and the availability of equipment to carry out the method.
[0051] Assume the hydrogen transport is a non-steady state diffusion mechanism through the interstitial lattice of material at ambient temperature; Fick's Second Law of Diffusion states: ∂ C H ( x , t ) ∂ t = D H ∂ 2 C H ( x , t ) ∂ x 2 , ( 2 )
where CH(x, t) is the function of hydrogen concentration in terms of diffusion depth x(μm), and time t(s). DH is the intrinsic diffusivity or diffusion coefficient of hydrogen for the sample material in the conditions of the experiment See, e.g., D. A. Porter, K. E. Easterling, Phase Transformations in Metals and Alloys 2nd Ed., Chapman & Hall, UK, 1992, pp. 73-74. Solving equation (2) with boundary conditions: CH(x=0, t)=Cs and CH(x, t=∞)=Cb, where Cs is the concentration at the surface and Cb is the bulk concentration in the sample yields: C ( x , t ) = C s - ( C s - C b ) erf ( x 2 D H t ) or ( 3 ) C ( x , t ) - C b C s - C b = 1 - erf ( x 2 D H t ) . ( 4 )
[0052] In order to correlate microhardness profile with concentration profile of the diffusing species, four reasonable assumptions were made. First, the variation in microhardness with depth for the as-received (uncharged, non laser peened) specimen is constant Second, C(x, t)−Cb is proportional to the increase in MHv over the bulk value, i.e., (MHv−MHVb). Third, the diffusion process only occurs through a single phase; there was no internal phase transformation in the diffusion field. Fourth, the diffusion coefficient was constant in the entire diffusion zone. Based on the assumptions, a dimensionless correlation can be obtained as: C ( x , t ) - C b C s - C b = MHv ( x , t ) - MHv b MHv s - MHv b ( 5 )
where MHvs is the microhardness value at the near surface of the specimen and is the microhardness at the bulk of the material. Substitute equation (4) into (5), the direct correlation of microhardness and diffusivity coefficient is obtained. This equation will be the basis for modeling the hydrogen distribution by the microhardness distribution as a function of depth from the surface and into the bulk of the material: MHv ( x , t ) - MHv b MHv s - MHv b = 1 - erf ( x 2 D H t ) . ( 6 )
[0053] The as-received AISI 316L austenitic stainless steel (solution annealed 1900° F. and water quenched) was sectioned, using wire EDM, into 25.4 mm by 25.4 mm and 6.35 mm thick square samples. All surfaces of the samples were ground up to 600-grit finish to maintain a uniform surface finish.
[0054] Residual stress experiments were performed for optimizing the peening parameters to obtain the highest and deepest residual stress in 316L stainless steel. The peening parameters that were selected include an irradiance of 10 GW/cm2, a pulse width of 18 ns, 2 peening layers, 3.0 mm average peening spot size, and a 50% spatial offset, or “overlap” from one peening layer to another (10-18-2-50%). Laser peening was applied, with these parameters, on all 6 surfaces of the samples.
[0055] Cathodic charging was performed on the as-received and laser peened specimens. Each specimen was fully immersed in a vessel of a four-port electrochemical cell containing an aqueous electrolytic charging solution of 5% H2SO4 at ambient temperature. The vessel was partially immersed in a Dow Corning 200 silicone oil bath in a thermostat unit to maintain a constant test solution temperature. The test cell used a platinum counter electrode, a Luggin probe to position the Ag/AgCl reference electrode in a water-cooled jacket away from the test solution, an aerator (gas bubbler) to purge the test solution with nitrogen gas or air, and a condenser column to keep the bath from evaporating during the test. The specimen was suspended in the bath through the larger central port. A precision power supply or potentiostat with the capability of 300 mA was connected by clip leads to the three electrodes and provided a constant, uniform exchange current density of 10 mA/cm2 onto the specimen over a charging duration of 144 hours.
[0056] After cathodic charging, all specimens: as-received, peened, non laser peened and hydrogenated, and laser peened and hydrogenated were sectioned at half length and through the thickness of the specimen using a precision saw. The sectioned pieces were then immediately mounted in a cold setting epoxy resin such that the cross-sectional surfaces of the specimens were exposed. The exposed surfaces were mechanically polished to a 0.05 μm surface finish.
[0057] Subsurface microhardness (MHv) profiling was performed using a Leitz Wetzlar Metallux 3 Vickers Microhardness Tester (equipped with a diamond indenter and an optical microscope of 500× magnification) on the exposed cross-sectional surfaces of the as-received, peened, hydrogenated, and peened and hydrogenated specimens. An indentation load of 100 gf was applied, over a dwell time of 10 seconds, for each indent. The diagonals of each indent were measured from the attached optical microscope and the microhardness values were calculated using the formula: MHv = 2000 P sin ( α / 2 ) d 2 = 1854.4 P d 2 , ( 7 )
where d is the mean diagonal of the indentation (μm), P is the applied load (gf), and α is the face angle of the indenter (136°). Starting from approximately 40 μm deep from the free surface (xz plane) as to eliminate the surface effect, the microhardness values were obtained at the location of x=z=0 and y from −40 μm to the opposite edge (through thickness) of the disk specimen. Profiles were taken at such location is to avoid the possible effects of laser peening induced residual stress from the vertical surfaces in the x-direction and z-direction.
[0058] To ensure a higher hydrogen detection resolution, indent spacing was adjusted according to each of the four specimen conditions. In general, a minimal indent spacing of 2.5d should be applied to minimize measurement errors caused by indent distortion due to both elastic and plastic deformation and a strain field around each indent. For the laser-peened specimens, the averaged d was recorded to be approximately 32 μm and thus, an indent spacing of 100 μm (3.12d indent spacing) through the thickness of the specimen was applied. For the hydrogenated specimens and higher detection resolution is desired, the average d was recorded as 27.5 μm and an indent spacing of 50 μm (1.8d indent spacing) within the first and last 500 μm of the thickness and 100 μm of spacing in between was applied. Two profiles as both functions of microhardness value and depth of sample were averaged and interpolated to account for non-hydrogen related microstructural variations and to obtain a more accurate data.
[0059] The averaged subsurface microhardness profiles of 316L stainless steel for all 4 specimen conditions: as-received, as-received and hydrogen charged, as-received and laser peened, laser peened and hydrogen charged were obtained. The maximum scatter for microhardness measurement was ±5 MHv. Such scatter was calculated from repeatedly measuring the exact microhardness indent for 5 times of each profile and recording the maximum deviation from the average microhardness value of the 5 measurements.
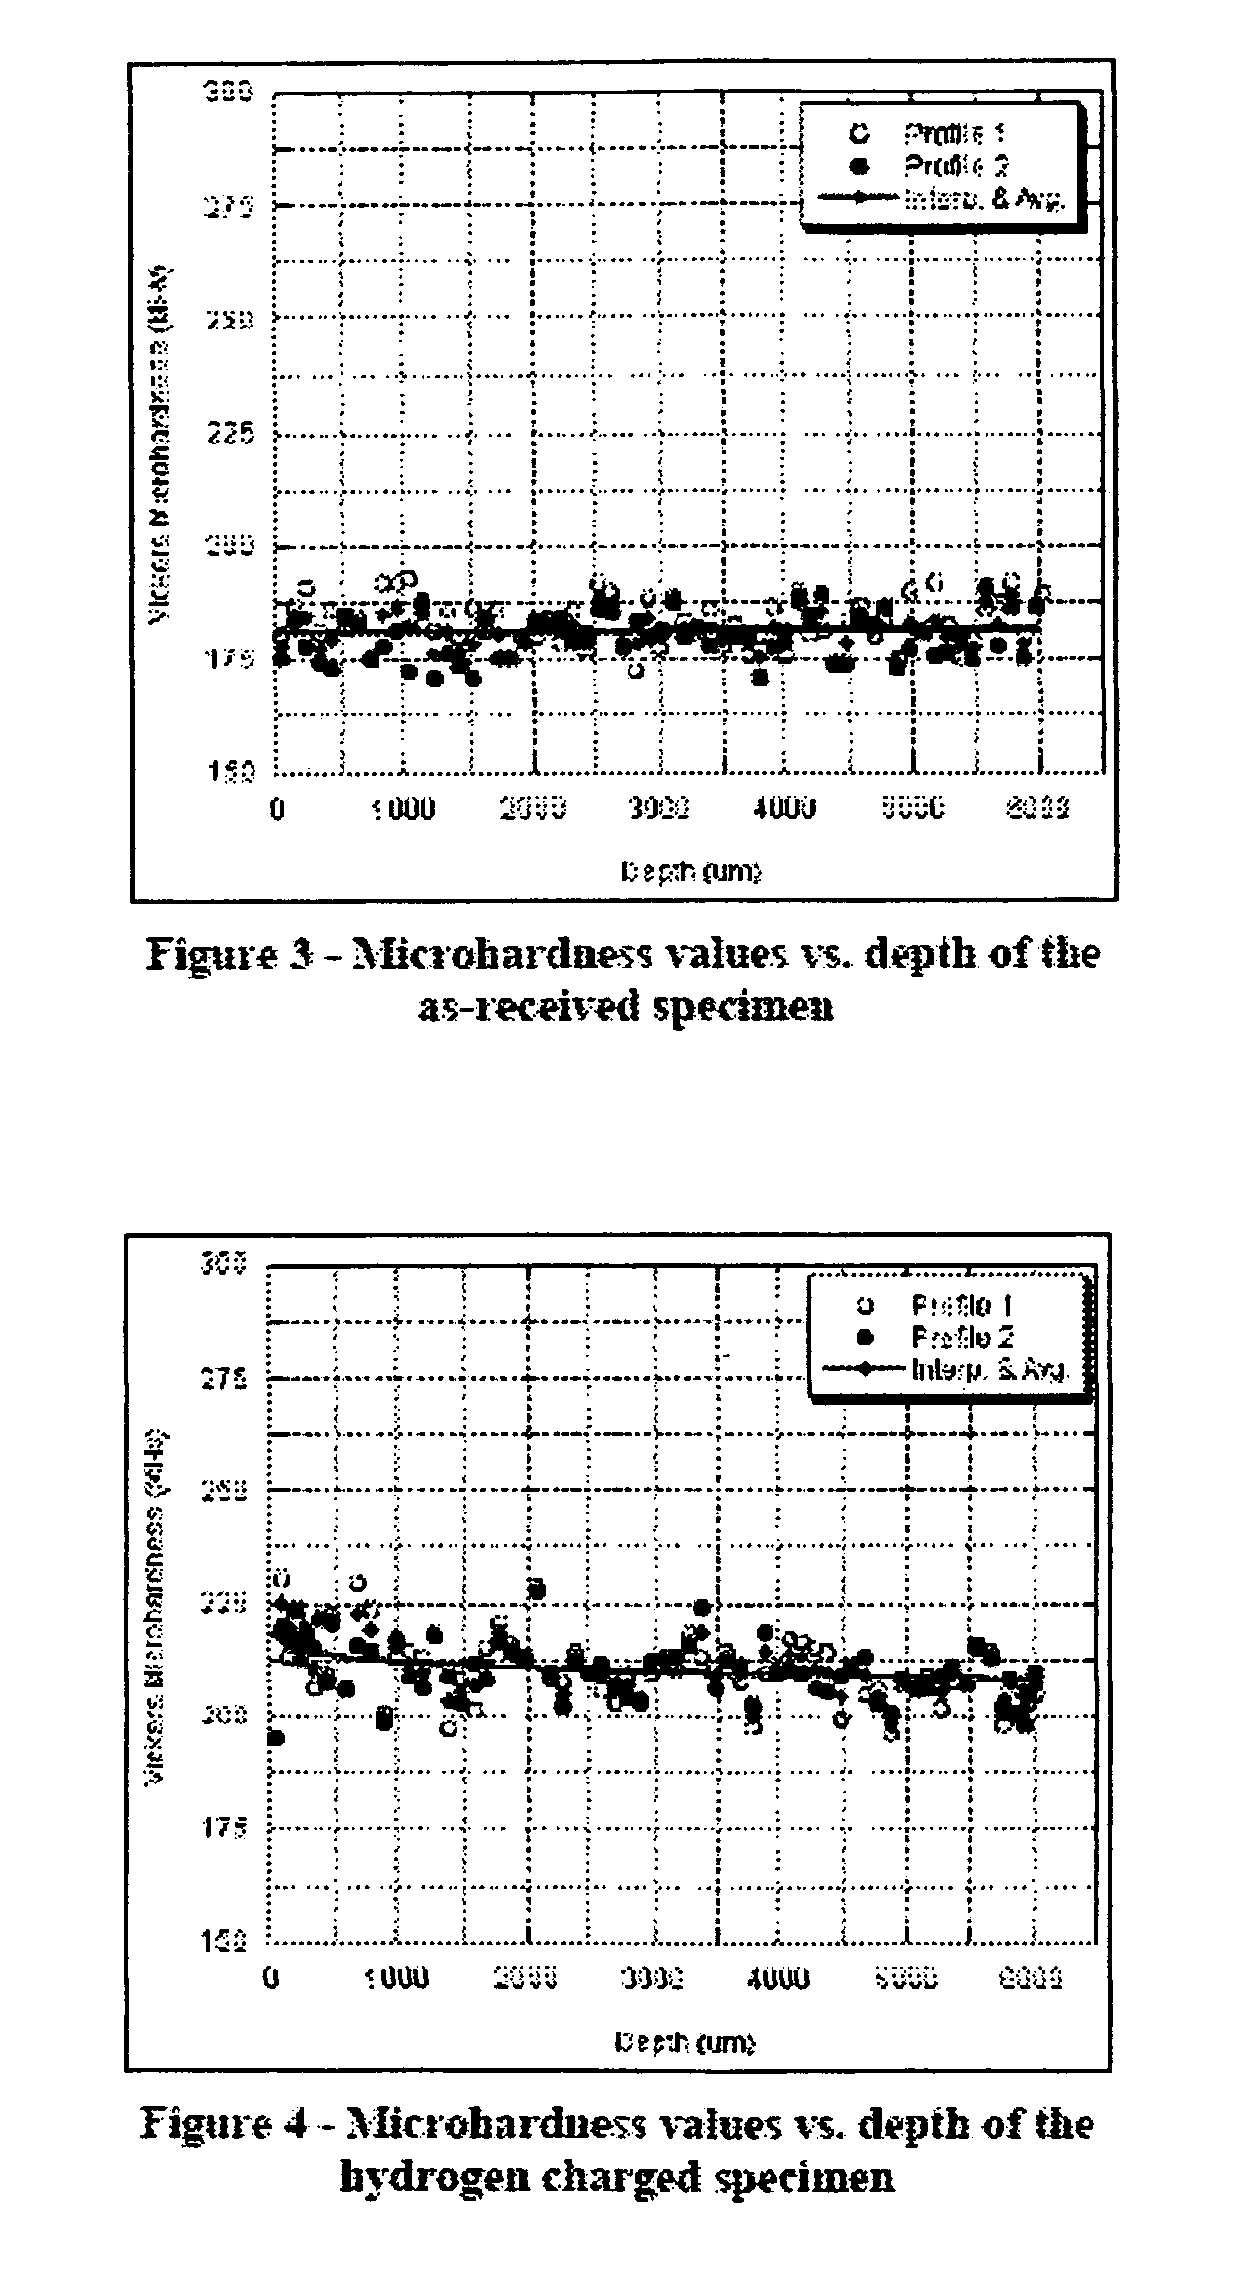
[0060] The as-received MHv data was obtained as a basis value for comparison (FIG. 3). It also serves to validate the assumption of constant microhardness values from surface to bulk for the untreated (unpeened and uncharged) specimen. As measured, the averaged microhardness value was found to be approximately 181 MHv and the values are fairly constant throughout the thickness of the specimen. A linear line fit of the data was also included to better represent the MHv data trend.
[0061] The MHv profiles for the hydrogen charged specimen were obtained (FIG. 4). A through-thickness hardening effect was observed. Microhardness value of approximately 223 MHv was recorded at near surface and the profile then gently decreased to a plateau value of approximately 210 MHv through the thickness of the specimen. Overall a 30-40 MHv increase from the values obtained from the as-received specimen. A logarithmic line fit was also applied to better represent the MHv data trend.
[0062] The MHv profiles for the laser peened specimen were obtained (FIG. 5). The data looks fairly symmetrical across the thickness of the specimen. The concavity falls right in the half thickness of the specimen. At near surface, the MHv value was found to be approximately 280 MHv and at near half thickness, the MHv value was approximately 205 MHv. Thus a ˜75 MHv difference from the surface to the bulk of the material was observed. The depth of the work-hardening effect from laser peening is found to be approximately 3 mm deep into the specimen. A polynomial line fit was included to better represent the MHv data trend.
[0063] The MHv profiles for the laser peened and hydrogenated specimen were obtained (FIG. 6). The data again looks fairly symmetrical across the thickness of the specimen. Similar to the laser-peened specimen, the concavity falls right in the half thickness of specimen. At near surface, the MHv value was found to be approximately 290 MHv and at near half thickness, the MHv value was approximately 205 MHv. Thus a ˜85 MHv difference from the surface to the bulk of the material was observed. A polynomial line fit was also included to better represent the MHv data trend.
[0064] A plot of the MHv data as a function of the normalized depth (z/t where t is the thickness of the specimen) for all four of the specimen conditions is presented for the purpose of an overall comparison (FIG. 7). Looking at the hydrogenated and as-received data, an increase of approximately 30-40 MHv through thickness was observed from the hydrogenated specimen. In comparing the laser peened and laser peened and hydrogenated data, the two profiles seem to be fairly similar. The microhardness at near the two surfaces are almost identical but at near the half thickness (x/t=0.5) of the specimen, the microhardness of the laser-peened specimen is about 4 MHv lower than the value of the laser peened and hydrogenated specimen. But overall, the two profiles show a very similar behavior throughout the thickness of the specimen.
[0065] In comparing the microhardness data of the laser peened specimen and the laser peened and hydrogenated specimen, no distinct differences are found (FIG. 7). The initial microhardness values at near surface for the two specimens are relatively identical (280 to 290 MHv) and at near the half thickness (z/t=0.5) of the specimen, the microhardness of the laser peened specimen (˜201 MHv) is about 4 MHv lower than the value of the laser peened and hydrogenated specimen (˜205 MHv). Nevertheless, the overall behaviors of the two profiles are fairly similar.
[0066] The foregoing description of the invention has been presented for purposes of illustration and description and is not intended to be exhaustive or to limit the invention to the precise form disclosed. Many modifications and variations are possible in light of the above teaching. The embodiments disclosed were meant only to explain the principles of the invention and its practical application to thereby enable others skilled in the art to best use the invention in various embodiments and with various modifications suited to the particular use contemplated. The scope of the invention is to be defined by the following claims.
PUM
Property | Measurement | Unit |
Length | 0.003 | m |
Length | 0.0047 | m |
Fraction | 0.5 | fraction |
Description & Claims & Application Information
We can also present the details of the Description, Claims and Application information to help users get a comprehensive understanding of the technical details of the patent, such as background art, summary of invention, brief description of drawings, description of embodiments, and other original content. On the other hand, users can also determine the specific scope of protection of the technology through the list of claims; as well as understand the changes in the life cycle of the technology with the presentation of the patent timeline. Login to view more.
Similar technology patents
Integrated control method of tobacco viruses
InactiveCN108402044Areduce transmissionImproving Resistance Against Tobacco Virus Disease
Owner:四川省烟草公司广元市公司 +1
Webpage refreshing method, webpage refreshing system and related device
ActiveCN113407876Areduce transmissionImprove loading time
Owner:HANGZHOU ANHENG INFORMATION TECH CO LTD
Multiple hydraulic circuit pressure sensor
InactiveUS20130036826A1reduce transmissionlower CO2 emission
Owner:DELPHI TECH INC
Electrical high-pressure discharge lamp for cosmetic skin treatment
Owner:HERAEUS NOBLELIGHT GMBH
Classification and recommendation of technical efficacy words
- reduce effect
- reduce transmission
Magnetic resonance imaging interference immune device
Owner:MEDTRONIC INC
Method and device for detecting touch pad unit
Owner:WSOU INVESTMENTS LLC
Communication apparatus and communication method
Owner:SUN PATENT TRUST
Integrated low noise amplifier and balun for MRI receivers
ActiveUS7378851B1reduce transmission
Owner:GENERAL ELECTRIC CO
Method for detecting address conflict when distributing IP address
InactiveCN101355594Areduce transmissionImprove distribution efficiency
Owner:ZTE CORP
Cage chicken health condition automatic monitoring ball wheel trolley and monitoring method
InactiveCN108154097Areduce transmissionavoid major outbreaks
Owner:ZHONGBEI UNIV