
Real Time Microarrays

a microarray and real-time technology, applied in the field of real-time microarrays, can solve the problems of the inability to predict the exact nature of the data, and the inability to accurately predict the data, etc., and achieve the effect of suppressing the effects of cross-hybridization

Active Publication Date: 2008-02-14
CALIFORNIA INST OF TECH
View PDF42 Cites 100 Cited by
  • Summary
  • Abstract
  • Description
  • Claims
  • Application Information

AI Technical Summary

Benefits of technology

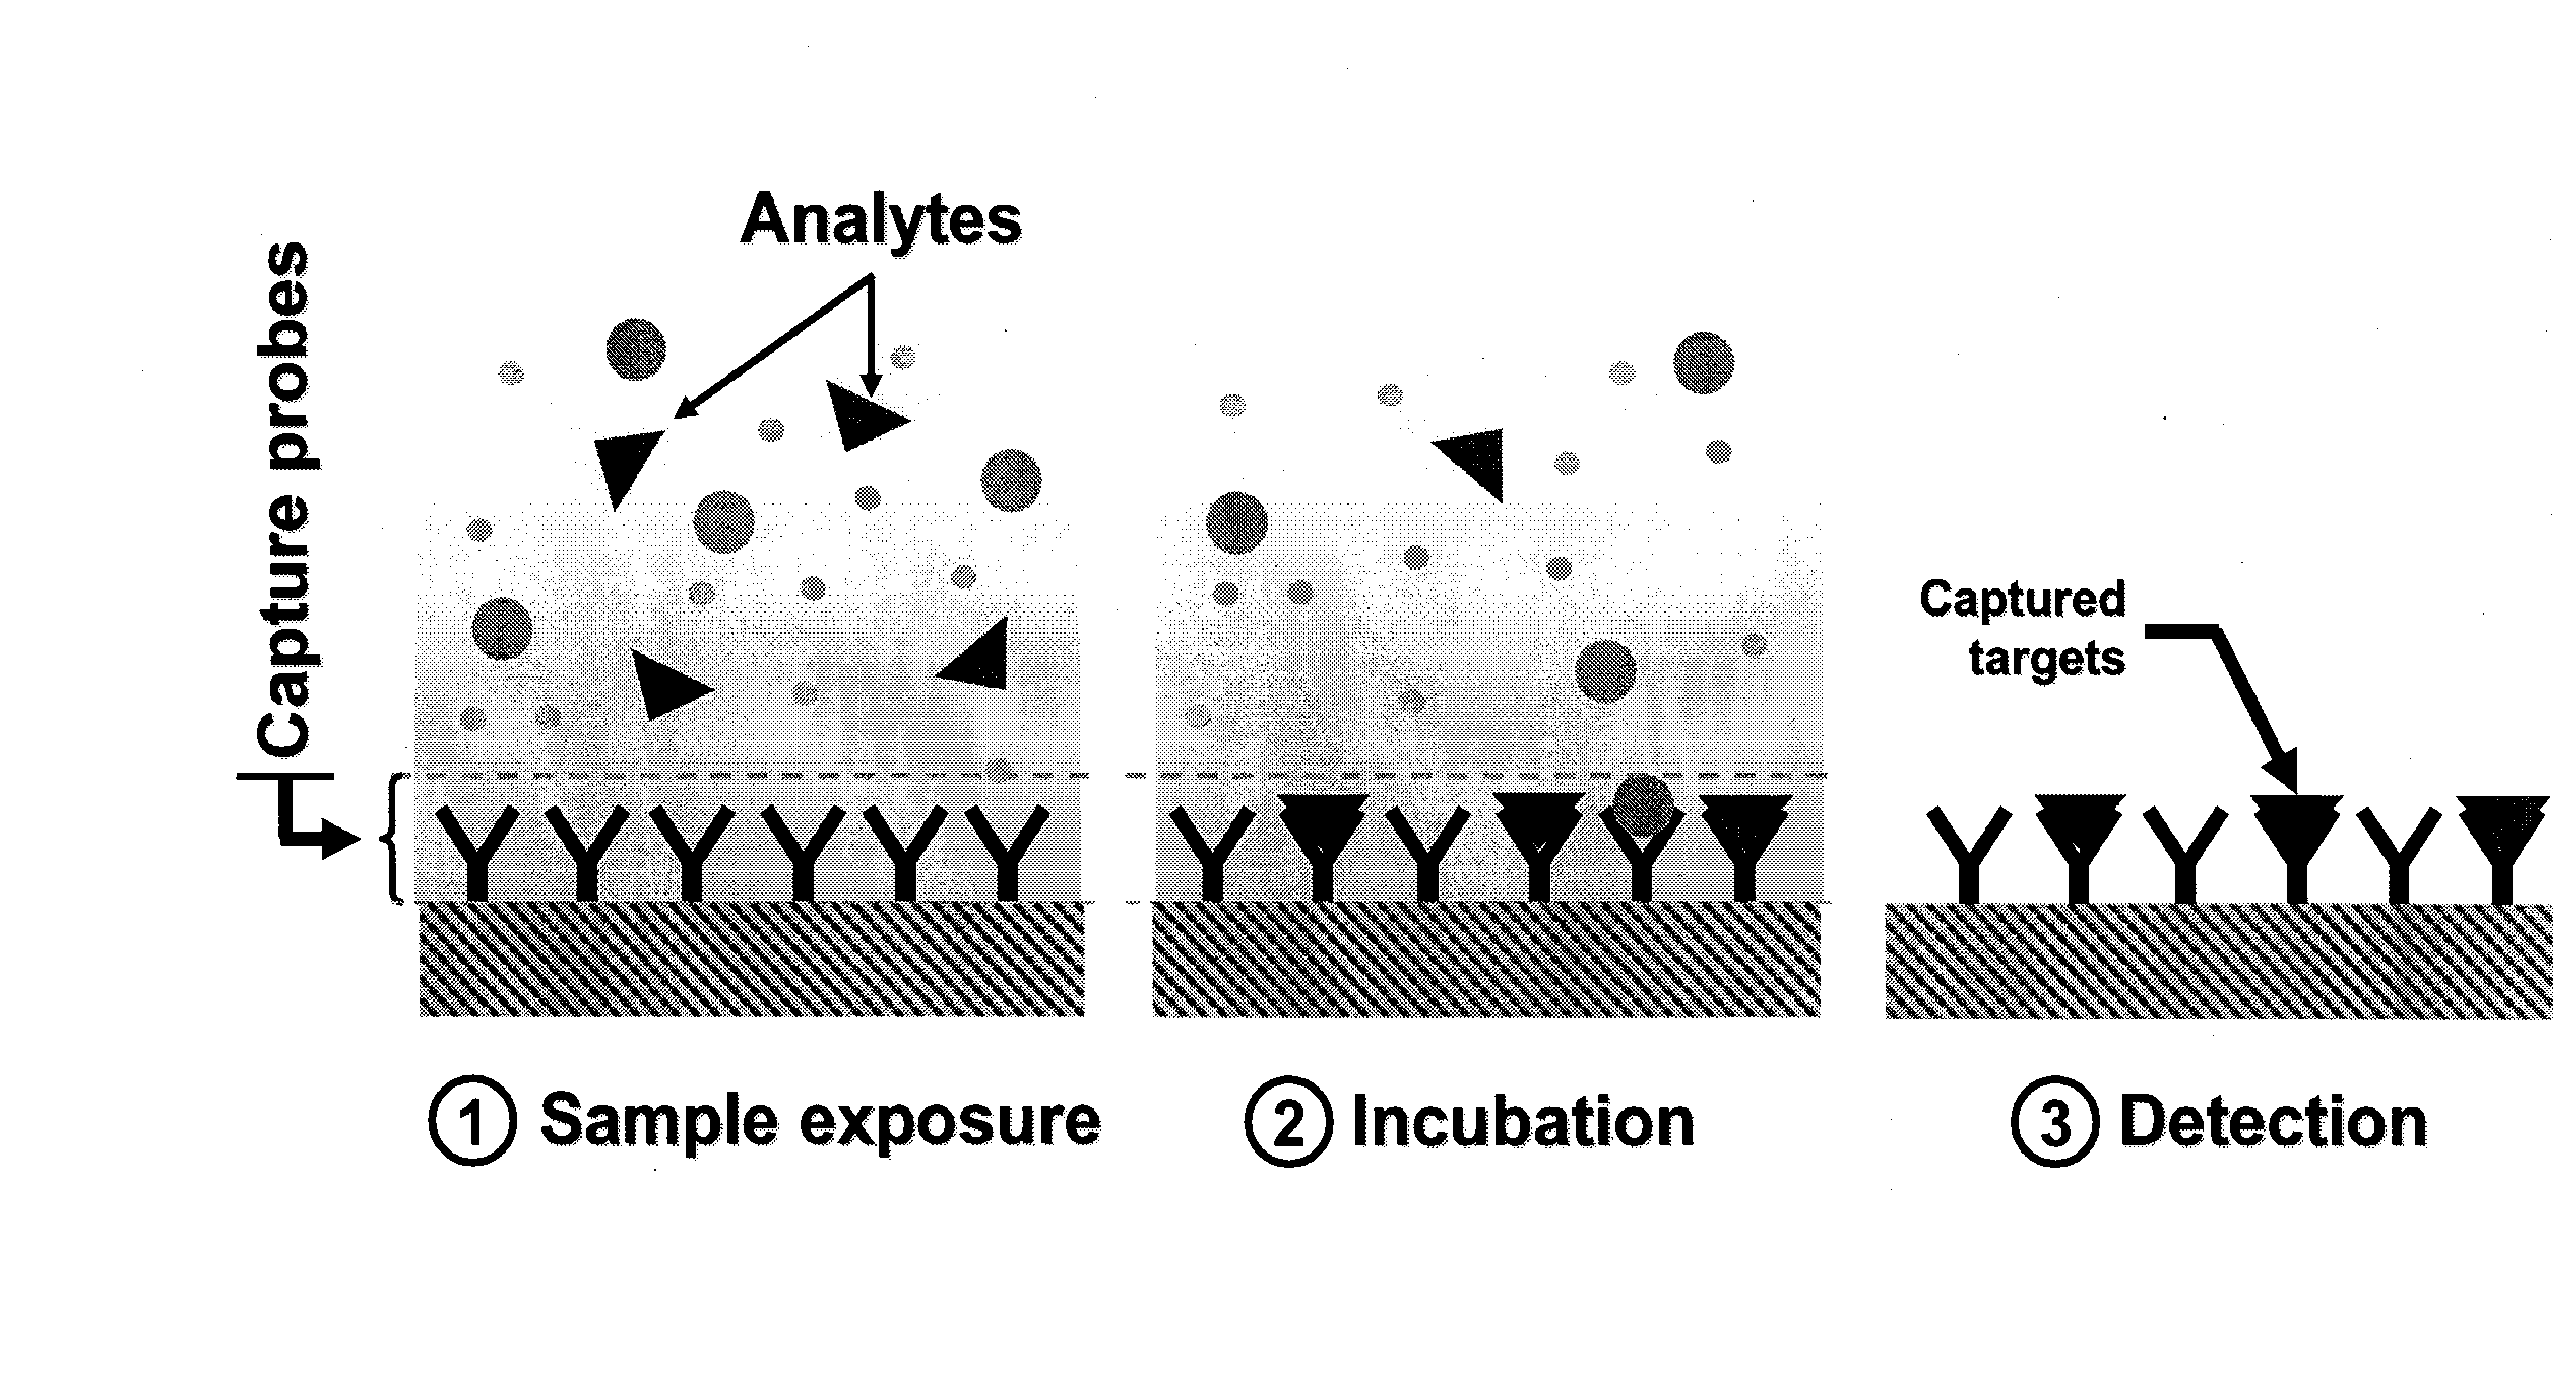
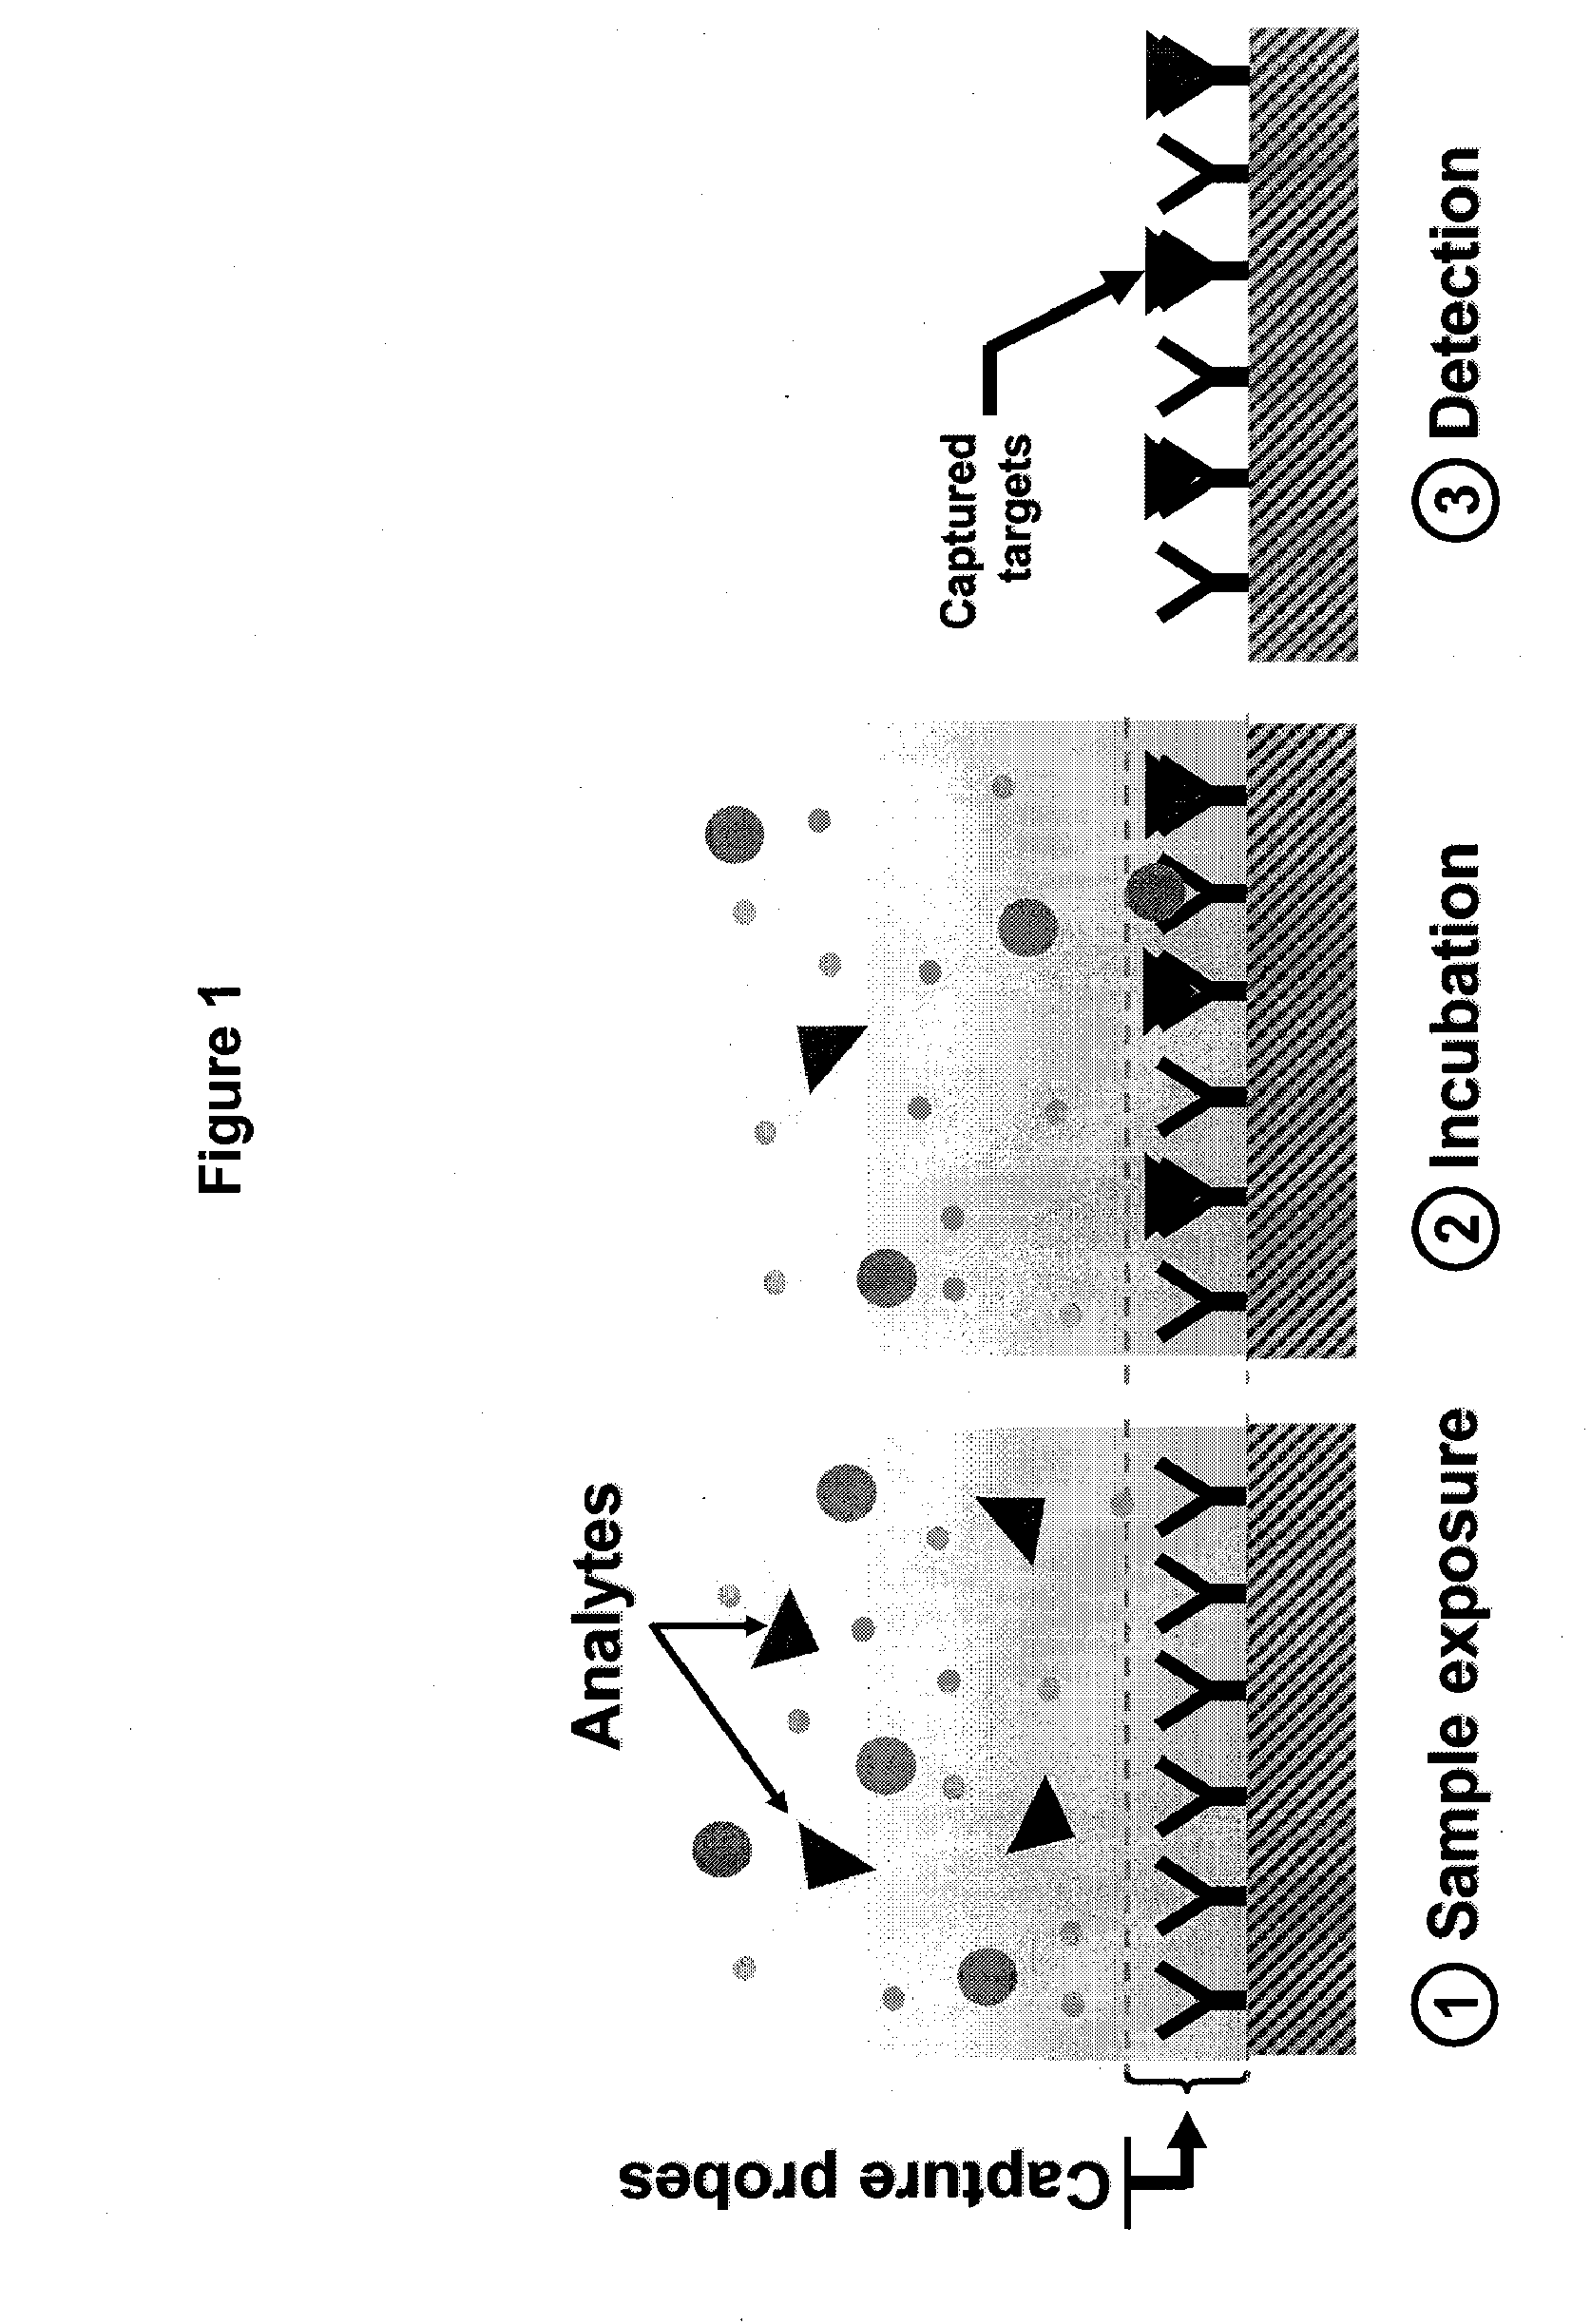
The patent describes a method for measuring the binding of analytes to probes on a microarray in real-time. The method involves contacting a fluid volume containing the analytes with the probes on a solid substrate, and measuring signals at multiple time points. The signals measured at different time points can be correlated with the amount of binding of the analytes to the probes. The method can be used to detect and quantify the concentration of analytes in the fluid. The analytes can be nucleic acid molecules labeled with a quencher, and the probes can be nucleic acid molecules or other molecules such as carbohydrates or lipids. The method can also involve using multiple fluorescent species or quencher species to measure the binding.

Problems solved by technology

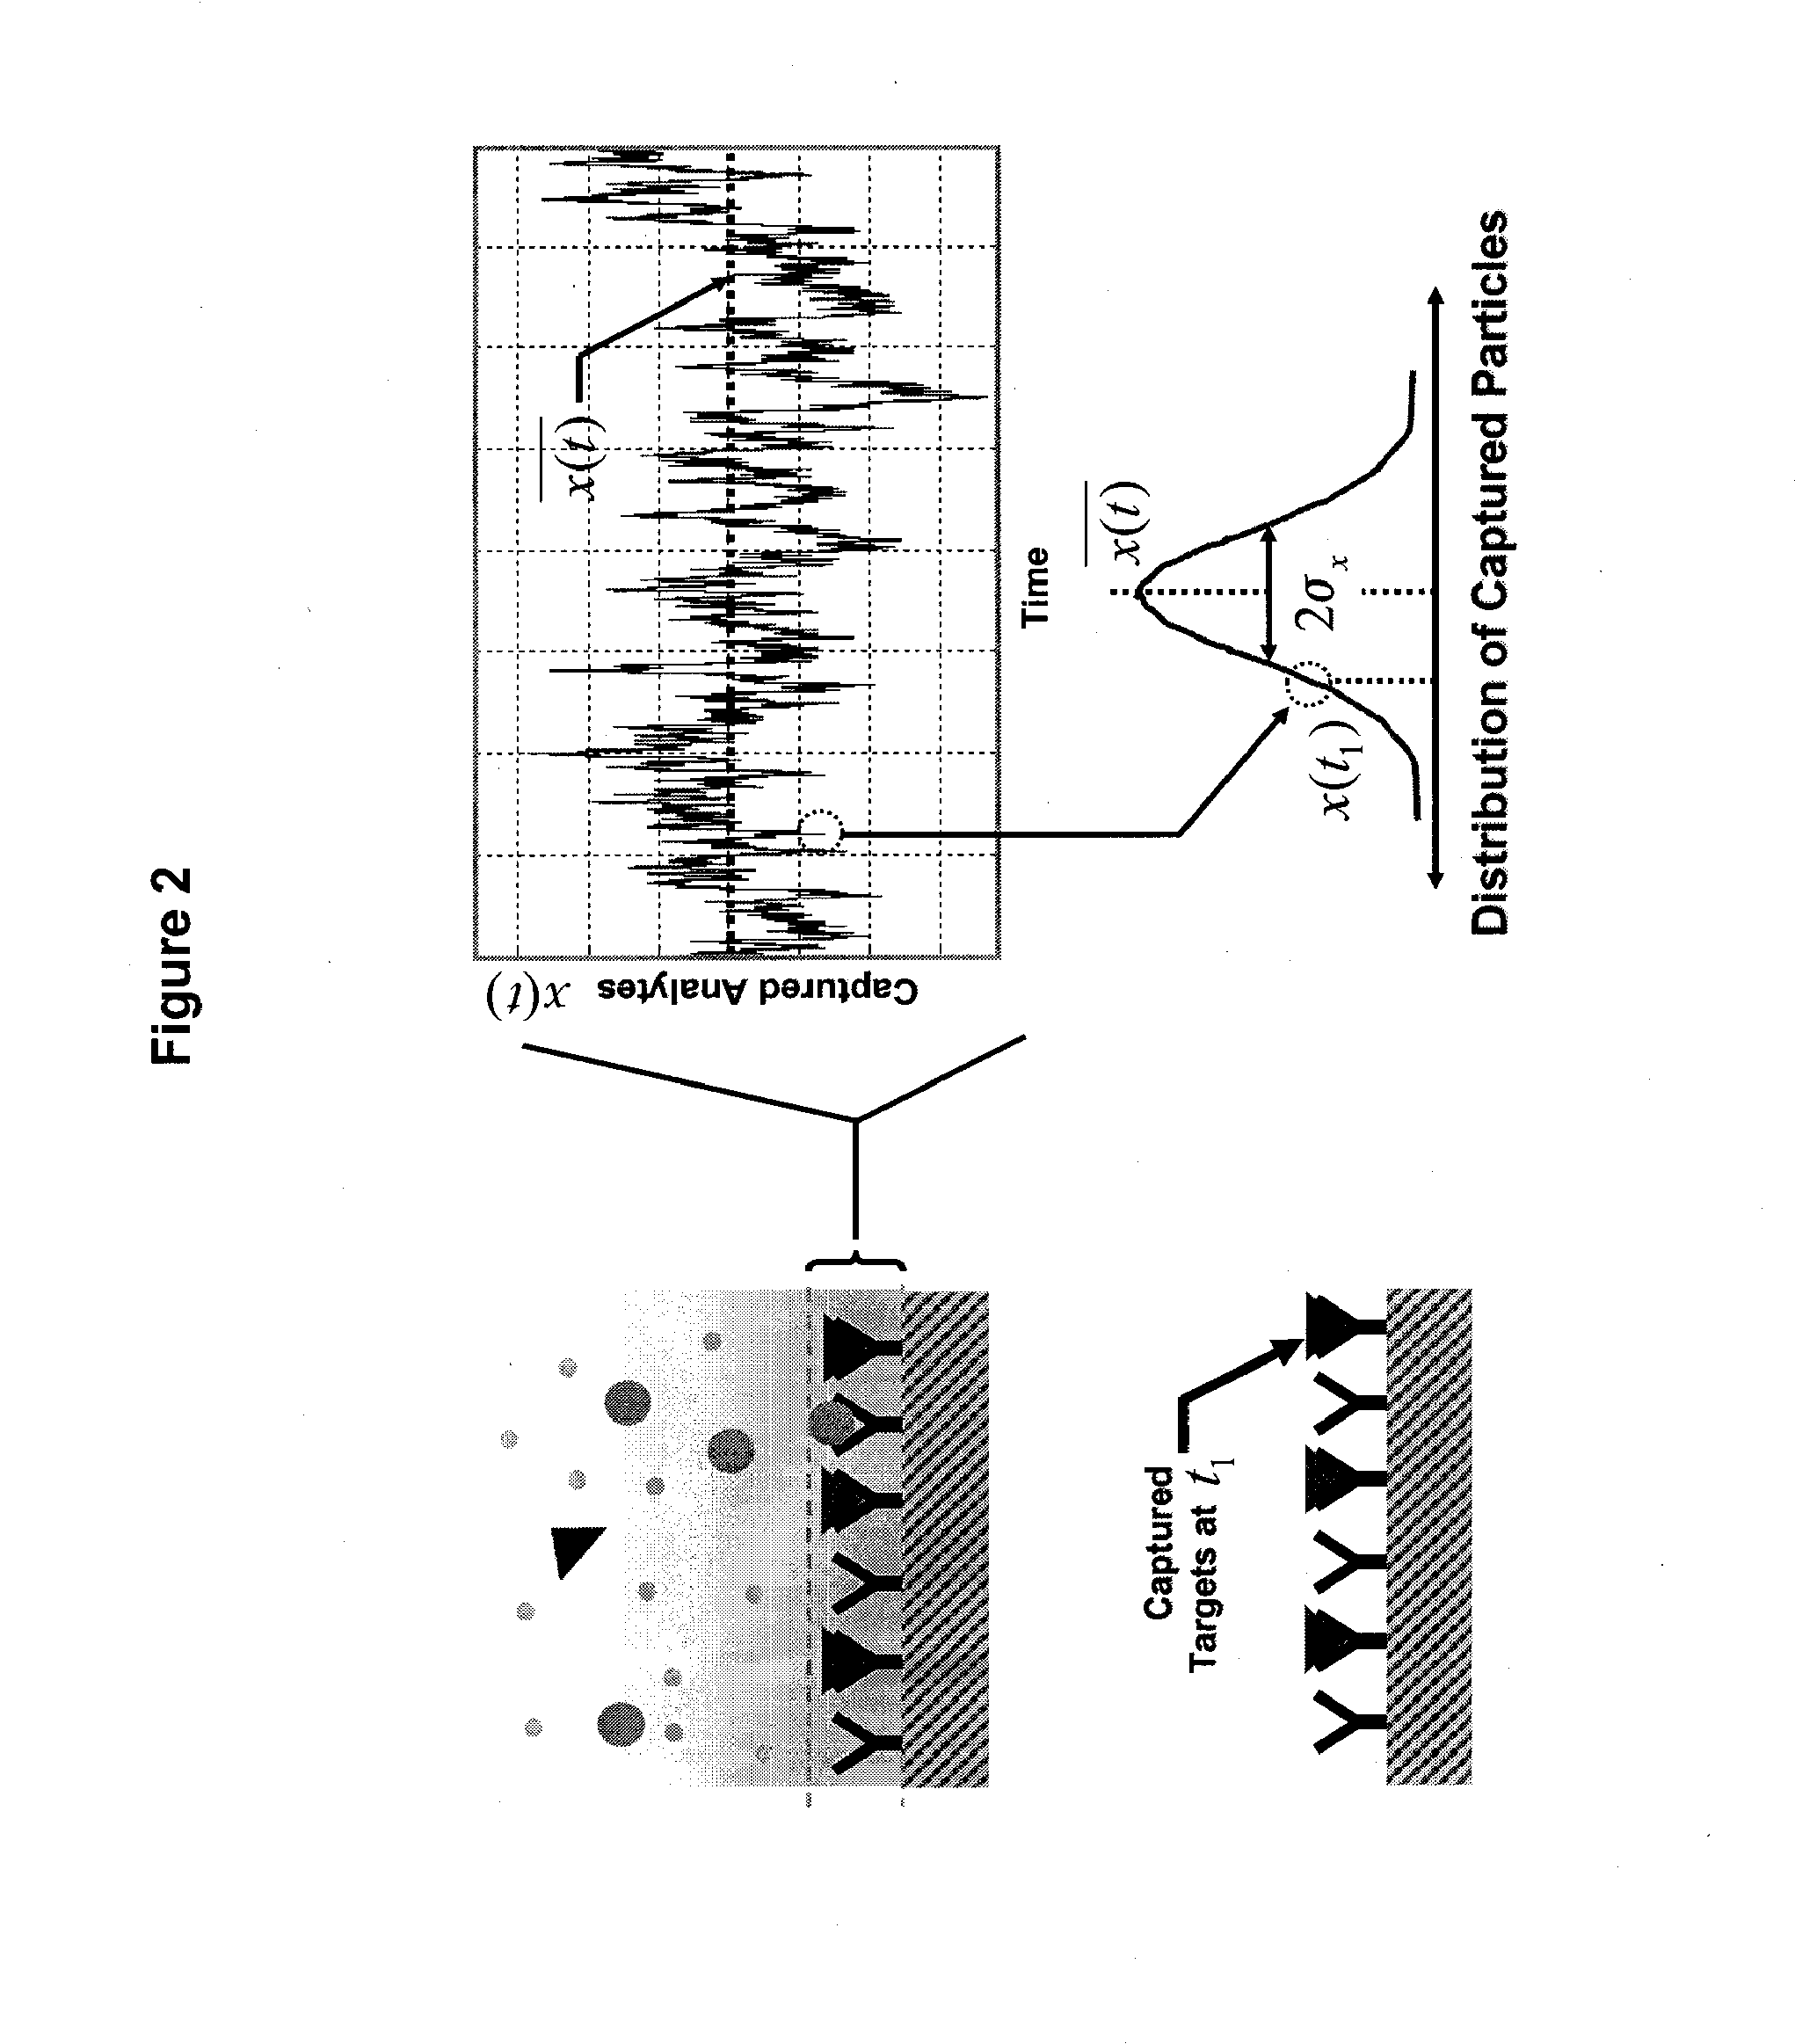
Moreover, because of the quantum-mechanical nature of chemical bond forming, the interaction between the probes and the analytes molecules is also probabilistic, thus further contributing to uncertainty and noise corruption of the measured data in biosensors and microarrays.
We view such phenomena as inherent noise in the detection system, which results in unavoidable uncertainties even when the measurements are noiseless.
Such inherent noise is essentially inevitable since it originates from the stochastic nature of molecular-level interactions.
Beside the inherent noise, other non-idealities also corrupt the signal obtained by the microarray experiments.
Unfortunately, the uncertainty originating from both inherent noise sources and systematic errors in each experiment can obscure some of the important characteristics of the biological processes of interest.
Nonetheless, these techniques often rely on comparative methods, redundant spots, or mathematical algorithms which introduce confidence zones by excluding the unreliable data and outliers.
Independent of the method utilized, the degree in which the SNR can be improved in such approaches can still be limited by the inherent microarray noise and systematic errors.
In practical microarray experiments, this assumption may not be not valid since the background and fluctuation level varies between spots.
It also contributes more errors in ratio analysis approaches, since low level signals are basically truncated away.
Both of these effects in turn can reduce the microarray detection dynamic range.
Since the incubation kinetics in the microarrays experiments is a function of analyte diffusion, reaction chamber size, temperature and binding kinetics of every analyte species, as well as the unknown analyte concentrations, the settling time of the system is quite complex and unpredictable.
Although all these questions can, to some extent, be empirically addressed, they are still major impediments in microarray technology and platform-to-platform inconsistencies can be caused by them.
In some cases, proper fluorescent and reporter intensity measurements are compromised in the presence of a large concentration of floating (unbound) labeled species in the incubation solution, whose signal can overwhelm the target-specific signal from the captured targets.
When the incubation is ceased and the solution is removed from the surface of the array, the washing artifacts often occur that make the analysis of the data even more challenging.

Method used


Image

  • Real Time Microarrays
  • Real Time Microarrays
  • Real Time Microarrays

Examples


example 1

[0226]FIG. 10 shows the layout of a 6×6 DNA microarray. Three different DNA probes (1, 2, and Control) with three different concentrations (2 μM, 10 μM, and 20 μM) are spotted and immobilized on the surface as illustrated. The probes contain a single Cy3 fluorescent molecule at the 5′ end. The DNA targets in this experiment contain a quencher molecule. The analyte binding in this system results in quenching of fluorescent molecules in certain spots. FIG. 11 shows a few samples of the real-time measurements of the microarray experiment wherein the control targets are added to the system. As illustrated in FIG. 11, the spots are quenched due to analyte binding.

[0227]FIGS. 12-15 each show data for 4 different spots with similar oligonucletide capturing probes. The target DNA analyte is introduced in the system at time zero and quenching (reduction of signal) occurs only when binding happens. For FIG. 12, the light intensity coefficient of variation was about 15%, however the estimated...

example 2

[0229] This example provides a derivation of an algorithm, and the use of the algorithm to determine analyte concentration from a real-time binding data. The derivation proceeds as follows:

[0230] Assume that the hybridization process starts at t=0, and consider discrete time intervals of the length Δt. Consider the change in the number of bound target molecules during the time interval (iΔt, (i+1)Δt). We can write

nb(i+1)−nb(i)=[nt−nb(i)]pb(i)Δt−nb(i)pr(i)Δt,

where nt denotes the total number of target molecules, nb(i) and nb(i+1) are the numbers of bound target molecules at t=iΔt and t=(i+1)Δt, respectively, and where pb(i) and pr(i) denote the probabilities of a target molecule binding to and releasing from a capturing probe during the ith time interval, respectively. Hence, nb⁡(i+1)-nb⁡(i)Δ⁢ ⁢t=[nt-nb⁡(i)]⁢pb⁡(i)-nb⁡(i)⁢pr⁡(i).(1)

[0231] It is reasonable to assume that the probability of the target release does not change between time intervals, i.e., pr(i)=pr, for all i. On th...

experimental example

[0246] Here we describe the experiments designed to test the validity of the proposed model and demonstrate the parameter estimation procedure. To this end, two DNA microarray experiments are performed. The custom 8-by-9 arrays contain 25mer probes printed in 3 different probe densities. The targets are Ambion mRNA Spikes, applied to the arrays with different concentrations. The concentrations used in the two experiments are 80 ng / 50 μl and 16 ng / 50 μl. The signal measured in the first experiment, where 80 ng of the target is applied to the array, is shown in FIG. 17. The smooth line shown in the same figure represents the fit obtained according to (7). In the second experiment, 16 ng of the target is applied to the array. The measured signal, and the corresponding fit obtained according to (7), are both shown in FIG. 18.

[0247] Applying (11)-(14), we obtain

pb=1.9×10⁻¹, pr=2.99×10⁻⁵.

[0248] Furthermore, we find that

nt2 / nt2=β1*β2*=3.75  (15)

[0249] Note that the above ratio is rela...


PUM

PropertyMeasurementUnit
roughnessaaaaaaaaaa
roughnessaaaaaaaaaa
roughnessaaaaaaaaaa

Abstract

This invention provides methods and systems for measuring the binding of analytes in solution to probes bound to surfaces in real-time.

Description

CROSS-REFERENCE [0001] This application claims priority to U.S. Provisional Application Nos. 60 / 811,064, filed Jun. 5, 2006, and 60 / 840,060 filed on Aug. 24, 2006, which are incorporated herein by reference in their entirety.BACKGROUND OF THE INVENTION [0002] Affinity-based biosensors exploit selective binding and interaction of certain bio-molecules (recognition probes) to detect specific target analytes in biological samples. The essential role of the biosensor platforms and the parallel and miniaturized version of them as microarrays are to exploit specific bindings of the probe-target complexes to produce detectable signals, which correlate with the presence of the targets and conceivably their abundance. The essential components of such a system include the molecular recognition layer (capturing probes) integrated within or intimately associated with a signal-generating physiochemical transducer and a readout device. [0003] To generate target-specific signal, the target analyte...

Claims


Application Information

Patent Timeline
Patent Type & Authority Applications(United States)
IPC IPC(8): C40B30/04C40B60/12G06G7/48
CPCC12Q1/6818C12Q1/6837C12Q2565/501C12Q2565/101C12Q2561/113
Inventor HASSIBI, ARJANGHASSIBI, BABAKVIKALO, HARISRIECHMANN, JOSE LUIS
Owner CALIFORNIA INST OF TECH
Learn More