Visualization Technique for Biological Information

a biological information and visualization technology, applied in the field of visualizing biological information, can solve problems such as inability to solve problems relating to problems, hammering attempts to integrate biological information, and mutually incompatible naming conventions

Inactive Publication Date: 2008-07-03
VALTION TEKNILLINEN TUTKIMUSKESKUS
View PDF4 Cites 22 Cited by
  • Summary
  • Abstract
  • Description
  • Claims
  • Application Information

AI Technical Summary

Benefits of technology

[0011]An advantage of the smart database retrieval engine is that the user needs to specify only what kind of information he / she is interested in, without having to specify what database the information is located in.
[0012]An advantage of the adjustable distance function is that elements that are strongly interrelated in the user's current context are also topologically close to each other in the visualized network.

Problems solved by technology

But the long history of separating biology to different disciplines hampers attempts to integrate biological information.
For instance, different databases often use mutually incompatible naming conventions and vocabularies.
The ontology-based technologies attack the incompatibility problem at a relatively low level and only solves problems caused by the different naming conventions and vocabularies.
The ontology-based technologies are unable to solve problems relating to problems caused by different context, ie, entities that may appear closely related in one context may be further apart in another.
Another problem of known visualization systems is that they require extensive knowledge of the various software tools and databases.

Method used


Image

  • Visualization Technique for Biological Information
  • Visualization Technique for Biological Information
  • Visualization Technique for Biological Information

Examples


examples

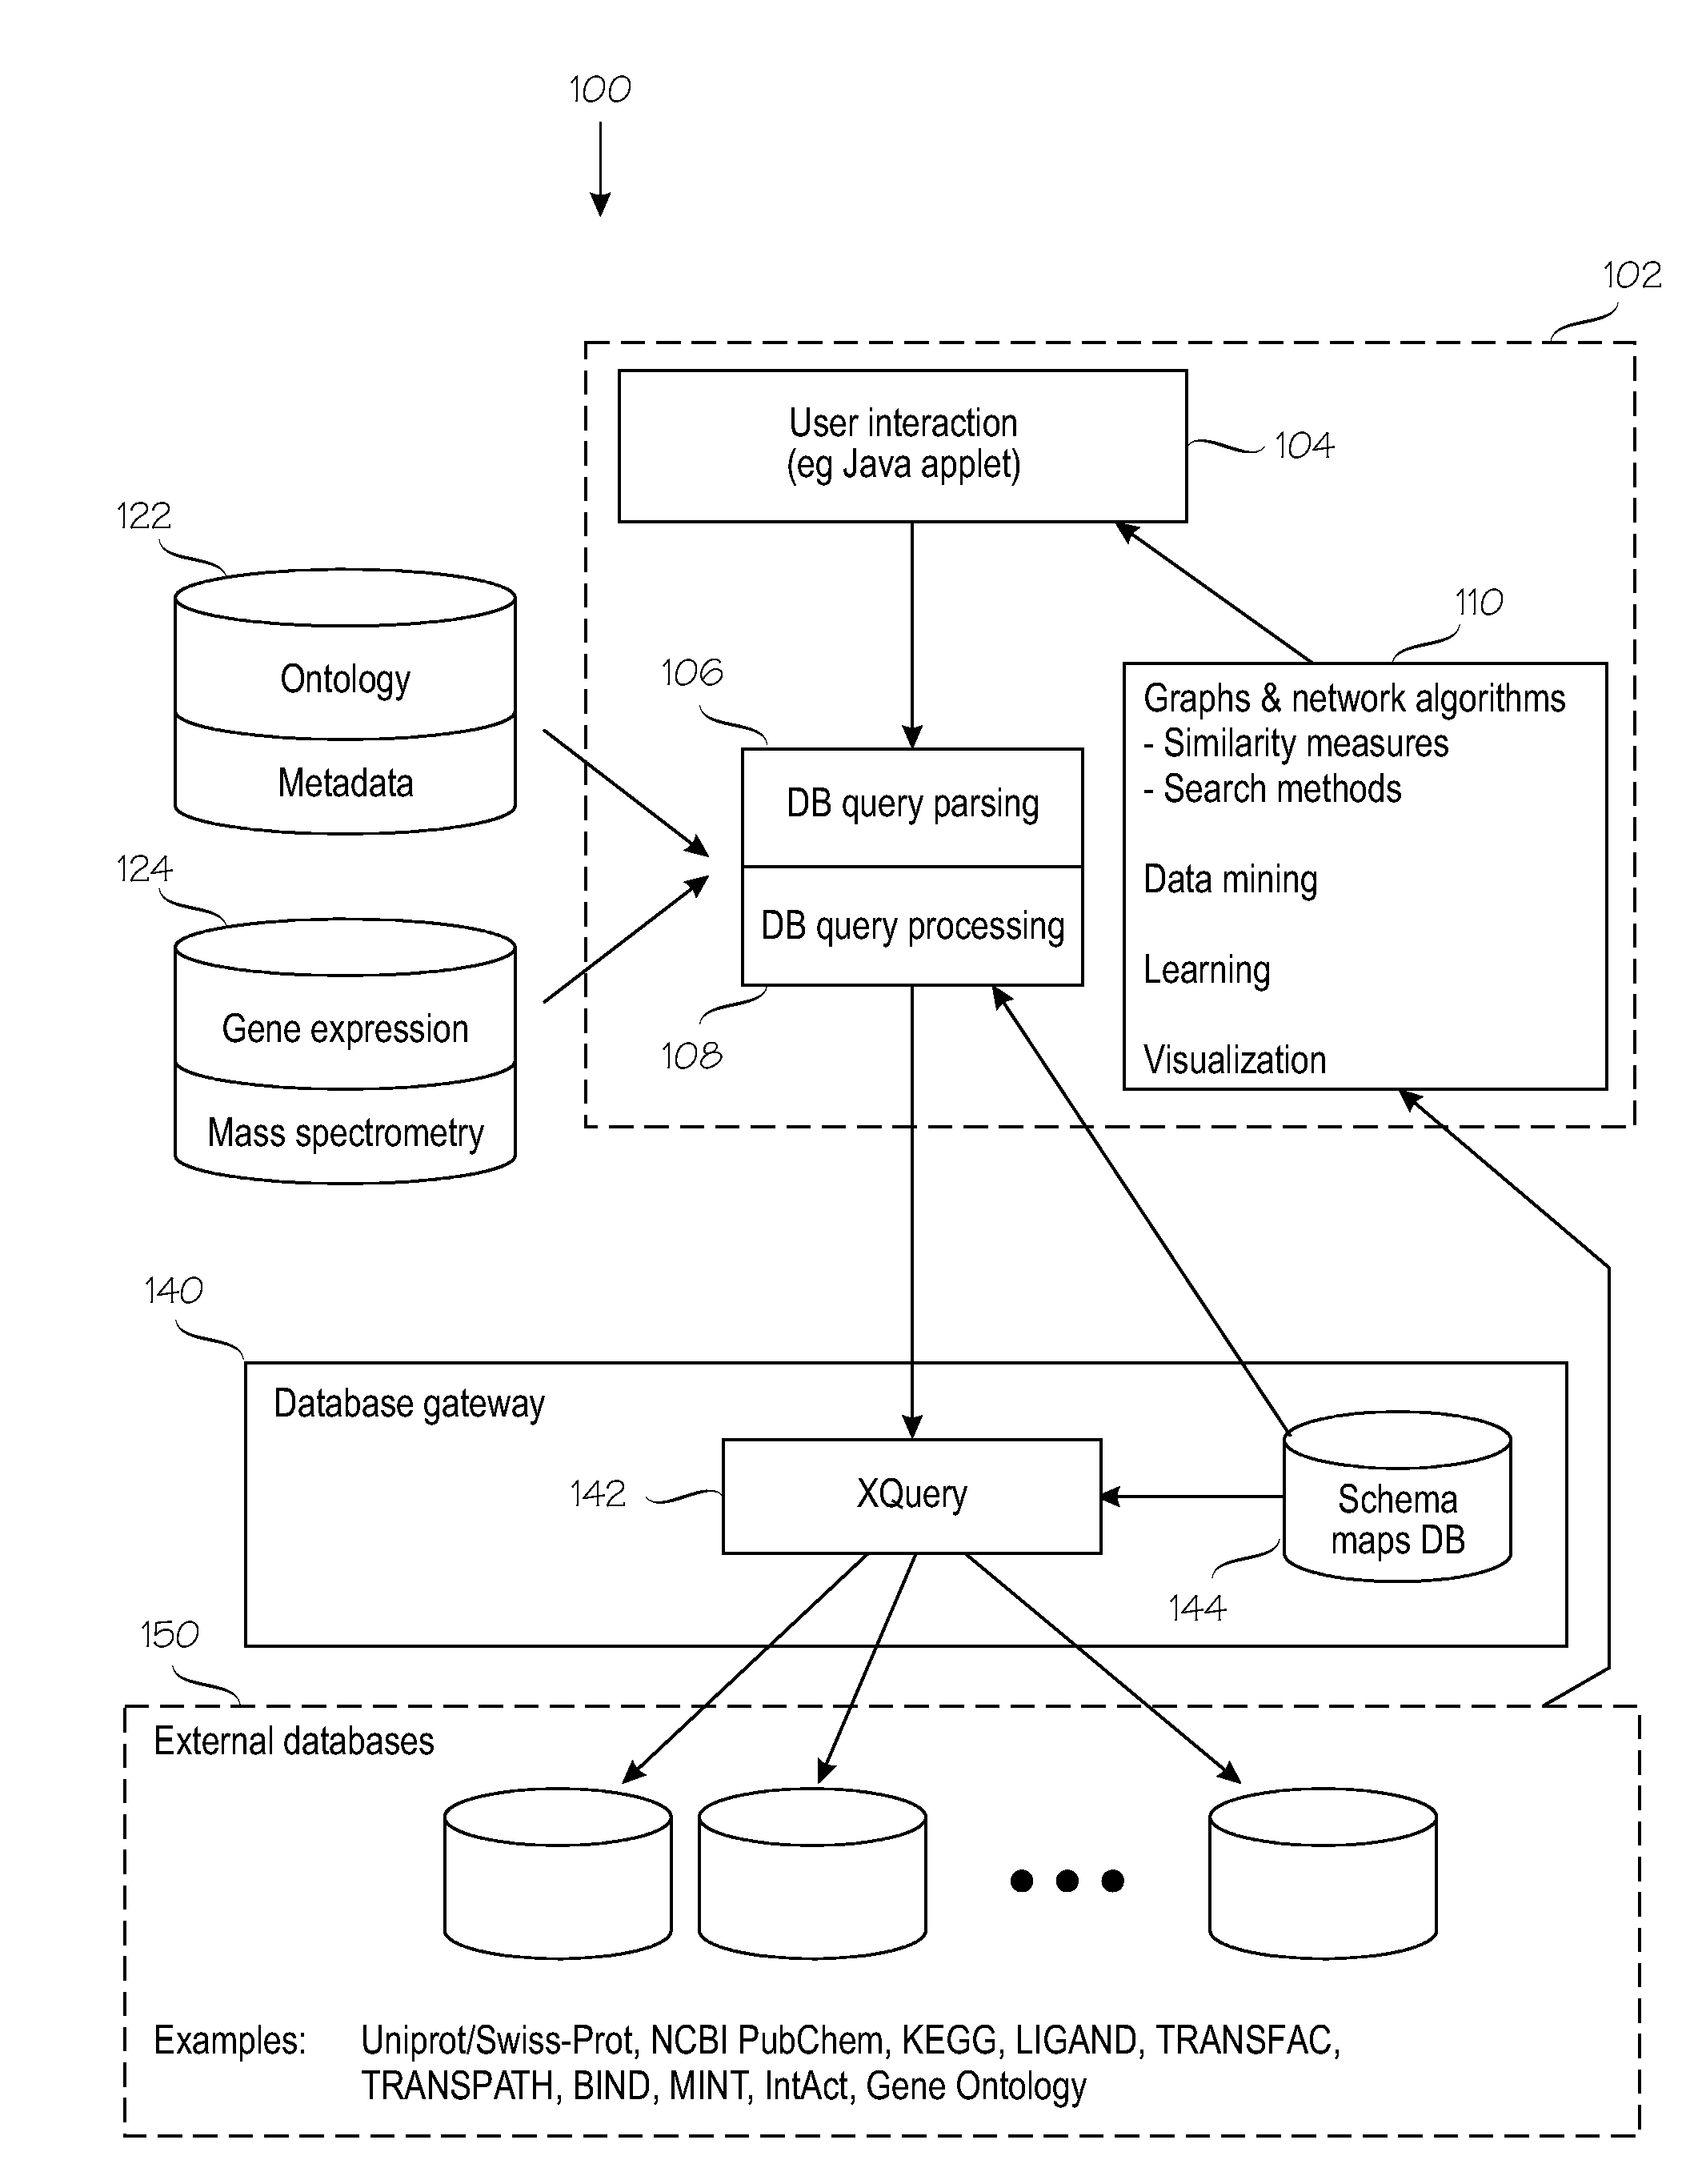
[0066]The invention is applicable to the study of metabolic pathways, enriched with information about known molecular interactions at the level of protein-protein interactions, regulatory and signalling networks. FIGS. 7A and 7B illustrate the results of query processing. In FIG. 7A, reference numeral 700 denotes an exemplary query, in which the slash character “ / ” is part of the pathway name (Glycolysis / Gluconeogenesis).

[0067]In this example, the query was set up to first search the KEGG database (shown as external databases 150 in FIG. 1) and retrieve the primary components of the pathways, ie, enzymes and compounds. In a second phase, the database traversals were used to search protein-protein interaction databases BIND and MINT for interactions of the enzymes with the nearest neighbour proteins, ie, interaction search depth was set to one. Reference numeral 720 denotes the resulting network which shows a surprisingly high level of connectivity across different stages of linear m...


PUM


Abstract

Method/system for visualizing biological information. The system receives a user query relating to biological information and determines which database contains related biological information. A database query is sent to the database and the result indicates biological/chemical entities and relations. A network is created based on the result; biological/chemical entities are mapped to network nodes and relations to network connections. A distance matrix indicates a multi-dimensional distance for several pairs of network nodes. A dimensionality reduction function is adjusted based on a research context, to bias the search toward a relevant focus. The number of dimensions in the distance matrix is lowered by the dimensionality reduction function. Neighbours of a selected node are searched (2-18) based on the distance matrix to elucidate a biological role of the selected node. A re-created network is visualised (2-20) based on the adjusted dimensionality reduction function.

Description

BACKGROUND OF THE INVENTION[0001]The invention relates to visualization techniques for visualizing biological information. It is customary to organize biological relations as one or more pathways or networks. An exemplary system is disclosed in Hass, L et al: “DiscoveryLink, a system for integrated access to life science data sources”, IBM Systems Journal 40, p. 489-511. The system described in this article exhibits certain shortcomings, however.[0002]Historically, the decomposition of biology into different disciplines was necessary to tackle the complexity of life science systems by reducing the degree of complexity down to the most basic level. With the advent of systems biology, such separation of biology is increasingly becoming artificial. But the long history of separating biology to different disciplines hampers attempts to integrate biological information. For instance, different databases often use mutually incompatible naming conventions and vocabularies. Attempts to solv...

Claims


Application Information

Patent Timeline
Patent Type & Authority Applications(United States)
IPC IPC(8): G06F17/30G16B5/00G16B45/00G16B50/10
CPCG06F17/30545G06F19/28G06F19/26G06F19/12G06F16/2471G16B5/00G16B45/00G16B50/00G16B50/10
Inventor ORESIC, MATEJLINDFORS, ERNOPEDDINTI, GOPALACHARYULU
Owner VALTION TEKNILLINEN TUTKIMUSKESKUS
Why Eureka
Try Eureka