
System and Method for Determining Directional and Non-directional Fluid Wave and Current Measurements

a fluid wave and current measurement technology, applied in the direction of acoustic wave reradiation, measurement devices, instruments, etc., can solve the problems of unavoidable exposure to harsh ocean environment, large separation distance, and inability to measure in situ, etc., to achieve the effect of large separation distan

Active Publication Date: 2008-10-02
NORTEK
View PDF2 Cites 24 Cited by
  • Summary
  • Abstract
  • Description
  • Claims
  • Application Information

AI Technical Summary

Benefits of technology

[0042]Doppler instruments which measure near surface orbital velocities from the bottom do extend the upper frequency range for bottom mounted wave instruments. Unfortunately, there remains a depth dependent upper frequency limit for these instruments as well. The limit is imposed by the spatial relationship between the wavelength and the spacing between measurements. As a rule, the upper frequency limit for Doppler profiler arrays exists when the frequency associated with waves having a wavelength that is shorter than two times the spacing of the two nearest array elements. This upper frequency limit becomes more restrictive as the instrument is positioned at greater depths and the measurement positions become more separated in space. Deployments in greater depths lead to larger separation distances. As a result this limits Doppler profilers to the measurement of only long waves (low frequency) or deployments in coastal depths. The constraints imposed by the relationship between array size and wavelength not only effects the upper frequency limit of the directional wave solution but also the upper frequency limit of the non-directional solution. This means the solution neglects the shortest waves from the total estimate. The resulting effect of this is usually an underestimation of the true wave height.

Problems solved by technology

The challenge of measuring currents and waves is that the environment itself is not particularly favorable for in situ measurements.
The most challenging aspect of the measurement requirements is that the instrument must be on site measuring waves on a regular schedule for extended periods of time.
Exposure to a harsh ocean environment is therefore unavoidable and represents one of the clear challenges of measuring waves.
Storm events are quite harsh on ocean instrumentation.
Determining wave direction characteristics is more complex and requires a system of measurements.
The exact manner in how this behaves is well described in linear wave theory but remains complex enough to trouble most newcomers to wave measurements.
Wave staffs are an accurate instrument, but are not practical in most measurement scenarios.
An example of the impracticality is in coastal waters where the depths are greater than a few meters.
Here it is not realistic to have a rigid structure that can both handle the tough environment as well as small enough to not influence the waves themselves.
The structure influences the waves and this compromises the accuracy of the measurement.
How they do this is a little more complicated and varied.
This is primarily attributed to the fact that for many years there was no other practical solution that could withstand the harsh ocean environment.
However, wave buoys are not immune to the environmental conditions and the fact that buoys are deployed on the ocean's surface has taken its toll on buoys over the years; where storms, fishermen, and shipping traffic account for most of lost buoys.
The added physical demands (space and weight) of these other functions often lower the resonant frequency response of the buoy, and therefore complicate the buoy's ability to respond to wave motion.
The result is a poorer description of wave characteristics.
Although the PUV method has many advantages, there exists a significant depth limitation for its performance.
The deeper the PUV instrument is positioned in the water, the lower this frequency limit becomes.
The difficulty most engineers and scientist have with understanding this depth limitation is that there is not a unique depth at which the performance will cut off.
The limitation arises from the fact that both the quantities being measured (pressure and velocity) attenuate exponentially with depth and the rate at which the attenuation occurs depends on the wavelength.
This is an inverse problem and therefore necessitates special treatment.
In addition to the limitation imposed by the attenuation of the wave properties, there is another frequency limitation that is associated with the spatial size of the array itself.
A complication is that this approach no longer measures the orbital velocities at one location but in three or more spatially separated locations.
The array of Doppler measurements is mathematically more complicated since each of these cells has a unique orientation relative to the incident waves and therefore a unique response.
The complexity of the solution lies in the fact that the direction of the waves is not known beforehand and the response of the measurements are directionally dependent.
The stated problem again is an inverse problem, which is why the MLM is used.
This can be further complicated if the measurement array is overpopulated with several measurement locations, some of which having high coherence with one another.
The inversion process becomes increasingly unstable when the described situation occurs.
The number of degrees of freedom resulting from measurements at several different locations (due to platform motion) would increase to a point where the MLM approach would be either unstable or computationally prohibitive.
In summary, the MLM solution is an accurate solution; however, it is complex and the various limits of its use must be well understood prior to implementation.
Unfortunately, there remains a depth dependent upper frequency limit for these instruments as well.
This upper frequency limit becomes more restrictive as the instrument is positioned at greater depths and the measurement positions become more separated in space.
Deployments in greater depths lead to larger separation distances.
As a result this limits Doppler profilers to the measurement of only long waves (low frequency) or deployments in coastal depths.
The constraints imposed by the relationship between array size and wavelength not only effects the upper frequency limit of the directional wave solution but also the upper frequency limit of the non-directional solution.
The resulting effect of this is usually an underestimation of the true wave height.
Acoustic surface tracking measures surface displacement at one position, and therefore it is limited to non-directional waves estimates when used as an independent estimator.
First is the problem of exposure of instrumentation on or near the ocean surface.
The method is still limited to low frequency waves and therefore it remains a viable option for relatively shallow deployment depths in the water column.
The problem with measuring wave orbital velocity is that the approach requires a computational intensive solution known as the Maximum Likelihood Method (MLM) to estimate the directional distribution.
The second limit is that the wave directional processing method, the MLM, requires measurements on a stationary platform so that the velocity measurements are made at a repeatable location during the ensemble measurement cycle.
Therefore, the current profiler using MLM processing can not be placed on a moving platform such as a subsurface buoy.
Horizontal buoy motion can negatively influence directional estimates if the horizontal velocity is different from the orbital velocities being measured.
This behavior is problematic if the characteristic frequency lies within the frequency band of the surface waves being measured.
A subsurface buoy-mooring system that is oscillating with a characteristic frequency different from the overlying surface waves can create a “perceived velocity”, and as a result, biases the direction estimates.

Method used


Image

  • System and Method for Determining Directional and Non-directional Fluid Wave and Current Measurements
  • System and Method for Determining Directional and Non-directional Fluid Wave and Current Measurements
  • System and Method for Determining Directional and Non-directional Fluid Wave and Current Measurements

Examples


Embodiment Construction

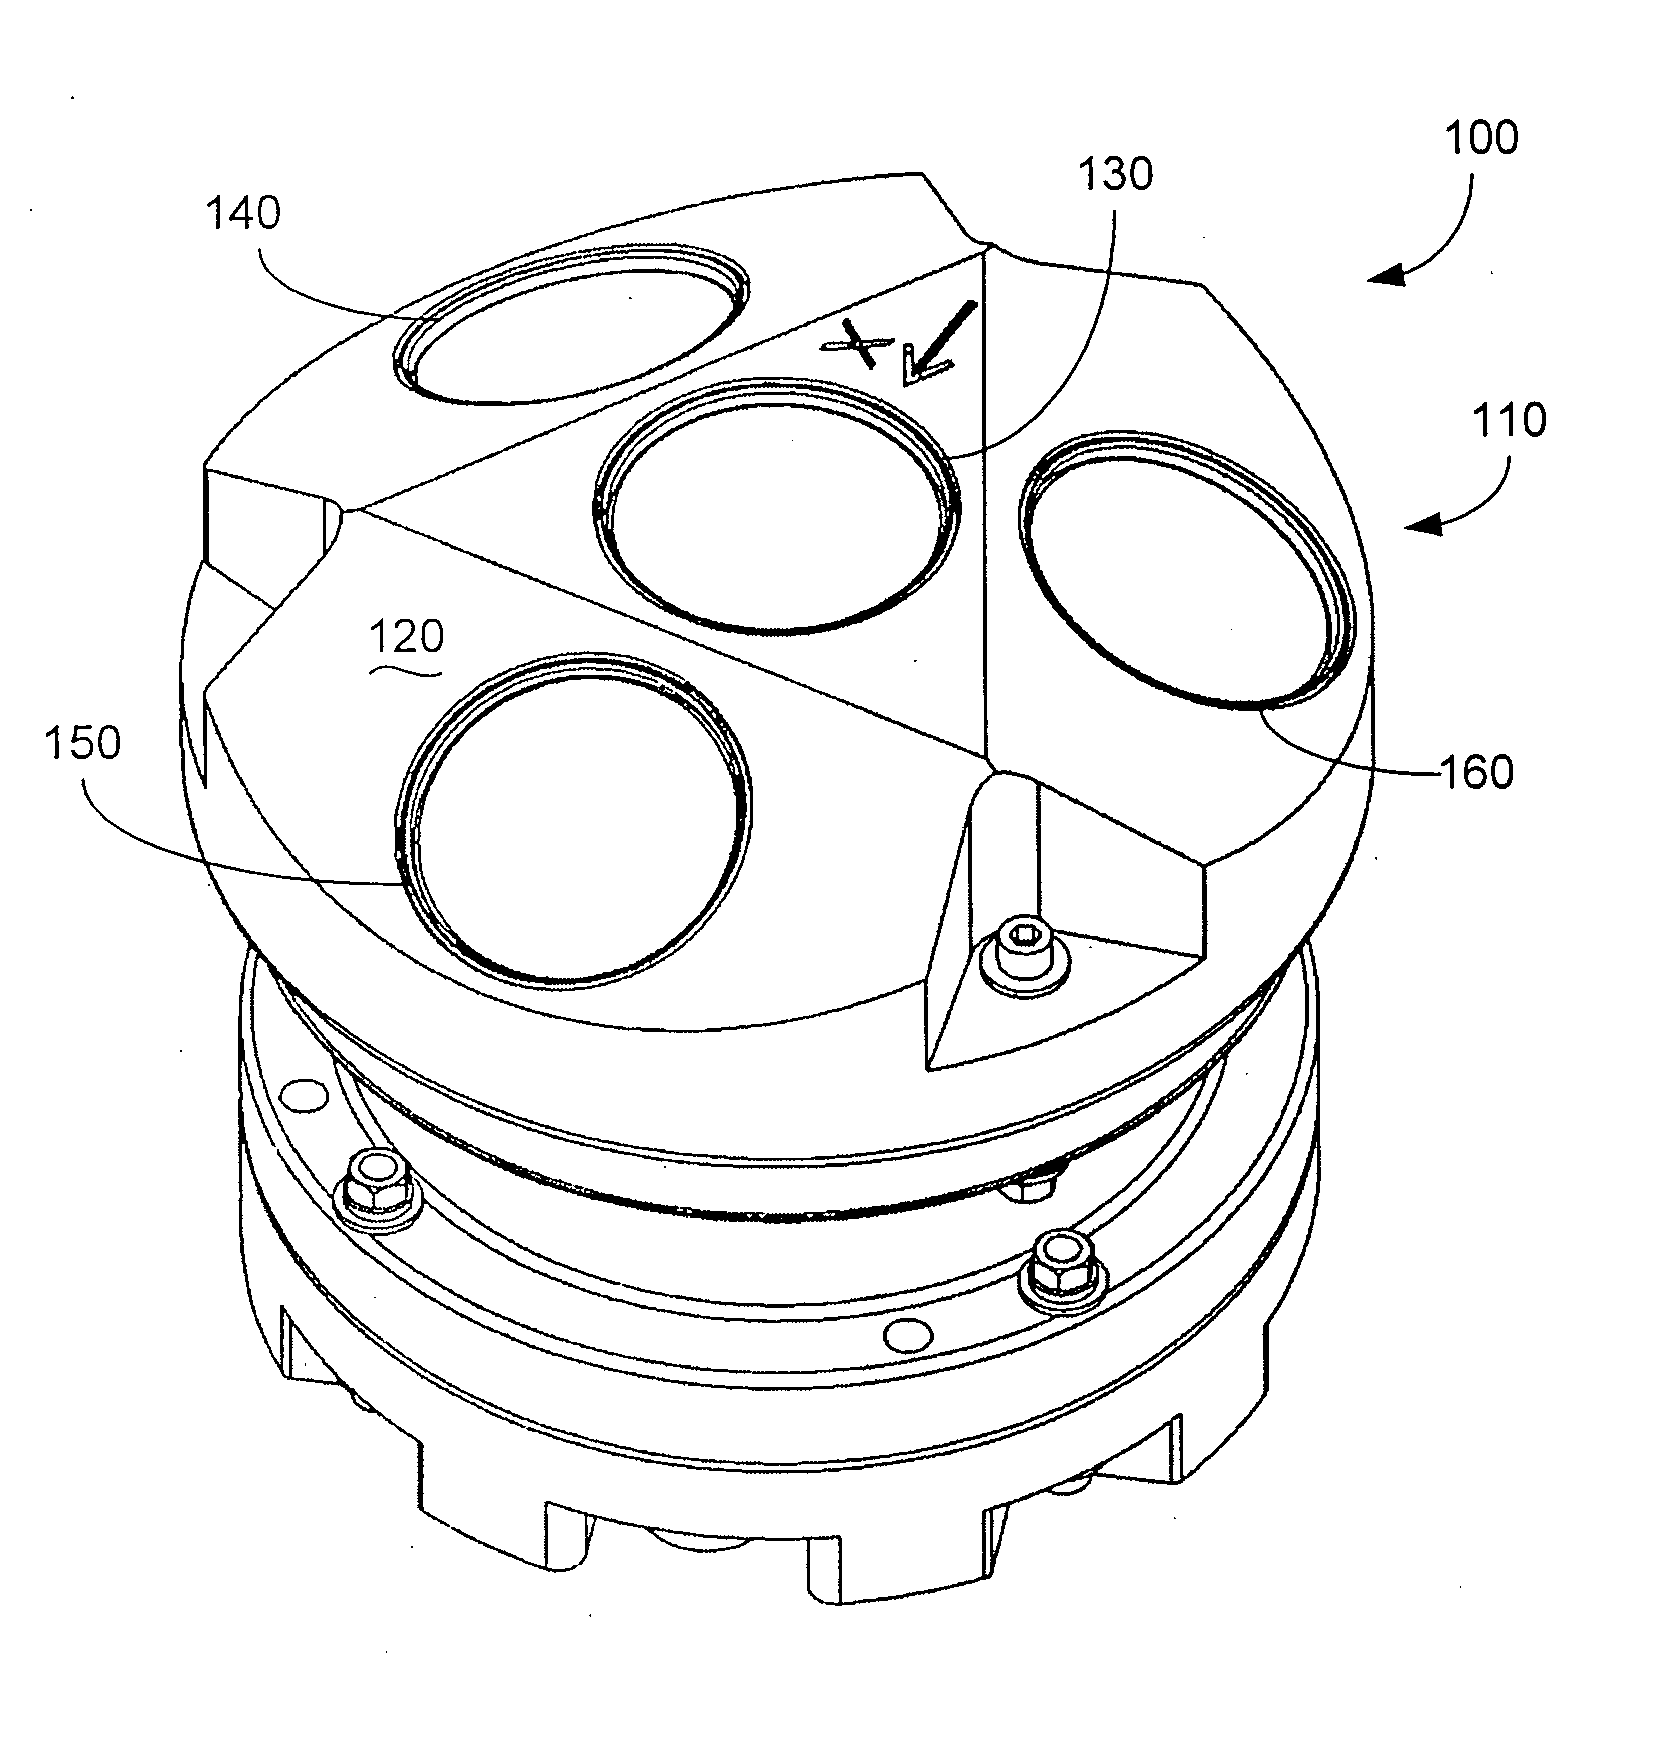
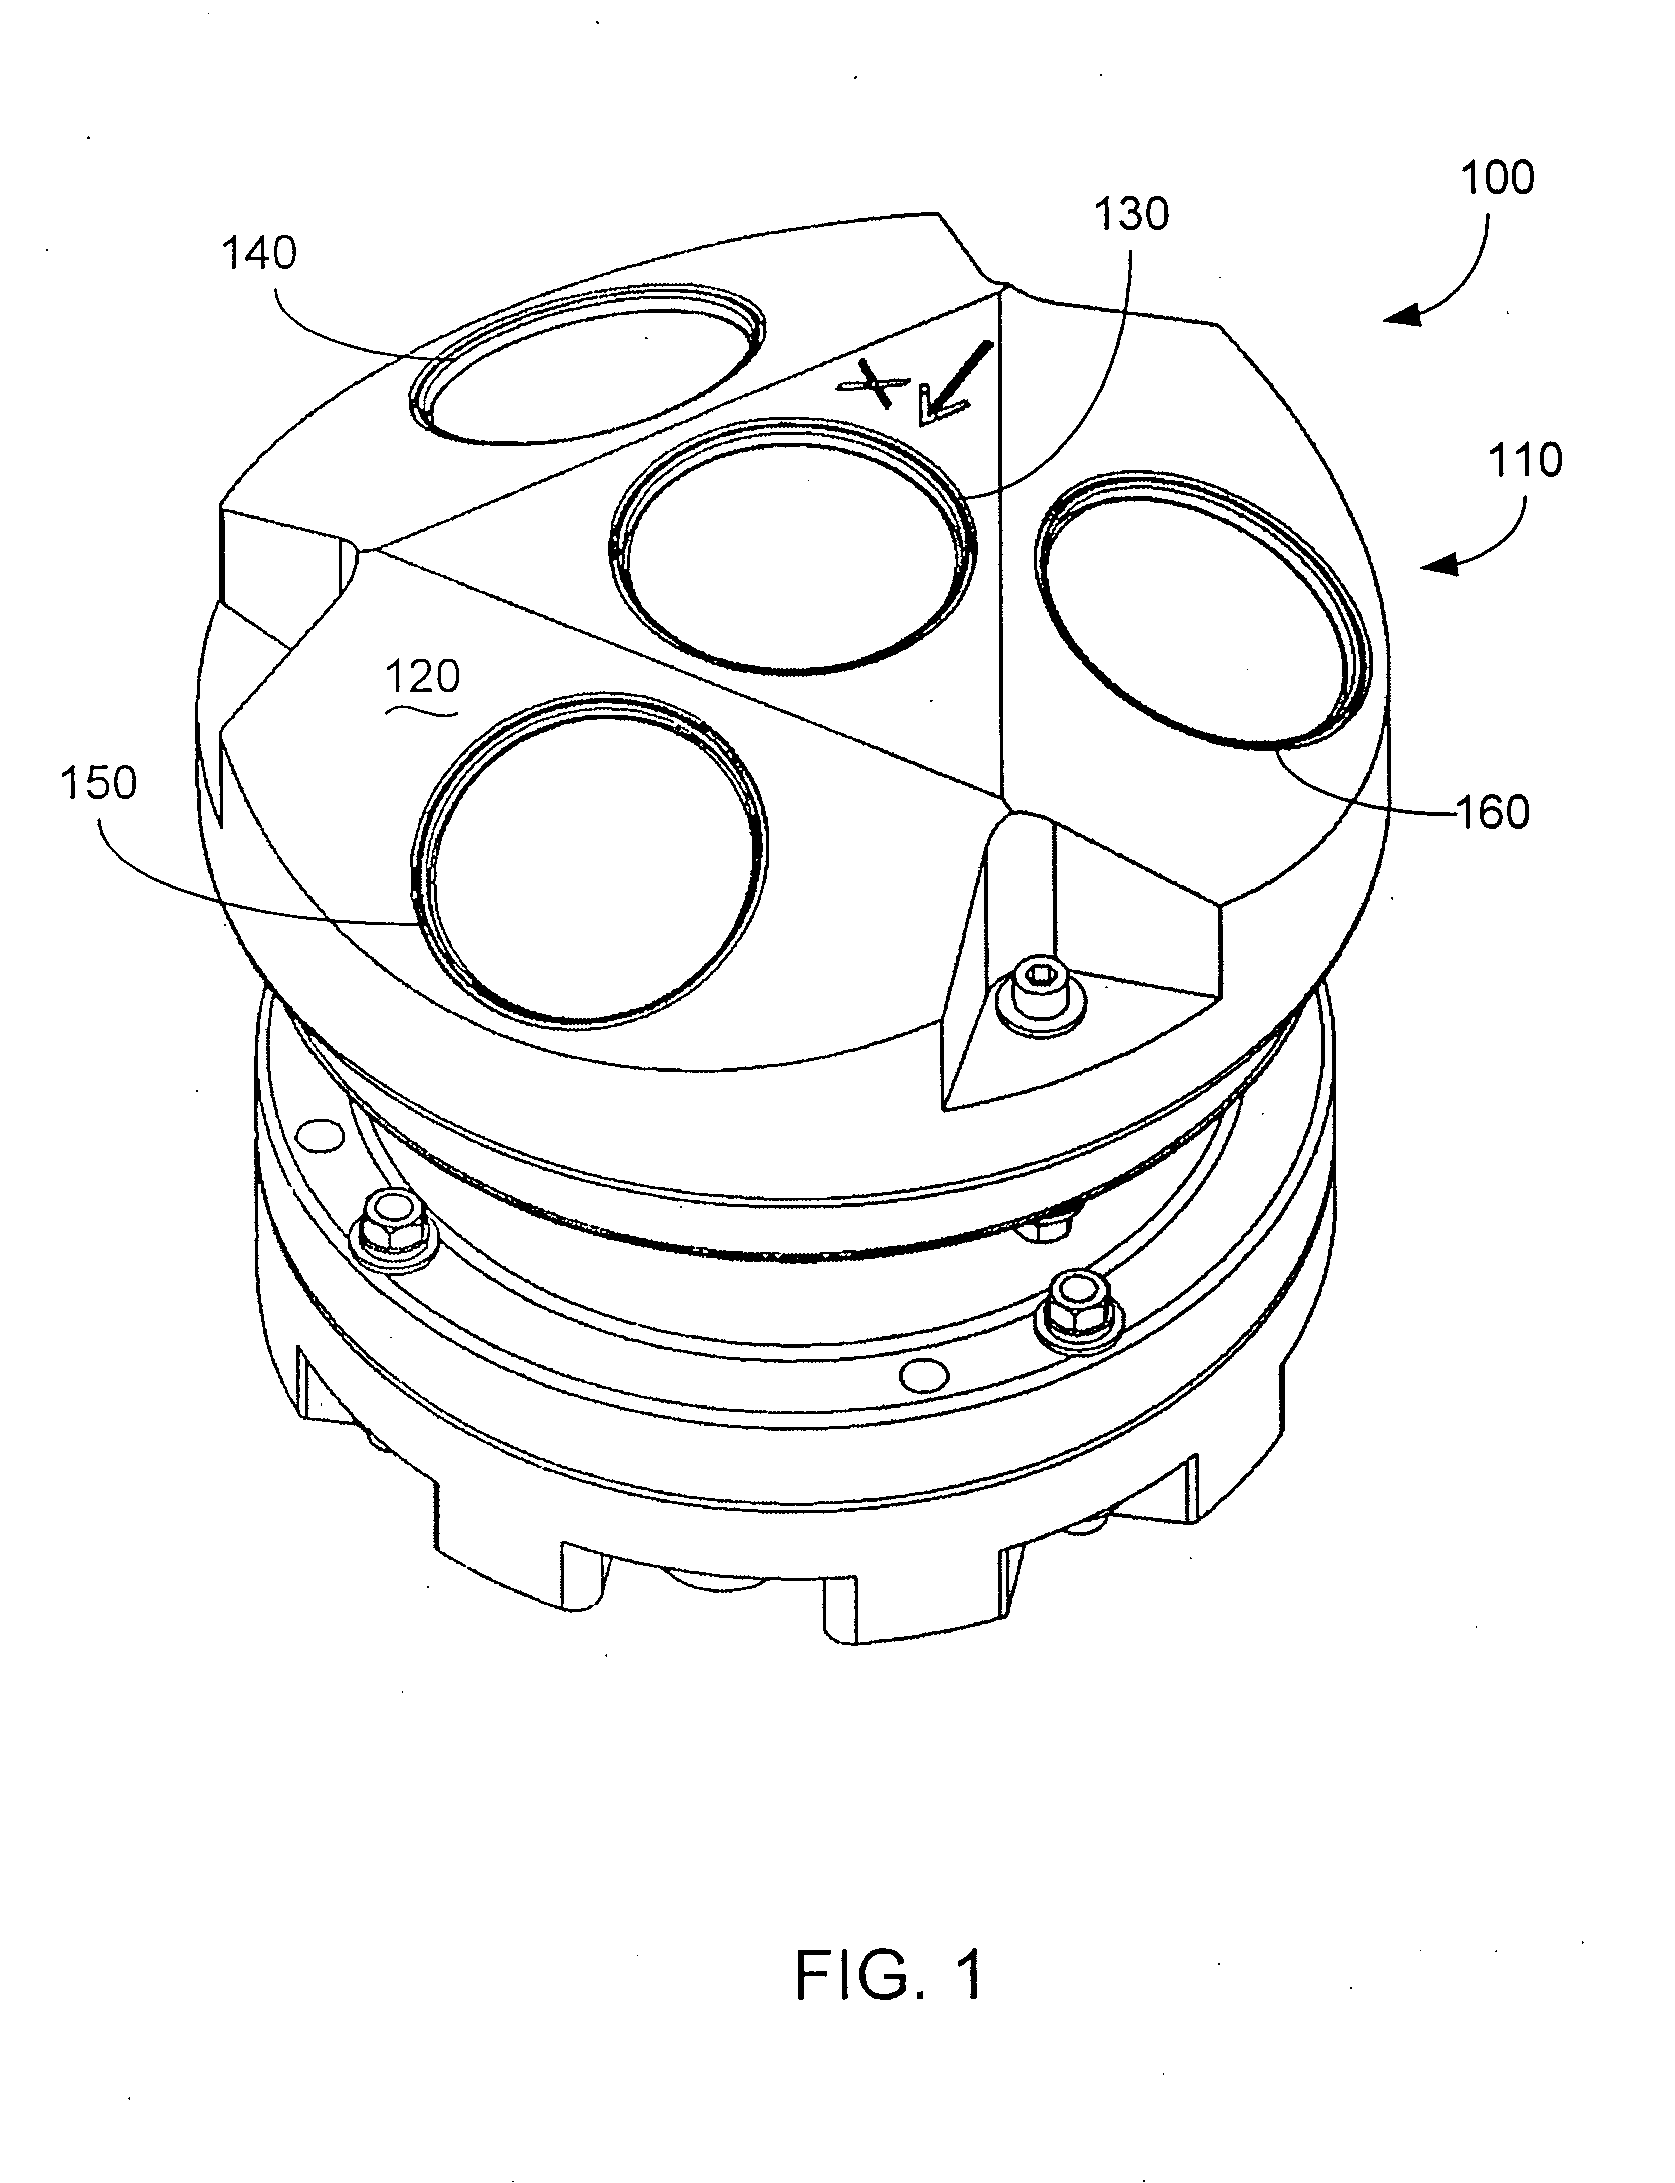
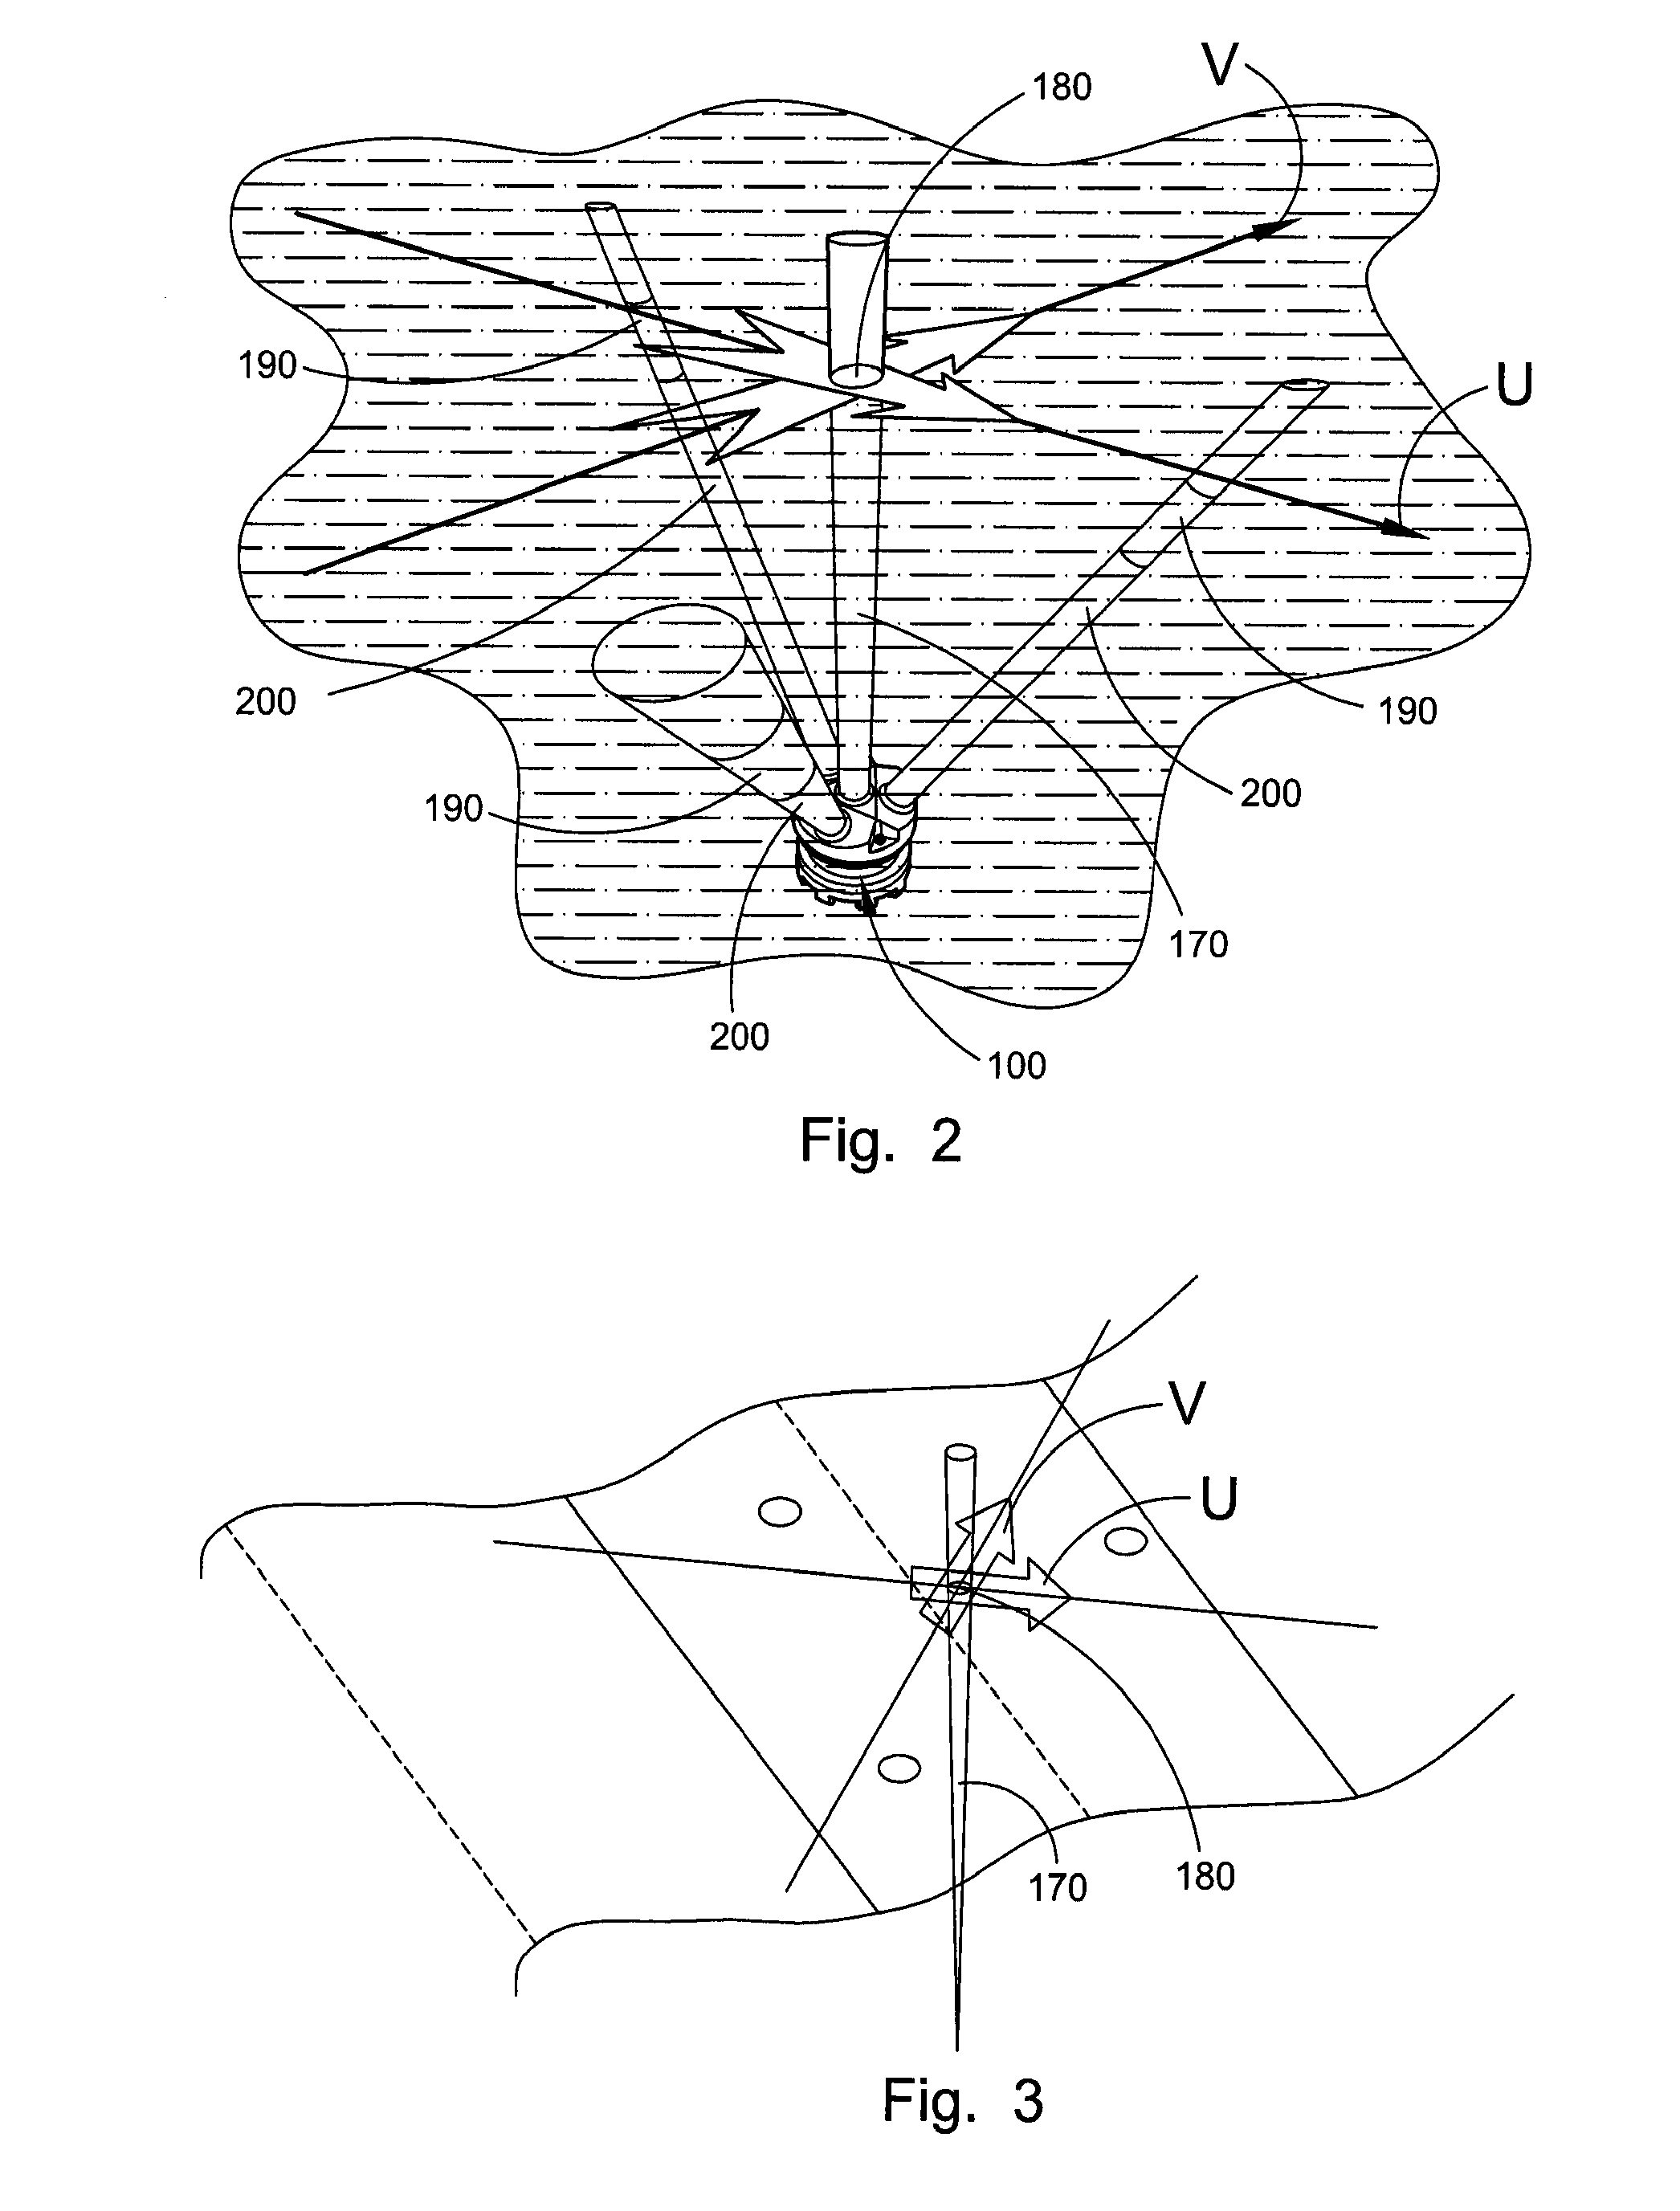
[0073]With reference to FIGS. 1-9, a system 100 and method for determining directional and non-directional fluid wave and current measurements will be described.

[0074]After reading this description it will become apparent to one skilled in the art how to implement the invention in various alternative embodiments and alternative applications. However, although various embodiments of the present invention will be described herein, it is understood that these embodiments are presented by way of example only, and not limitation. As such, this detailed description of various alternative embodiments should not be construed to limit the scope or breadth of the present invention as set forth in the appended claims.

[0075]With reference initially to FIG. 1, the system 100 comprises an acoustic wave and current sensor (“AWAC”). In alternative embodiments, the system 100 may include one or more alternative instruments. In the embodiment shown, the AWAC 100 includes a relatively small cylindrica...


PUM


Abstract

A system for determining the directional properties of surface waves or internal waves of a fluid medium includes a sonar system having a plurality of transducers for generating respective, separate acoustic beams and receiving echoes from one or more range cells located substantially within the beams; and a computer program for determining the directional properties associated with the surface waves or internal waves from the received echoes, wherein the computer program determines along-beam velocities along the separate acoustic beams and combines the along-beam velocities to form an equivalent orbital velocity vector. The system is mounted on or in a sub surface buoy that can move or rotate during measurement and includes a motion sensor measuring six degrees of freedom to account for horizontal velocity and vertical displacement in the subsurface buoy mounted sonar system.

Description

CROSS-REFERENCE TO RELATED APPLICATIONS[0001]This application is a continuation-in-part of U.S. patent application Ser. No. 11 / 293,918 filed Dec. 5, 2005, issued Apr. 1, 2008 as U.S. Pat. No. 7,352,651, and claims the benefit of U.S. Provisional Application 60 / 694,837 filed Jun. 29, 2005 under 35 U.S.C. 119(e). Both of these applications are incorporated by reference as though set forth in full.FIELD OF THE INVENTION[0002]The present invention relates to directional and non-directional water wave measurements and current measurements.BACKGROUND OF THE INVENTION[0003]Scientists are interested in physical characteristics of bodies of water. Among these characteristics are waves and fluid flow, most commonly referred to as currents. Both of these physical characteristics serve as forcing mechanisms, which can largely influence activities in bodies of water. These activities include many biological processes, navigation, industrial applications, structural response evaluation, and weath...

Claims


Application Information

Patent Timeline
Patent Type & Authority Applications(United States)
IPC IPC(8): H04B1/59
CPCG01C13/002G01S7/521G01S15/588G01S15/88
Inventor LOHRMANN, ATLEPEDERSEN, TORSTEIN KANSTAD
Owner NORTEK
Learn More