Primers for melting analysis

a technology of primers and primers, applied in the field of primers for melting analysis, can solve the problems of difficult routine medical practice using this knowledge, high cost of closed-tube methods, and high cost of fluorescent probes, and achieve the effects of reducing the signal strength of snapback primers that form larger loops, good signals, and high melting temperatures

Active Publication Date: 2010-08-05
BIOFIRE DEFENSE +1
View PDF3 Cites 6 Cited by
  • Summary
  • Abstract
  • Description
  • Claims
  • Application Information

AI Technical Summary

Benefits of technology

[0077]The effect of differing loops lengths was investigated by varying the distance between the Snapback primer and the locus to be interrogated. Asymmetric PCR was performed as in Example 3. The M13 primers used are shown in Table 4, wherein upper case indicates the probe element tail, lower case defines the template-specific primer region, and the bold face base indicates the variable position on the template after the snapback hairpin has formed. In this case, 2 by 5′-mismatches adjacent to the probe element were not used.
[0078]The experimental design is diagrammed in FIG. 10A. The relative positions of the primers before PCR are indicated on top. PCR and melting was performed as in Example 3. The loop conformation of the extended Snapback primer after asymmetric PCR is shown on the bottom of FIG. 10A. The loop size varied from 17-236 bp.
[0079]The derivative melting curves of the six different products are shown in FIG. 10B. It is noted that the Tm for the full-length amplicon is directly related to amplicon size. With respect to Snapback probe tail melting in which all probe tails were of the same size, smaller loops resulted in higher melting temperatures, indicating that stabilization of intramolecular hybridization is inversely related to loop size, at least between 17-236 bases. The inverse relationship appears to be logarithmic between 17 and 150 bases, with the Tm inversely proportional to the log of the log size. Steric hindrance may become an issue with loops that are smaller than 17 bases, but this is unlikely to be a concern most cases, since the minimum loop size is generally dictated by the primer size. The signal strength of Snapback primers that form larger loops may be decreased relative to the amplicon signal, as seen in Example 5 and with unlabeled probes (11). For example, the melting curve with a loop of 236 by (5R) loop length is weak. With this illustrative amplicon, the best signals were obtained with loop sizes between 17 and 177 bases, and it is expected that good signals would be obtained with loops of less than 200 bases. Because stabilization of the probe element and large relative signals are generally preferred, loop sizes between 20 and 50 bases are expected to work well.
[0080]A single Snapback primer was used to amplify various plasmid templates to demonstrate that the shape of the probe element melting curve depends on the amplified sequence. Four different M13 plasmids were used as the target, wherein each plasmid differed only at one position with an A, C, G, or T. In this example, to simulate homozygote genotyping, only one matched or mismatched plasmid was used, while to simulate heterozygotes two plasmids mixed in equal proportions were used. Asymmetric PCR was performed as in Example 3. The M13 primers used are 1F tcattctcgttttctgaactg (SEQ ID NO:5) and 1R22Tmis10 tcATTCAATGAATATTTATGACGAatgtttagactggatagcgt (SEQ ID NO:31), wherein upper case indicates the probe element or tail, lower case defines the template-specific primer region, lower case italics indicates bases that are mismatched to the target, and the bold face base indicates the variable position on the template after the Snapback hairpin has formed. The PCR product was 120 by in length.
[0081]Using a Snapback primer with an “A” at the variable position, all possible matched, partially matched, and completely mismatched templates were investigated. With homozygous templates, one matched and three mismatched duplexes were formed (FIG. 11A), all showing single melting transitions. At the amplicon transition, the G and C PCR products are slightly more stable than the A and T PCR products. The probe element transition is most stable with an A:T match, followed by an A:G mismatch, an A:A mismatch and finally a A:C mismatch.
[0082]FIG. 11B shows the matched template along with all three partially matched heterozygotes. As in FIG. 11A, the matched template shows a single probe element melting peak around 68°. All three heterozygotes show composite probe element melting peaks with one allele matched and the other mismatched, usually resolving into two distinct peaks with one peak around 68° C. and the other peak depending upon the particular mismatch.

Problems solved by technology

However, even when the genetic details become known, it is difficult to use this knowledge in routine medical practice, in large part because the methods to analyze DNA are expensive and complex.
However, closed-tube methods are traditionally expensive, due in large part to the cost of the fluorescent probes used.
Although there are many elegant designs, the probes are often complex with multiple fluorescent dyes and / or functional groups.
Not only are the probes costly, but the time required for hybridization and exonuclease cleavage also limits the speed at which PCR can be performed.
However, such probes can be complex and expensive.
The high cost is driven by the high complexity to produce certain probes.
However, Snapback primers and other prior art methods discussed herein rely on post-amplification gel separation, or use expensive fluorescently labeled primers.
One issue that has prevented a better method of genotyping revolves around the fact that most genetic diseases are complex.
Even though costs are decreasing, sequencing is still a complex process that is not rapid, simple, or inexpensive when applied to specific genetic diagnosis or pharmacogenetics.

Method used


Image

  • Primers for melting analysis
  • Primers for melting analysis
  • Primers for melting analysis

Examples


example 1

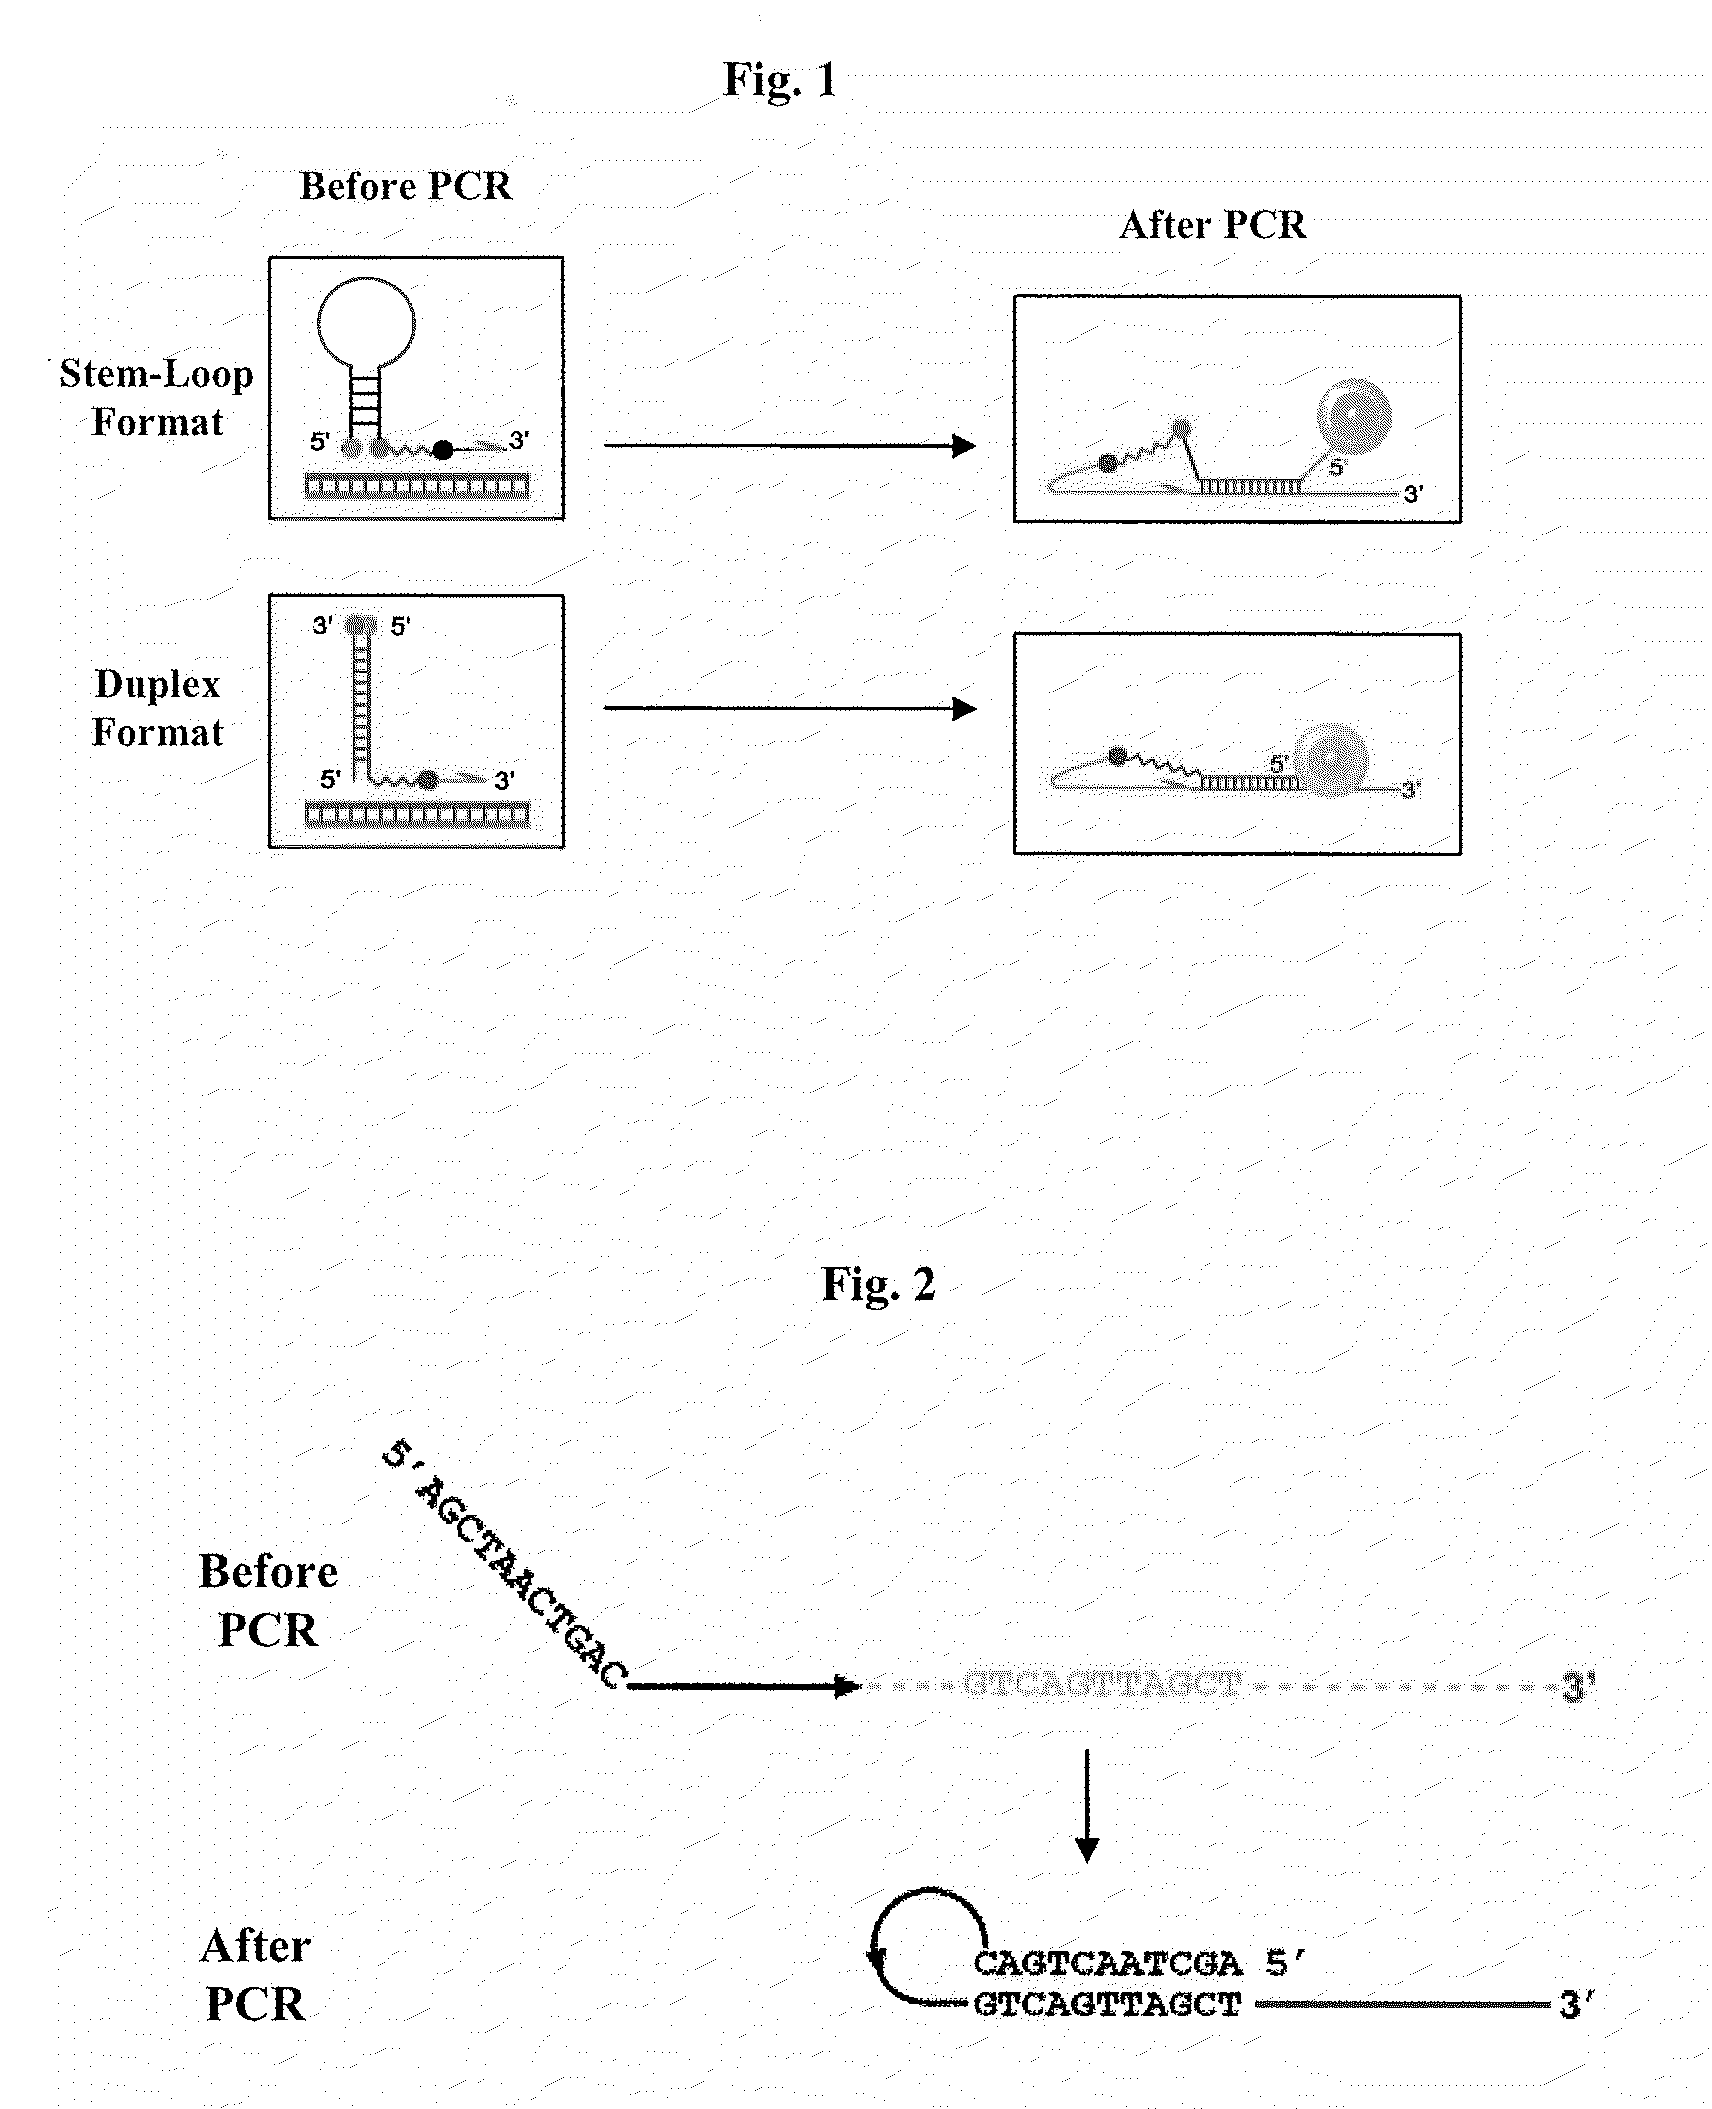
Genotyping with a Snapback Primer after Symmetric PCR

[0059]An engineered plasmid template of M13 sequence with 40% GC content was used as template (25). Otherwise identical plasmids with either an A, C, G, or T at one position were available for study. Both the “A” template and the “C” template were studied, as well as a “A / C” heterozygote that was formed by mixing equal amounts of the “A” and “C” templates. The concentration of each plasmid was determined by absorbance at 260 nm (A260), assuming an A260 of 1.0 is 50 μg / mL. The M13 primers used are forward 5′-AATCGTCATAAATATTCATTGAATCCCCtcattctcgttttctgaactg-3′(SEQ ID NO. 1, with the tail shown in caps and the variable position on the template after the Snapback hairpin is formed shown in bold), and reverse 5′-atgtttagactggatagcgt-3′ (SEQ ID NO. 2), which form a PCR product of about 130 bps.

[0060]PCR was performed in 10-ul reaction volumes with 50 mM Tris (pH 8.3), 500 μg / ml bovine serum albumin, 3 mM MCl2, 200 μM of each deoxynucle...

example 2

Snapback Primer Genotyping with an Extension Blocker Using Symmetric PCR

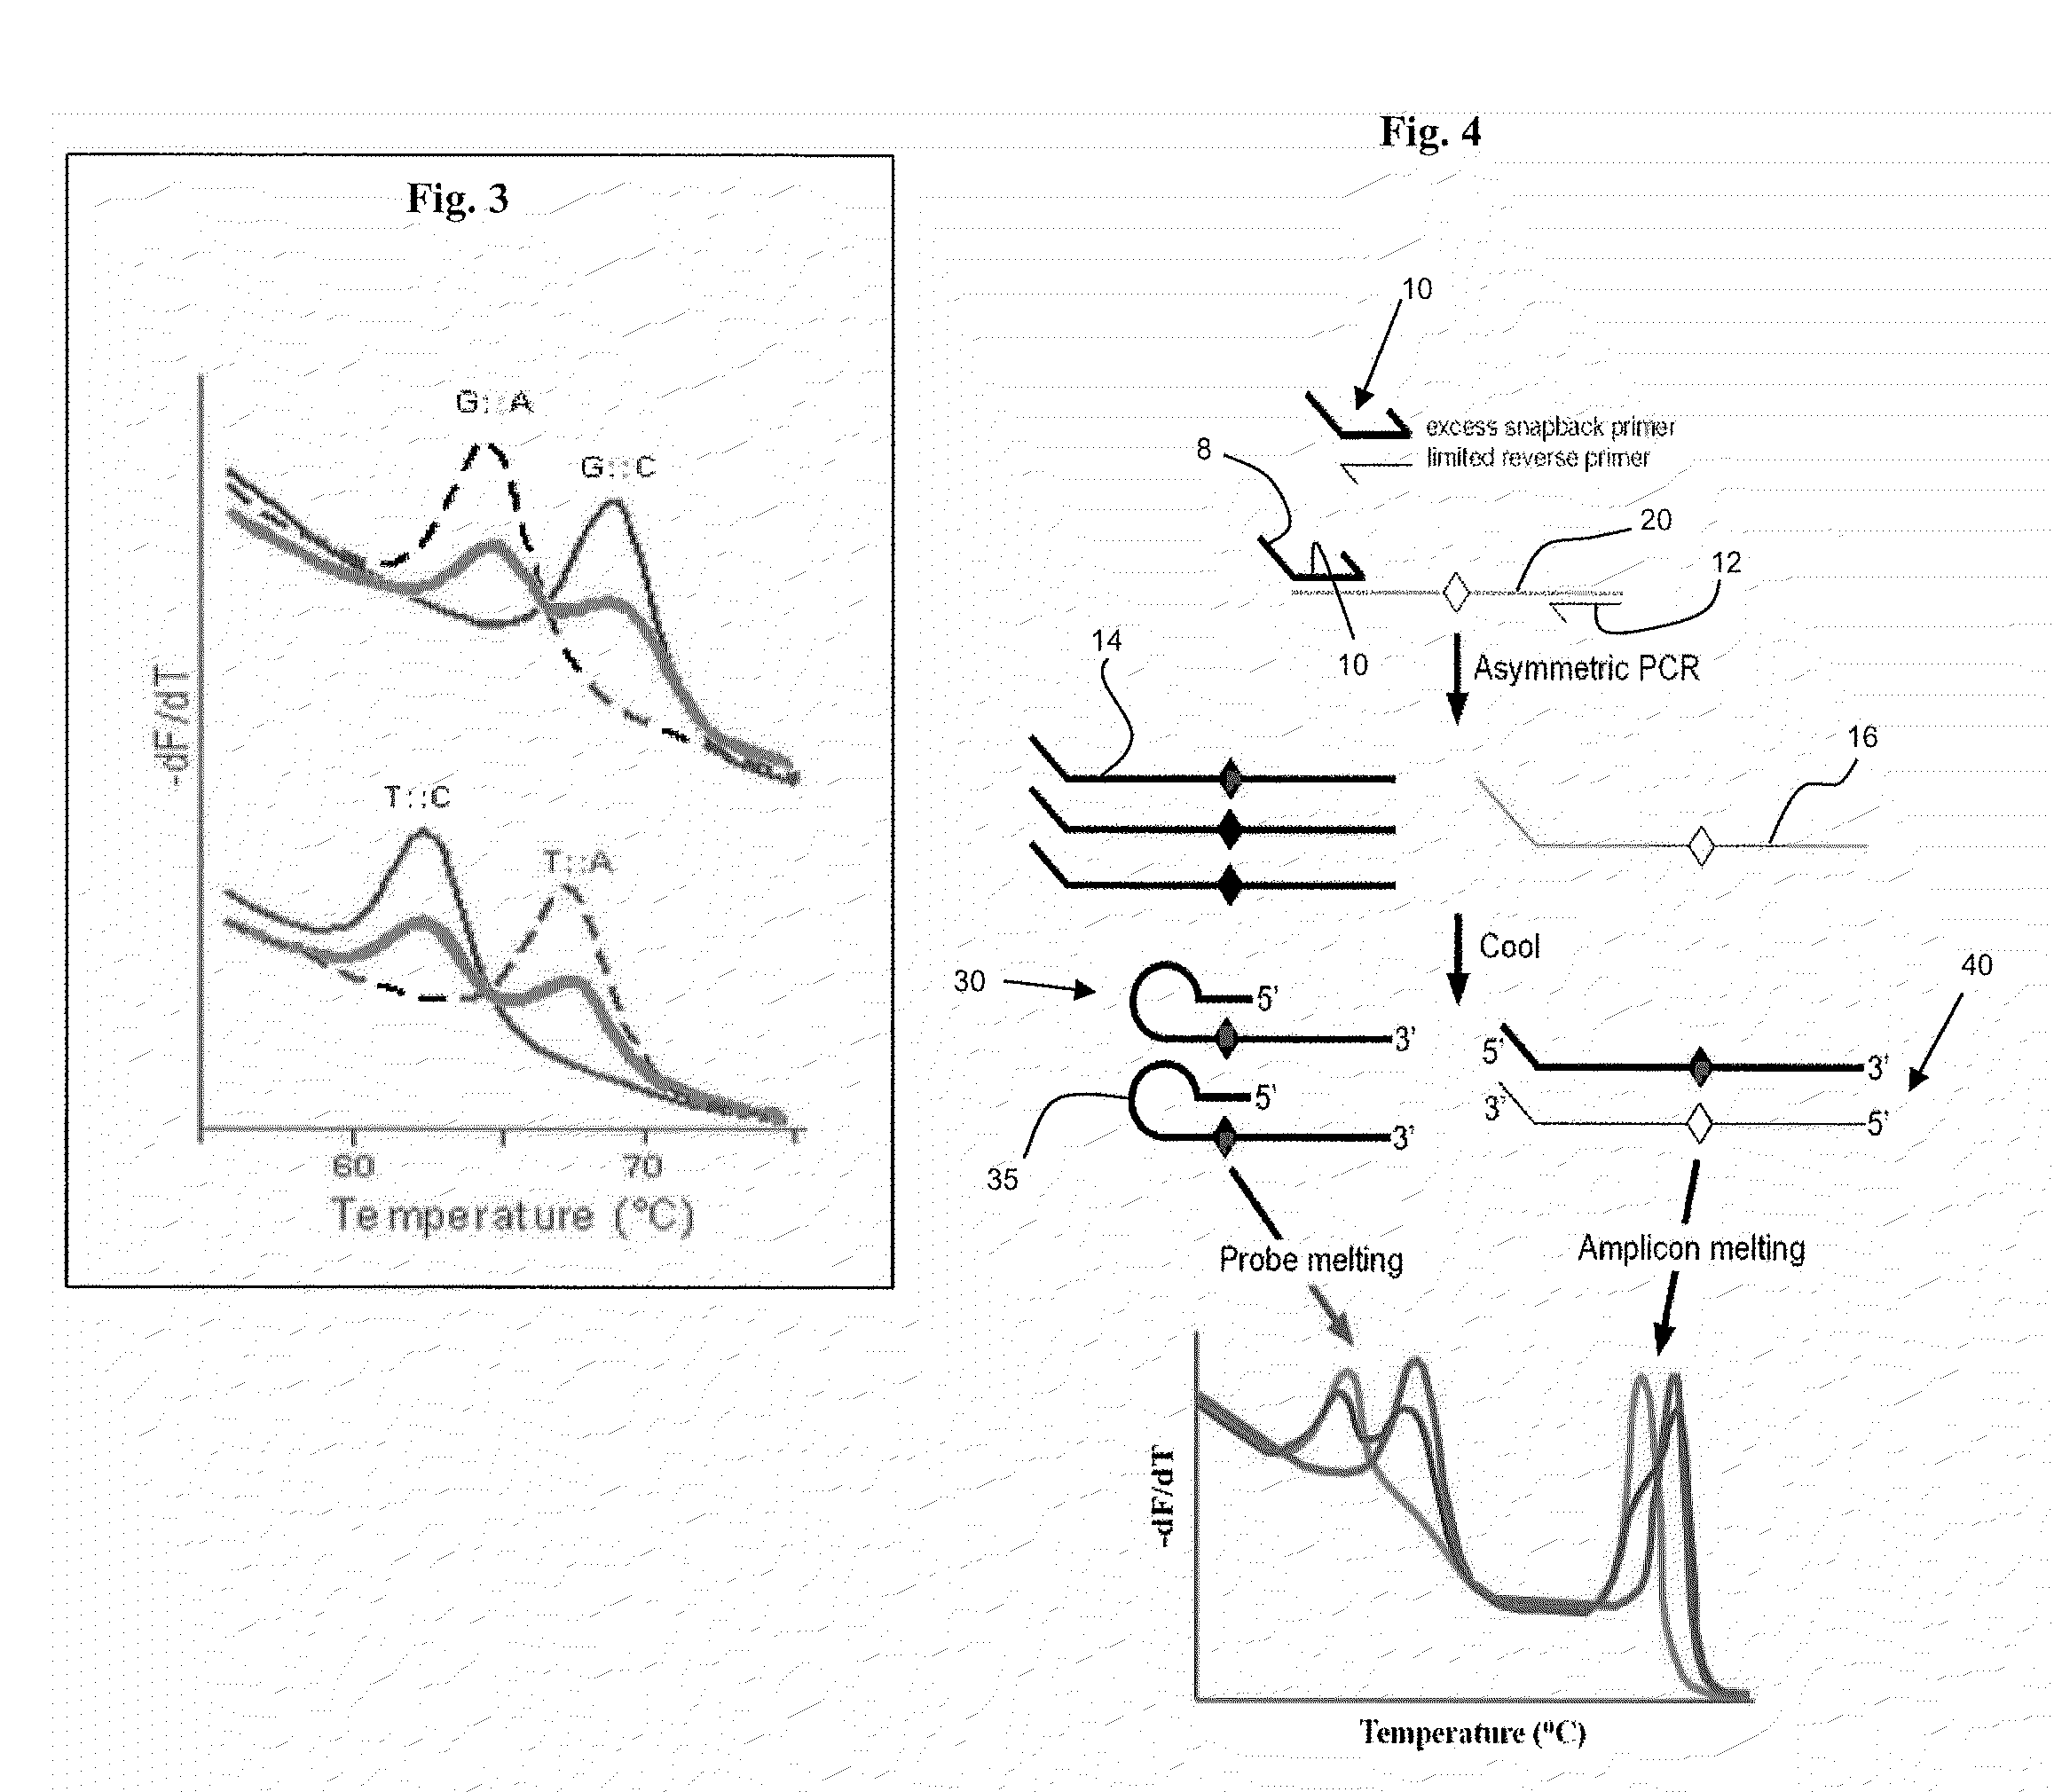
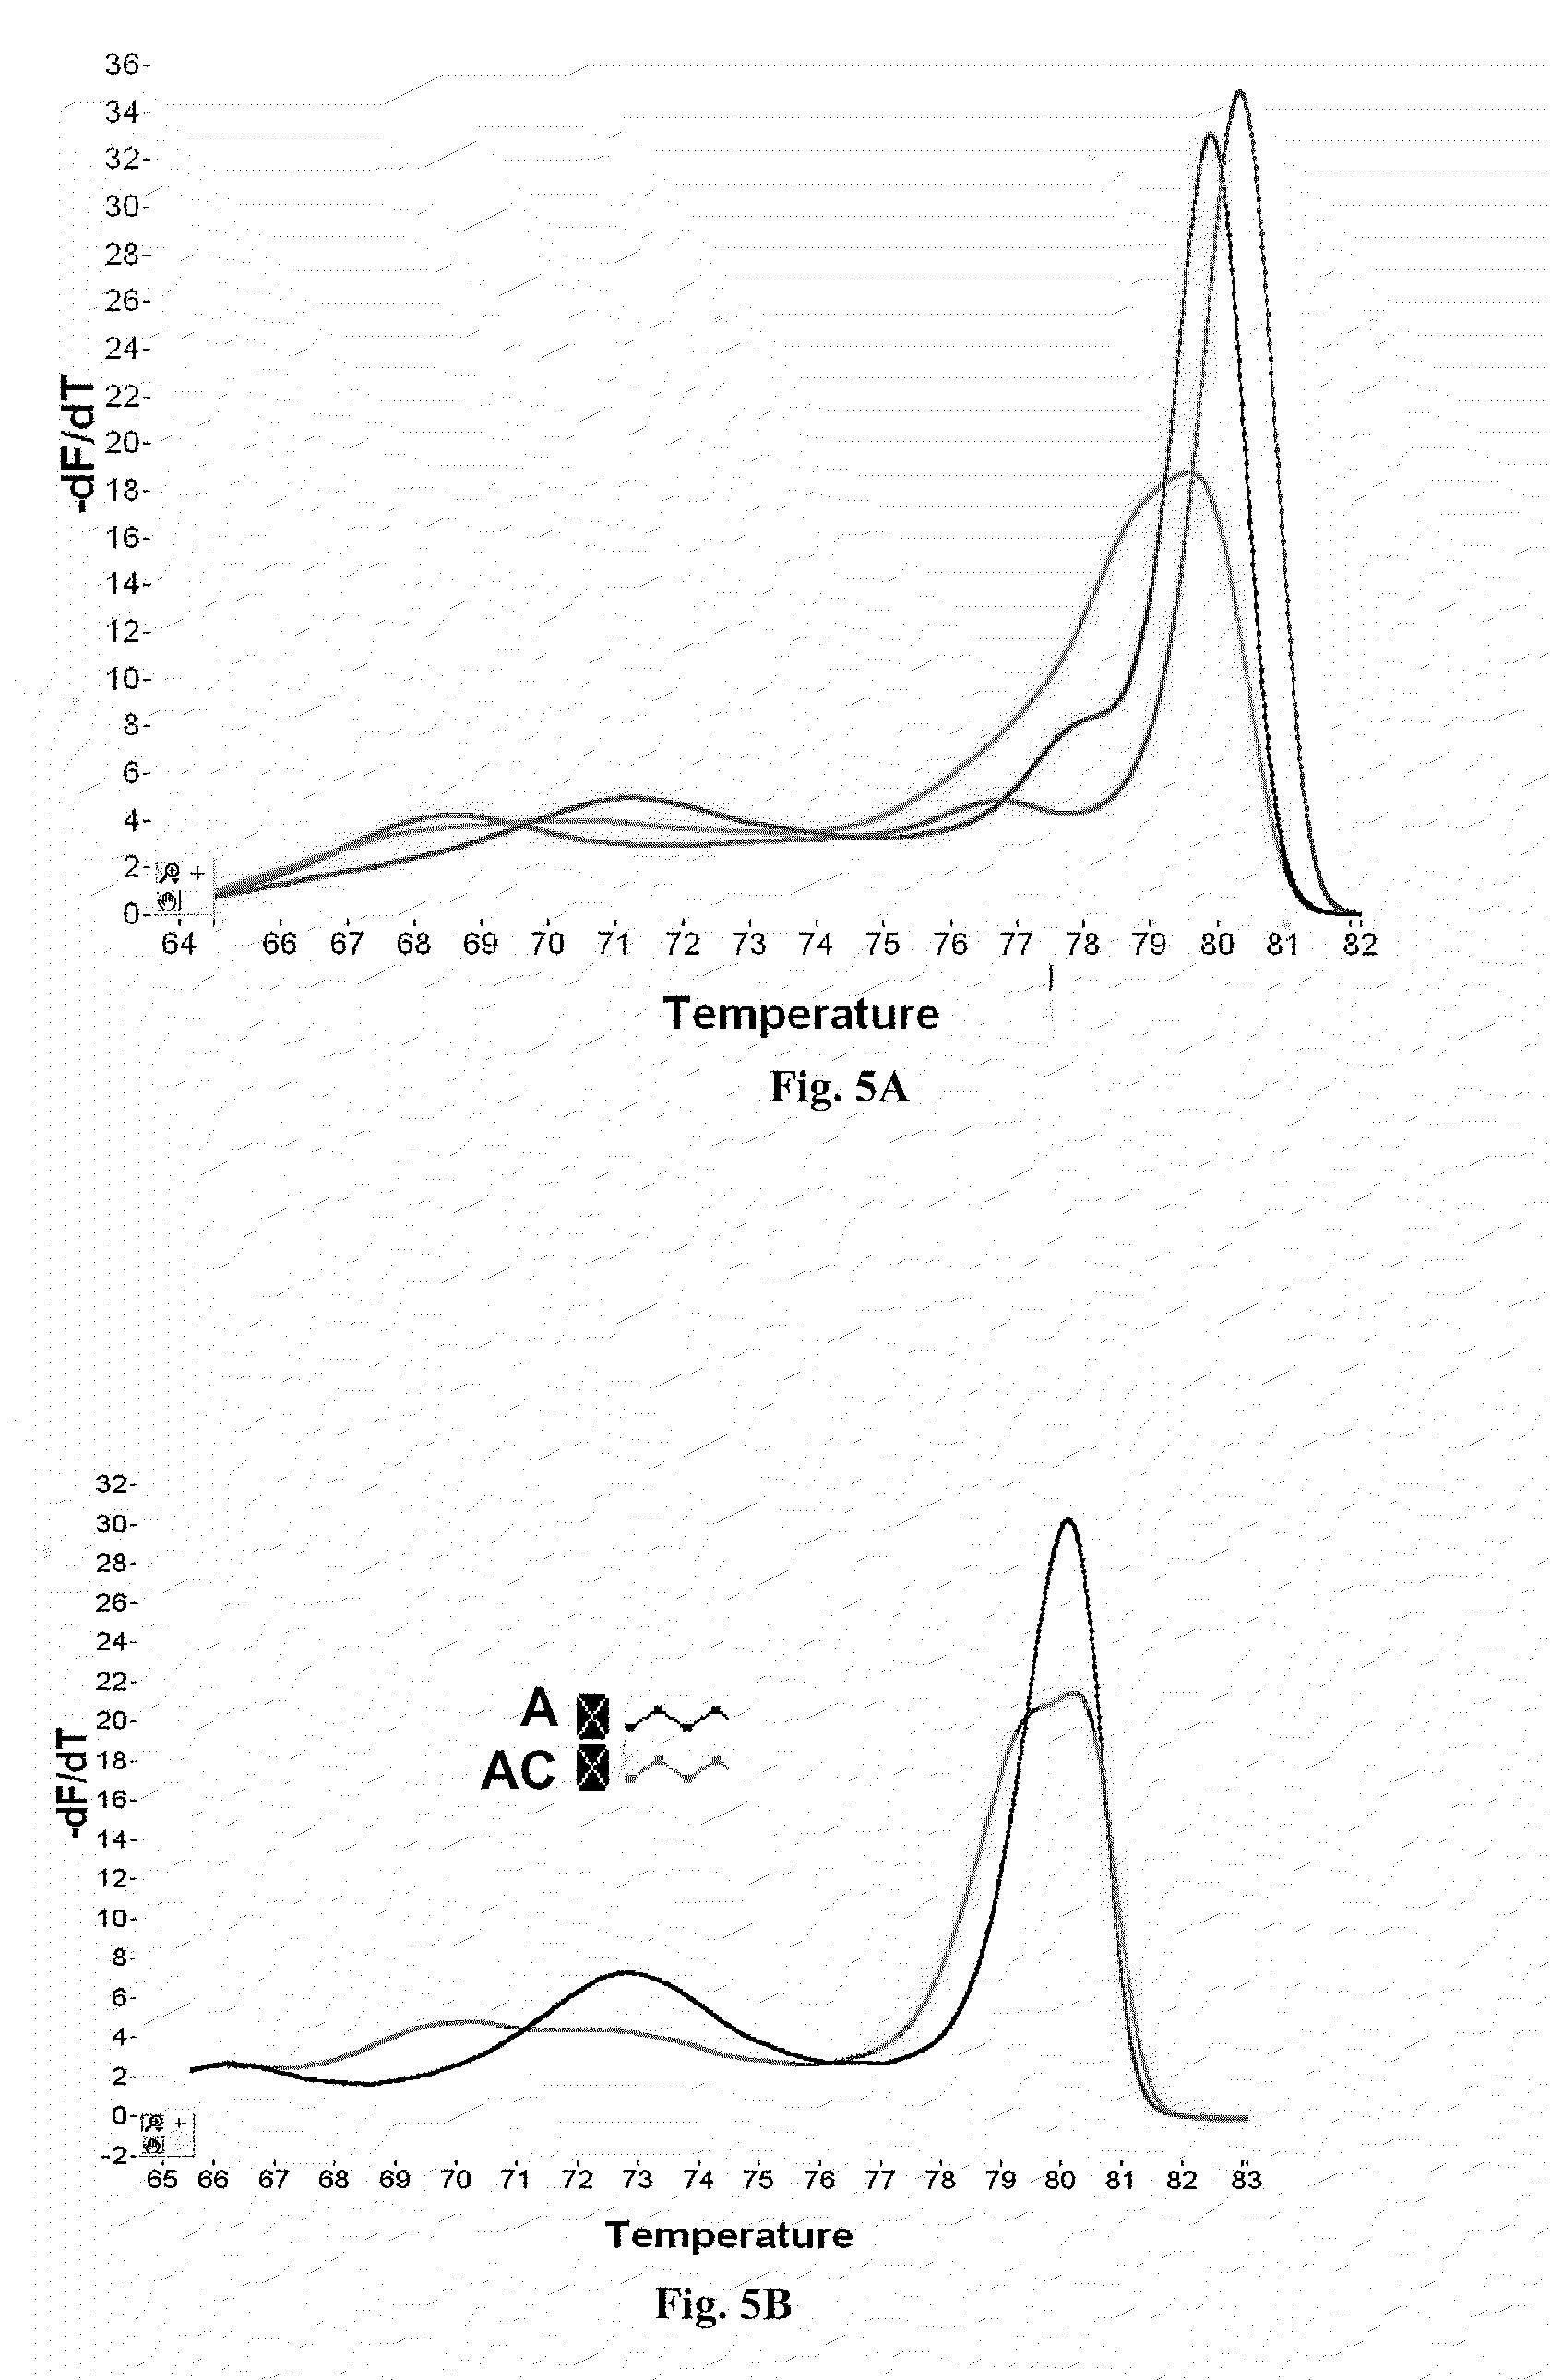
[0062]To increase Snapback primer loop formation and the height of the Snapback genotyping peaks (low temperature peaks) on derivative plots, an extension blocker was incorporated between the template-specific primer and the probe element of the Snapback primer. Shown as an “X” in the forward primer, the blocker used was an abasic tetrahydrofuran derivative incorporated as the dSpacer CE phosphoramidite available from Glen Research (cat. no. 10-1914-90). Ten contiguous dSpacer units were incorporated in order to ensure blockage of the polymerase. The primers used are forward 5′-AATCGTCATAAATATTCATTGAATCCCC(X)10tcattctcgattctgaactg-3′ (SEQ ID NO. 3, with tail shown in caps and variable position on the template after the Snapback hairpin is formed shown in bold), and reverse 5′-atgtttagactggatagcgt-3′ (SEQ ID NO. 4).

[0063]Both the “A” template and the “A / C” heterozygote of Example 1 were studied. PCR and melting w...

example 3

Effect of the Length of the Probe Element on the Signal of Snapback Primers after Asymmetric PCR

[0065]Different probe element lengths were investigated using asymmetric PCR. The M13 primers used are shown in Table 1, wherein upper case indicates the probe element tail, lower case defines the template-specific primer region, and the bold face base indicates the variable position on the template after the Snapback hairpin has formed.

TABLE 1NameLimiting Forward Primer (0.05 μM)1Ftcattctcgttttctgaactg (SEQ ID NO: 5)Snapback Reverse Primer (0.5 μM)1R6tailGAATATatgtttagactggatagcgt (SEQ ID NO: 6)1R8tailTGAATATTatgtttagactggatagcgt (SEQ ID NO: 7)1R10tailATGAATATTTatgtttagactggatagcgt (SEQ ID NO: 8)1R12tailAATGAATATTTAatgtttagactggatagcgt (SEQ ID NO: 9)1R14tailCAATGAATATTTATatgtttagactggatagcgt (SEQ ID NO: 10)1R16tailTCAATGAATATTTATGatgtttagactggatagcgt (SEQ ID NO: 11)1R18tailTTCAATGAATATTTATGAatgtttagactggatagcgt (SEQ ID NO: 12)1R20tailATTCAATGAATATTTATGACatgtttagactggatagcgt (SEQ ID NO: 1...


PUM

PropertyMeasurementUnit
melting temperaturesaaaaaaaaaa
Tmaaaaaaaaaa
temperaturesaaaaaaaaaa

Abstract

Methods and kits are provided for nucleic acid analysis. In an illustrative method a target nucleic acid is amplified using a first primer and a second primer, wherein the first primer comprises a probe element specific for a locus of the target nucleic acid and a template-specific primer region, and the probe element is 5′ of the template-specific primer region, subsequently allowing the probe element to hybridize to the locus to form a hairpin, generating a melting curve for the probe element by measuring fluorescence from a dsDNA binding dye as the mixture is heated, wherein the dye is not covalently bound to the first primer, and analyzing the shape of the melting curve. Kits may include one or more of the first and second primers, the dsDNA binding dye, a polymerase, and dNTPs.

Description

PRIORITY[0001]This application claims priority to U.S. Provisional Patent Application No. 60 / 905,721 filed on 8 Mar. 2007, titled Primers for Melting Analysis, the entirety of which is incorporated herein by reference.BACKGROUND OF THE INVENTION[0002]The human genome project has succeeded in sequencing most regions of human DNA. Work to identify the genes and sequence alterations associated with disease continues at a rapid pace. Linkage studies are used to associate phenotype with genetic markers such as simple sequence repeats or single nucleotide polymorphisms (SNPs) to identify candidate genes. Sequence alterations including SNPs, insertions, and deletions that cause missense, frameshift, or splicing mutations then may be used to pinpoint the gene and the spectrum of responsible mutations.[0003]However, even when the genetic details become known, it is difficult to use this knowledge in routine medical practice, in large part because the methods to analyze DNA are expensive and ...

Claims


Application Information

Patent Timeline
Patent Type & Authority Applications(United States)
IPC IPC(8): C12Q1/68
CPCC12Q1/6816C12Q1/6827C12Q1/6858C12Q2525/301C12Q2527/107C12Q2531/107C12Q1/6818
Inventor WITTWER, CARL T.ZHOU, LUMINGPORITZ, MARK AARON
Owner BIOFIRE DEFENSE
Why Eureka
Try Eureka