Method for determining the production parameters for a substrate coating process
a technology of substrate coating and production parameters, which is applied in the direction of process and machine control, adaptive control, instruments, etc., can solve the problems of non-termination of cationic active centers, uneconomic use of free radical polymerization coating processes, and uv polymerization suffers
- Summary
- Abstract
- Description
- Claims
- Application Information
AI Technical Summary
Benefits of technology
Problems solved by technology
Method used
Image
Examples
example 1
Characterization of Shadow Cure
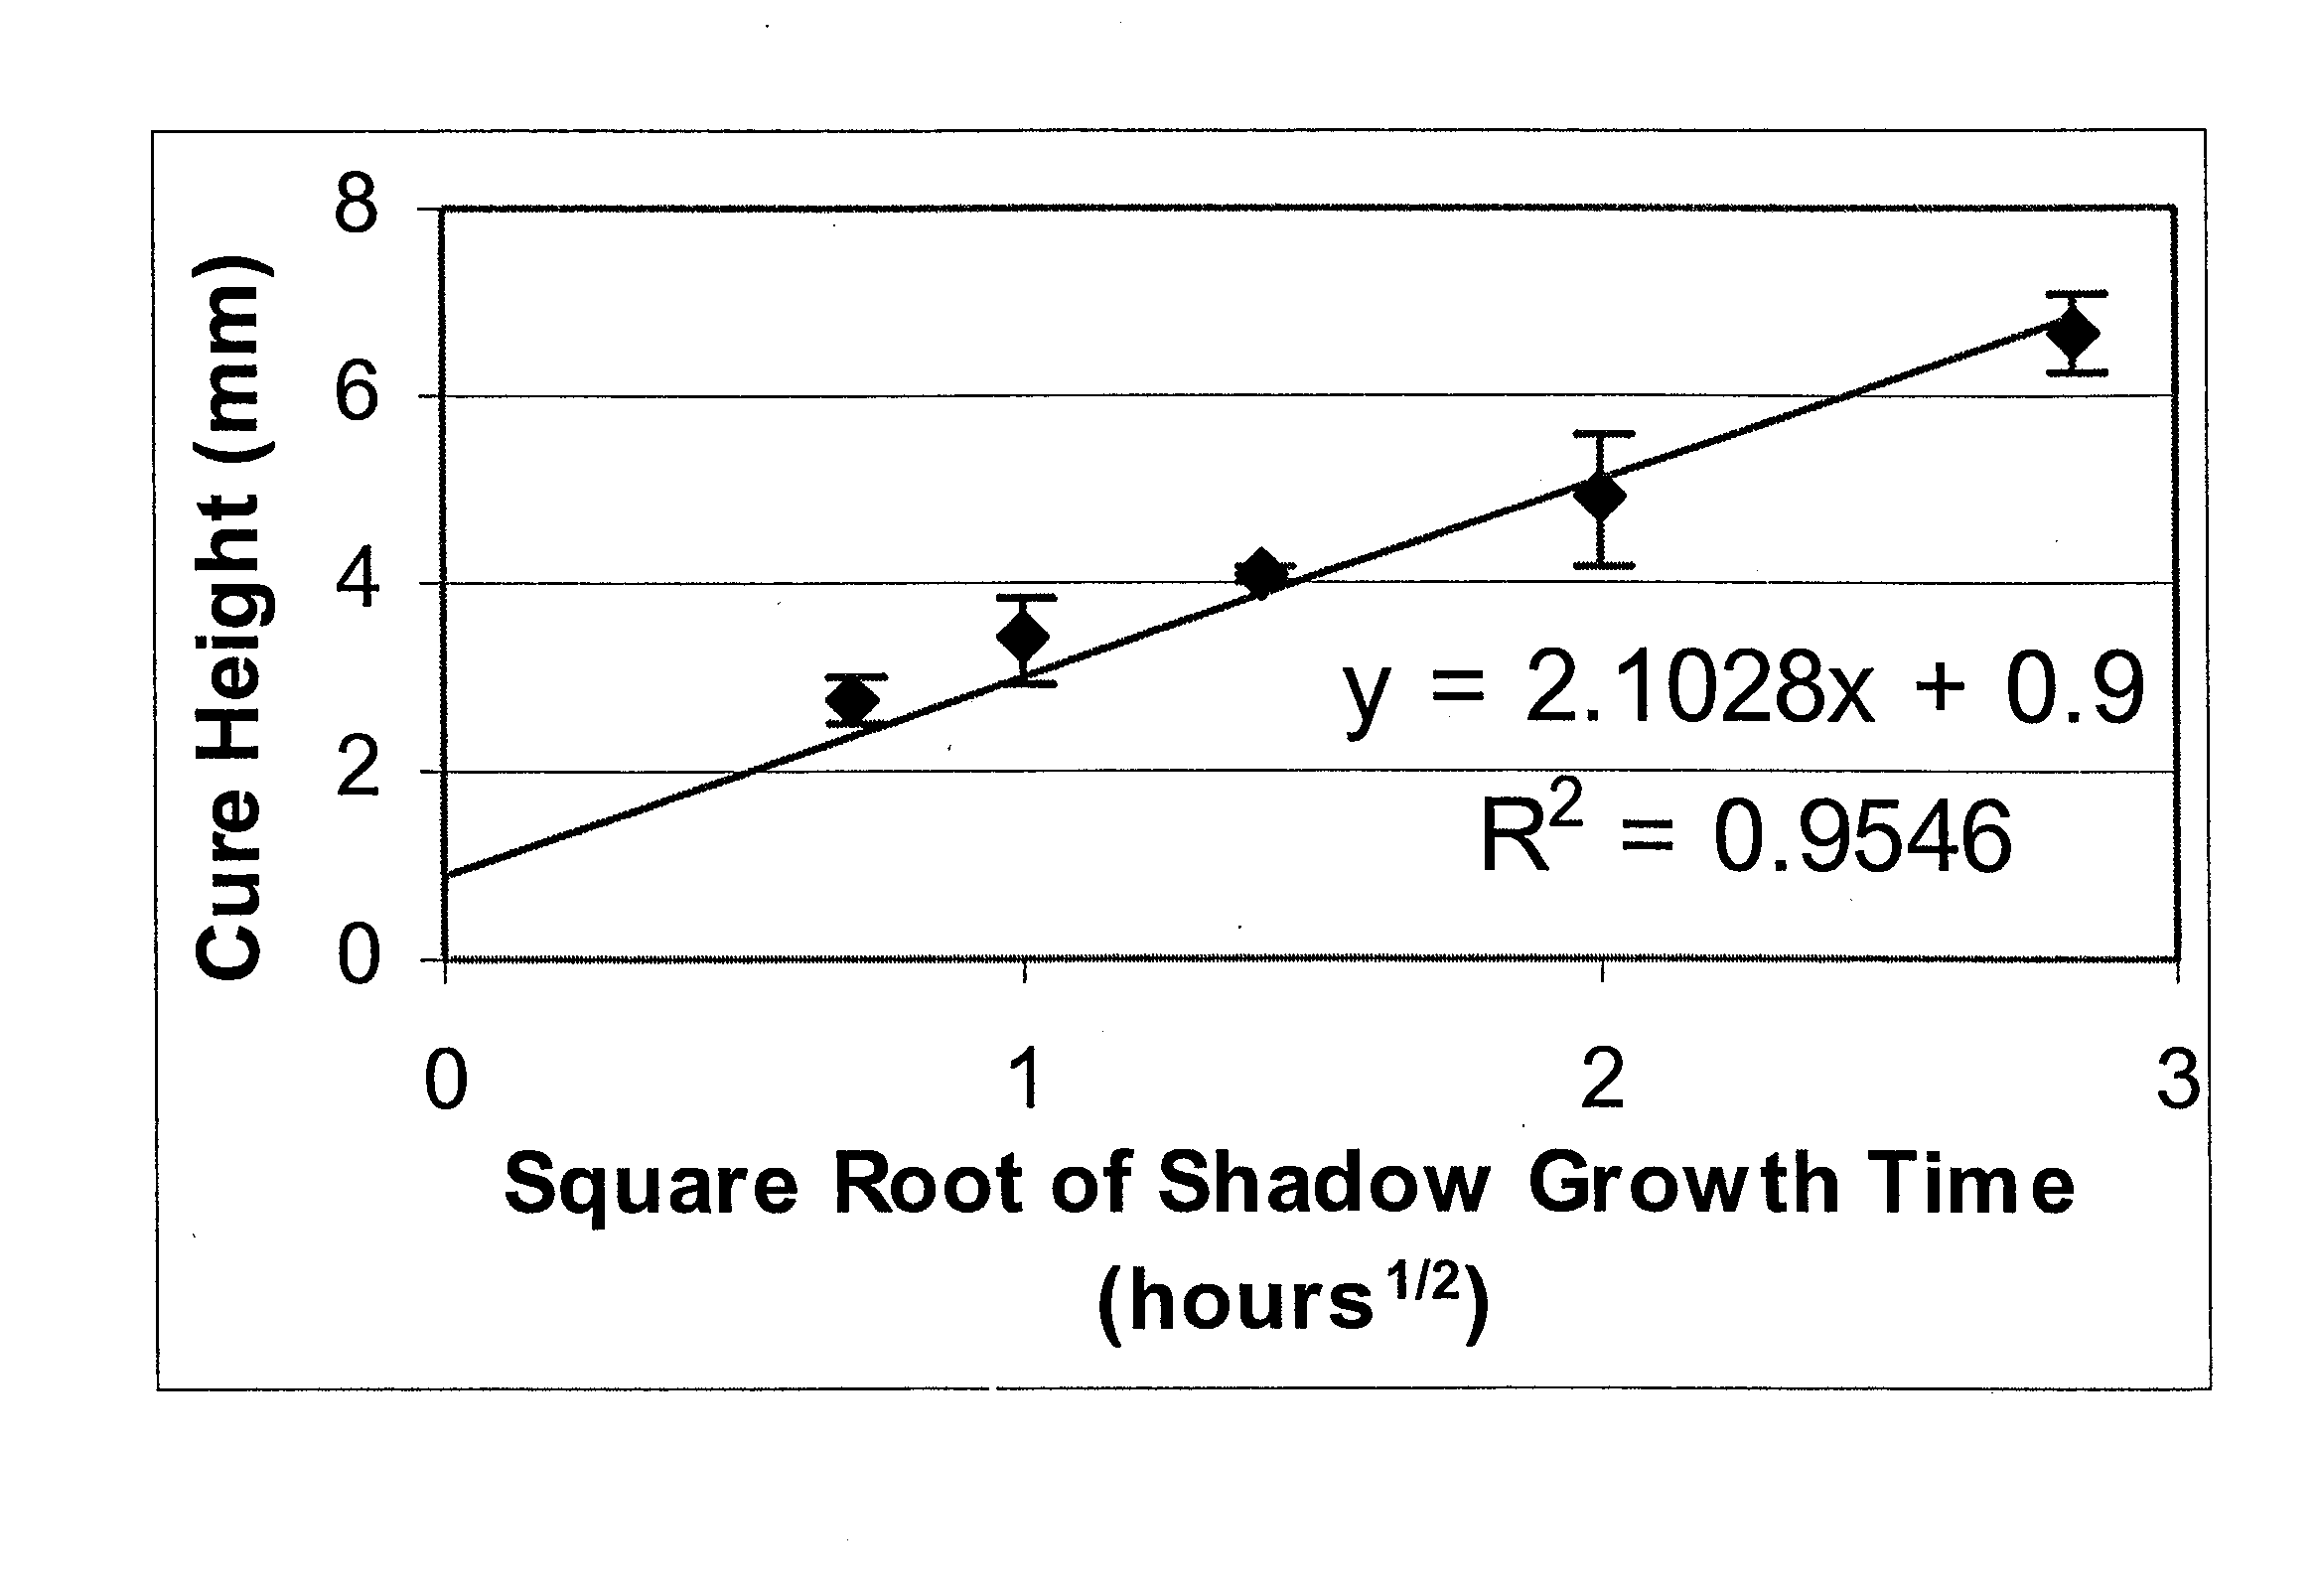
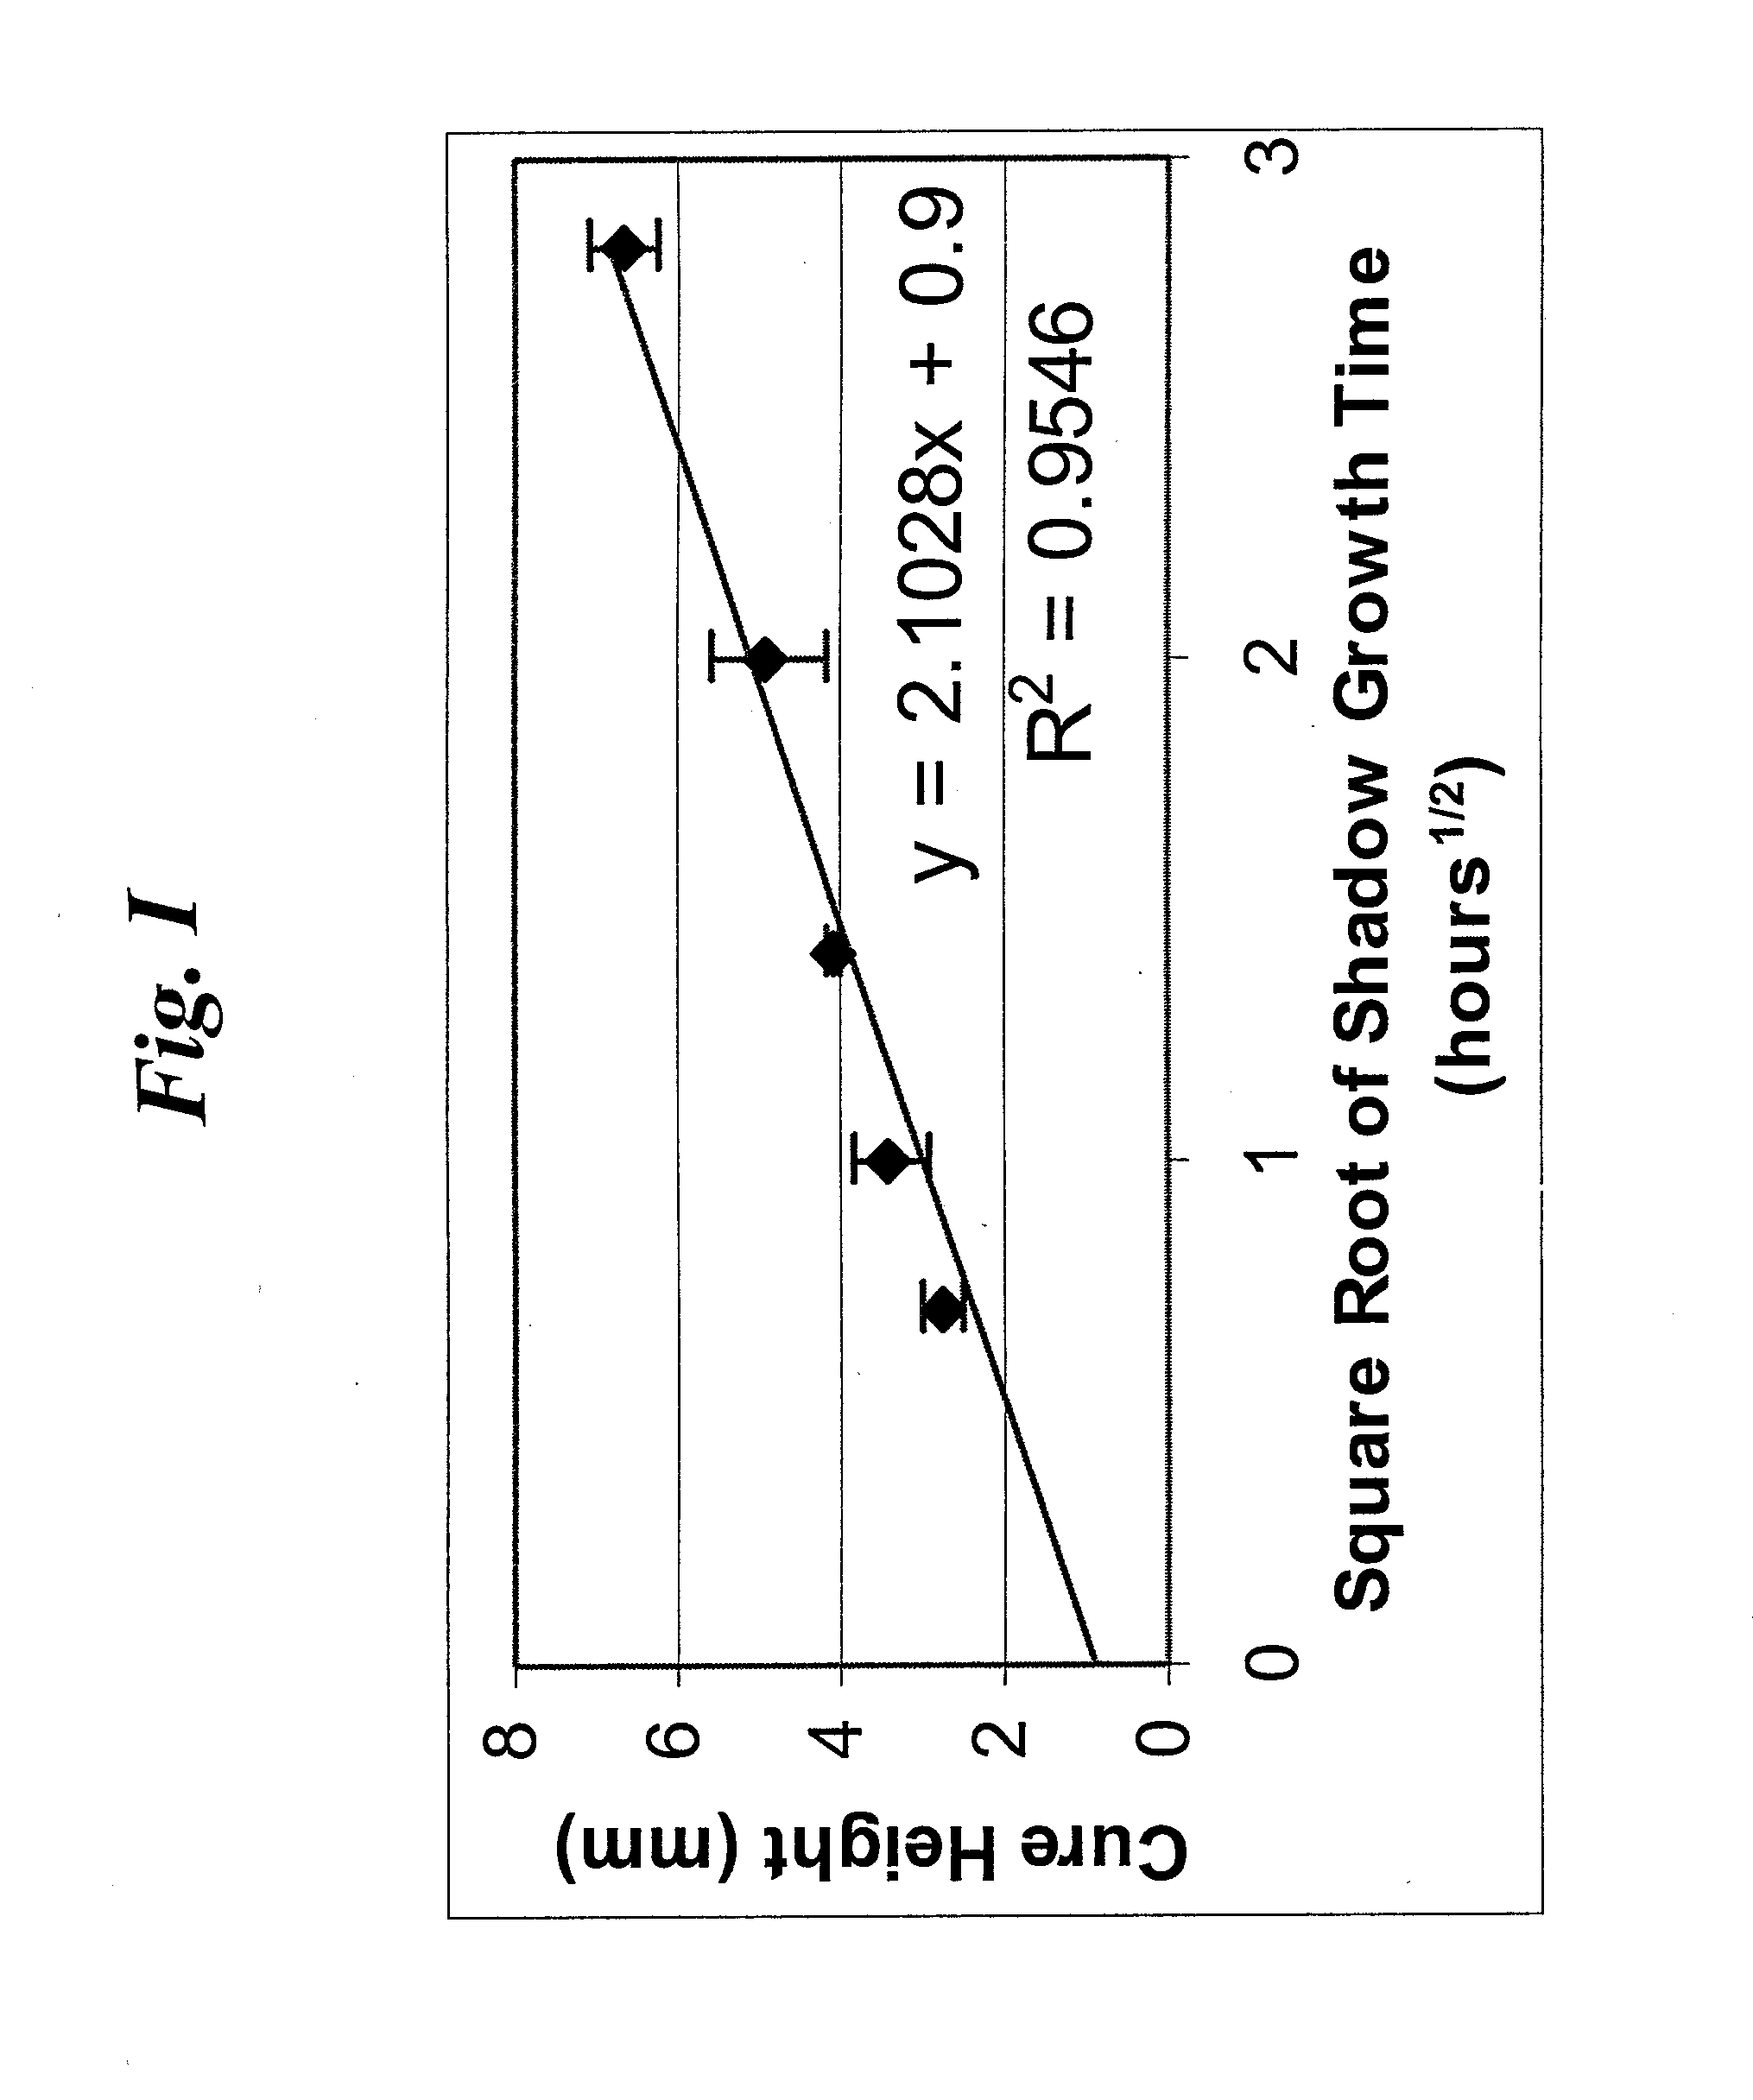
[0112]The extent of shadow cure as a function of time was determined for a system containing 3,4-epoxy-cyclohexylmethanyl 3,4-epoxycyclohexane-carboxylate (CADE) as monomer and 0.5 mol % (tolylcumyl)iodonium tetrakis (pentafluorophenyl) borate (IPB) as initiator. The exposure time was 5 minutes at 25° C., while the shadow cure temperature was 50° C. The experiments were performed using disposable polystyrene cuvettes which were chosen because they are transparent to the wavelength of interest but may readily be dissolved to determine where polymerization occurred. Each monomer-filled cuvette was illuminated from below with the light from a 200 W Hg / Xe lamp for a prescribed duration. A typical exposure time was five minutes. Since the density of the formed polymer is greater than the reaction mixture, illumination from below avoided polymerization-induced convection or mixing. After this exposure, the system was maintained at the prescribed temperature ...
example 2
Determination of Effect of Temperature on the Observed Shadow Cure Distance
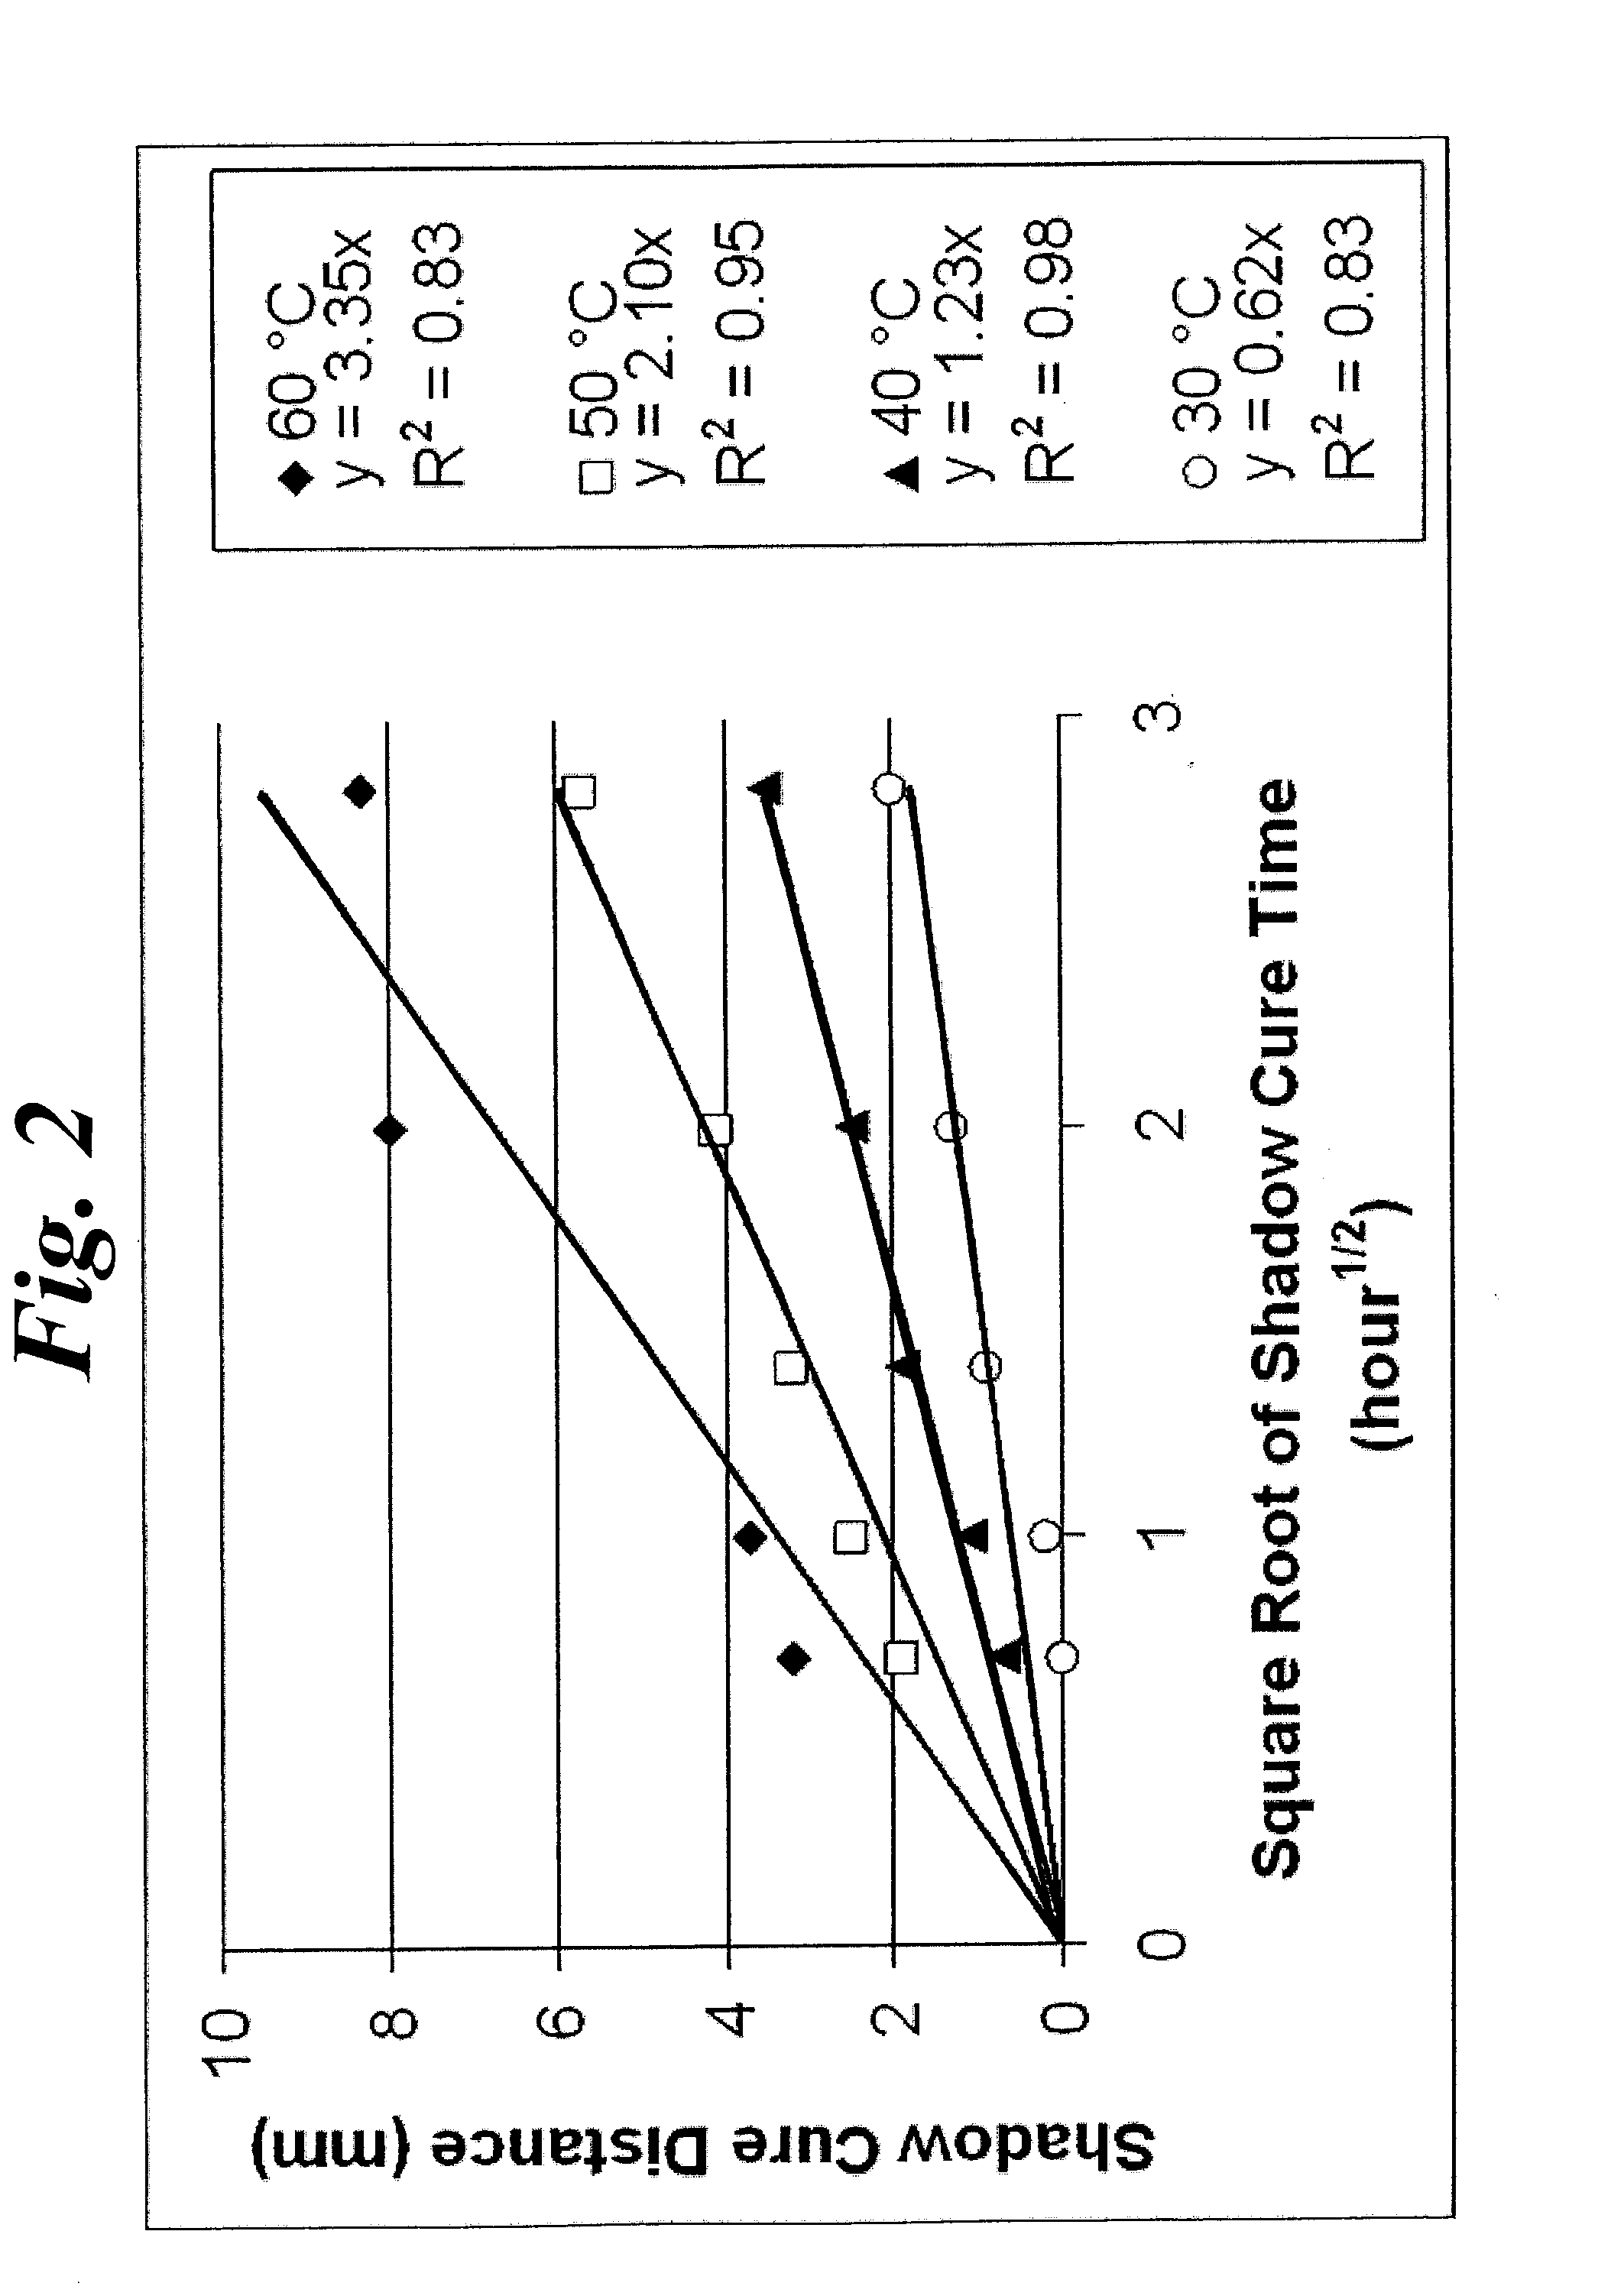
[0115]A series of experiments were performed to determine the effect of temperature on the observed shadow cure distance. Experimental results are shown in FIG. 2.
[0116]For each temperature shown in FIG. 2, the shadow cure distance increased in a manner proportional to the square root of the shadow cure time (Equation 1). In addition, the diffusion coefficient (indicated by the slope of the line, which corresponds to the square root of 4D / π) increased with increasing temperature. The temperature dependence of the effective shadow cure diffusion coefficient is illustrated in FIG. 3 and is well described by the Arrhenius equation. As the temperature was increased, the polymer chains became more mobile and allowed the active centers to progress easier to the leading edge of the polymer sample. The diffusion coefficient followed an Arrhenius dependence on the temperature as shown in FIG. 3.
example 3
Movement of Active Center Concentration with Illumination Time
[0117]Active center concentration profiles calculated for standard experimental conditions are shown in FIG. 4. These modeling results illustrate that the photoinitiator is completely consumed at the illuminated surface of the sample (the maximum photoinitiator concentration is equal to the photoinitiator concentration (0.0262 moles / liter) since each photoinitiator molecule leads to the formation of a single active center. The distance of light penetration into the sample (and corresponding active center production) increased with increasing time, with a sharp drop in active center concentration to a value of zero at the leading edge of the illumination.
PUM
| Property | Measurement | Unit |
|---|---|---|
| depth | aaaaa | aaaaa |
| depth | aaaaa | aaaaa |
| width | aaaaa | aaaaa |
Abstract
Description
Claims
Application Information
 - R&D
- Intellectual Property
- Life Sciences
- Materials
- Tech Scout
- Unparalleled Data Quality
- Higher Quality Content
- 60% Fewer Hallucinations
Browse by: Latest US Patents, China's latest patents, Technical Efficacy Thesaurus, Application Domain, Technology Topic, Popular Technical Reports.
© 2025 PatSnap. All rights reserved.Legal|Privacy policy|Modern Slavery Act Transparency Statement|Sitemap|About US| Contact US: help@patsnap.com


