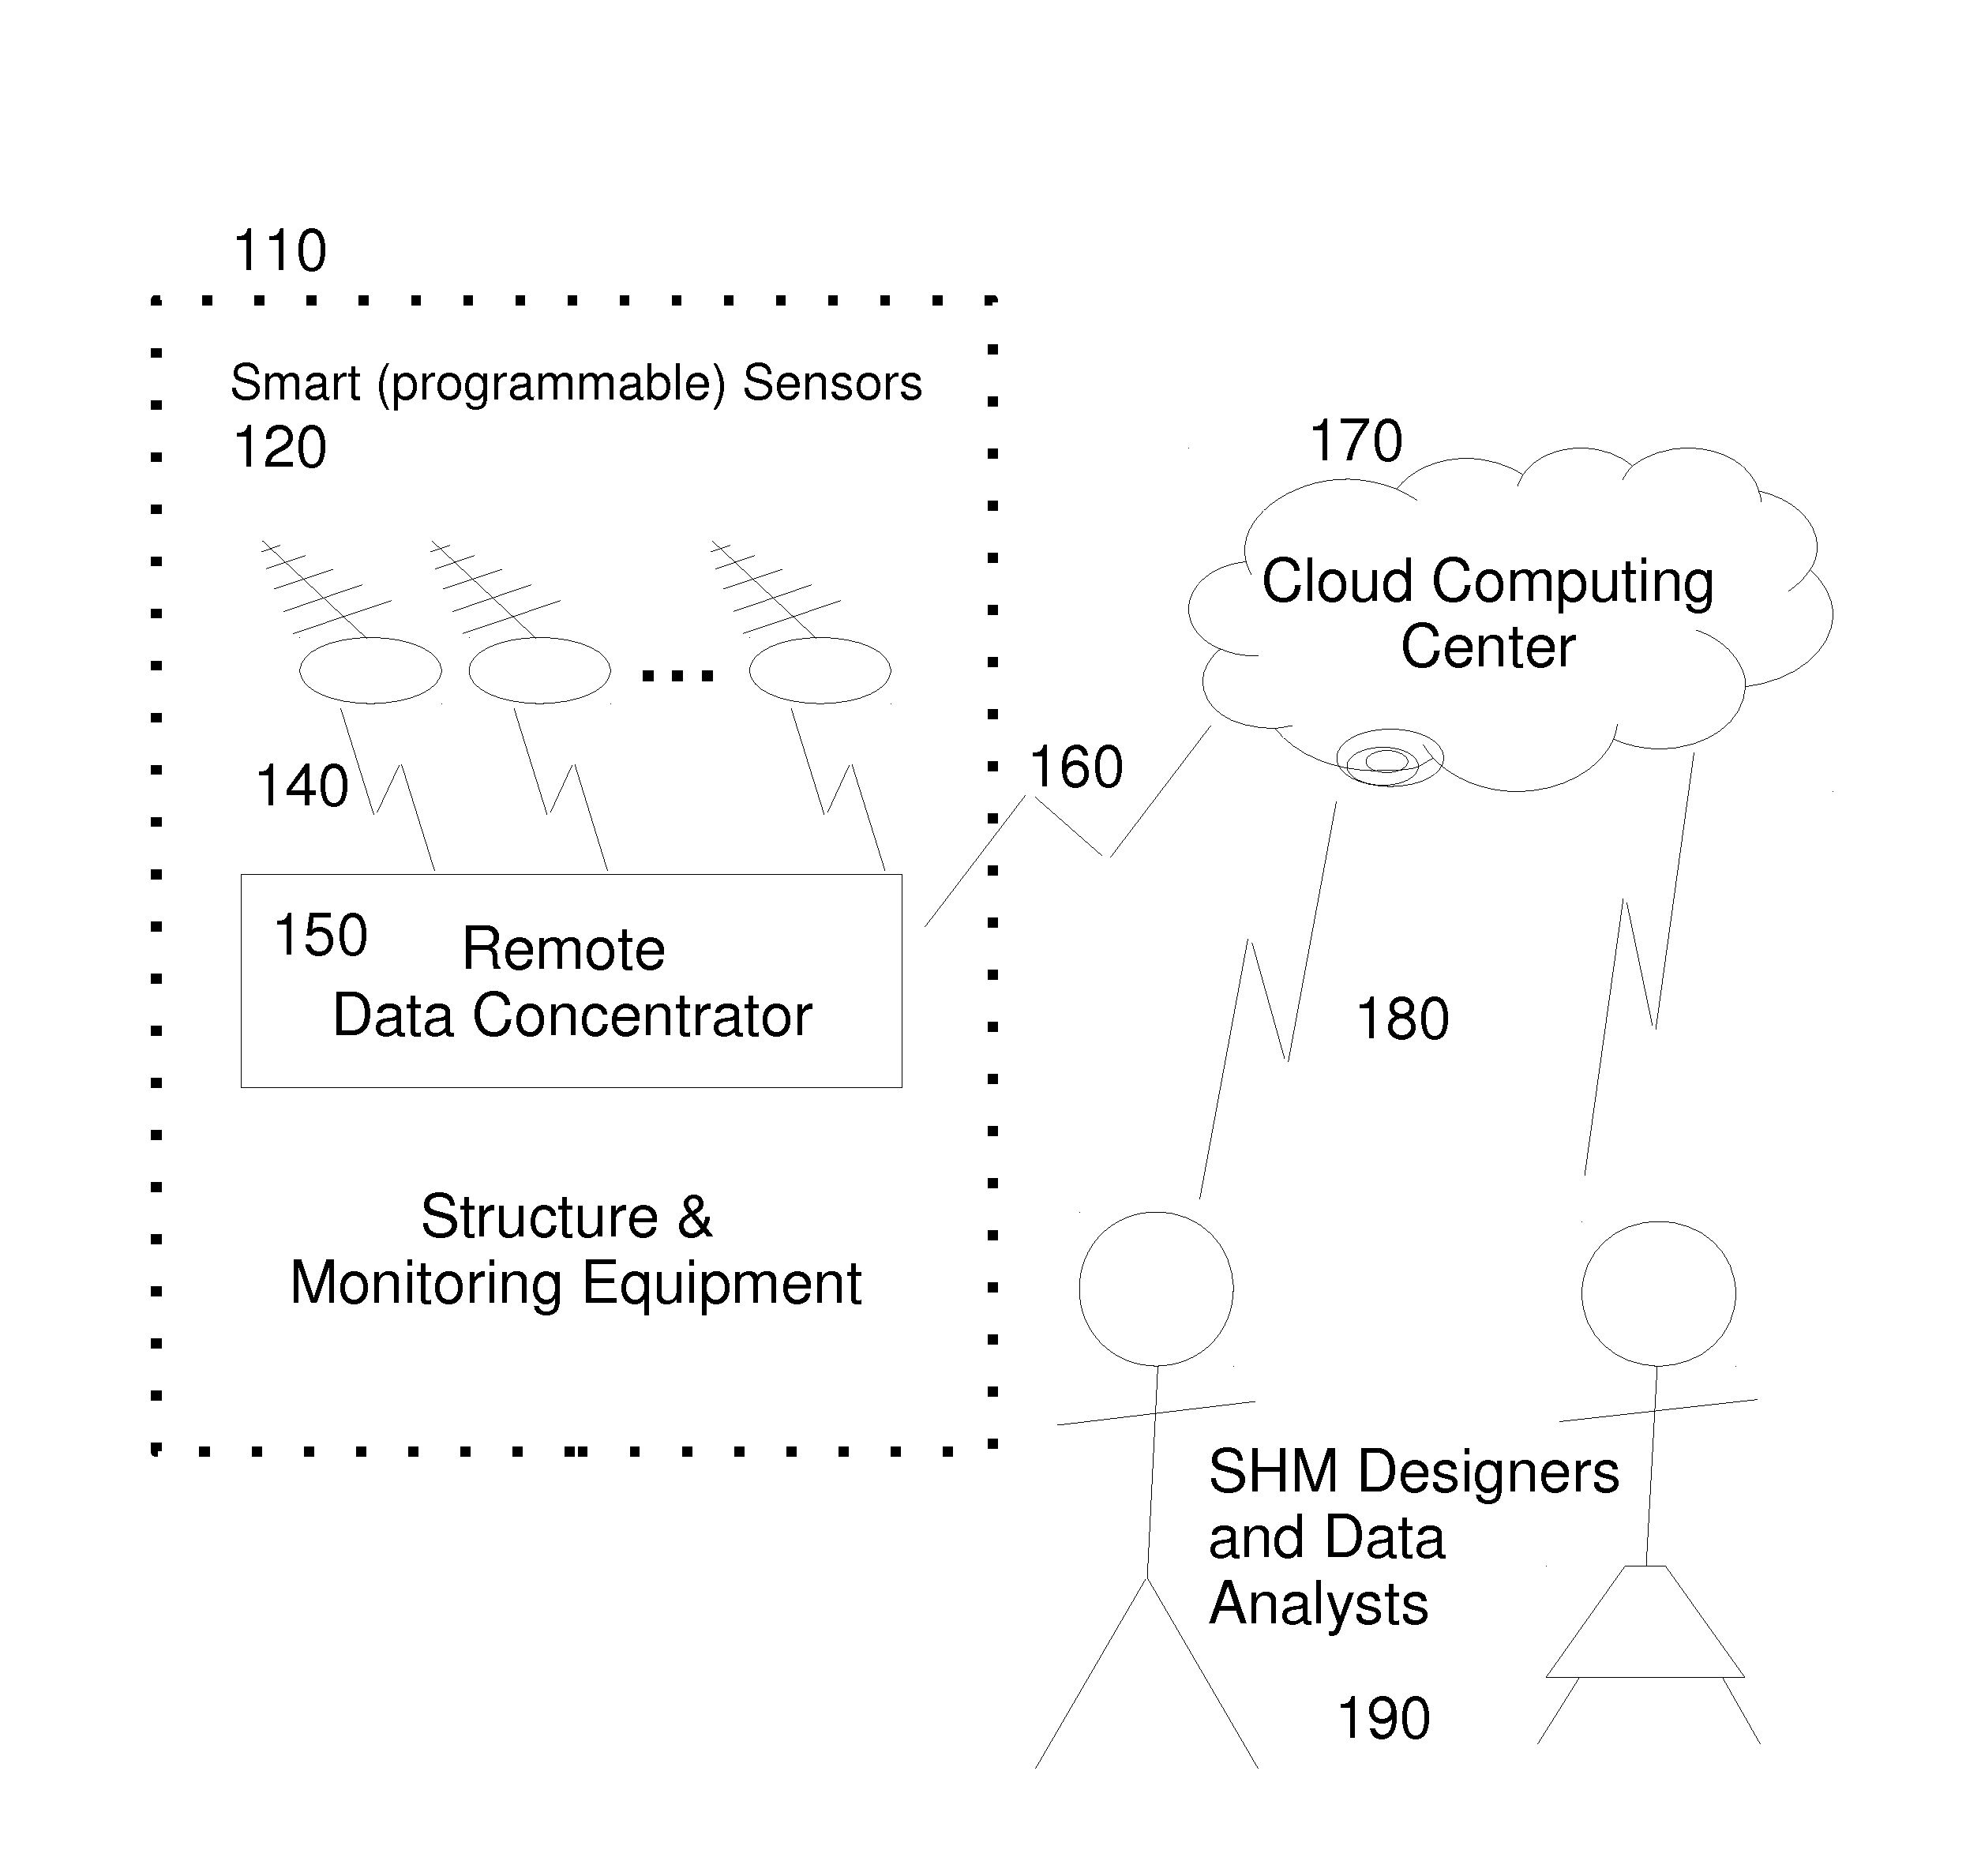
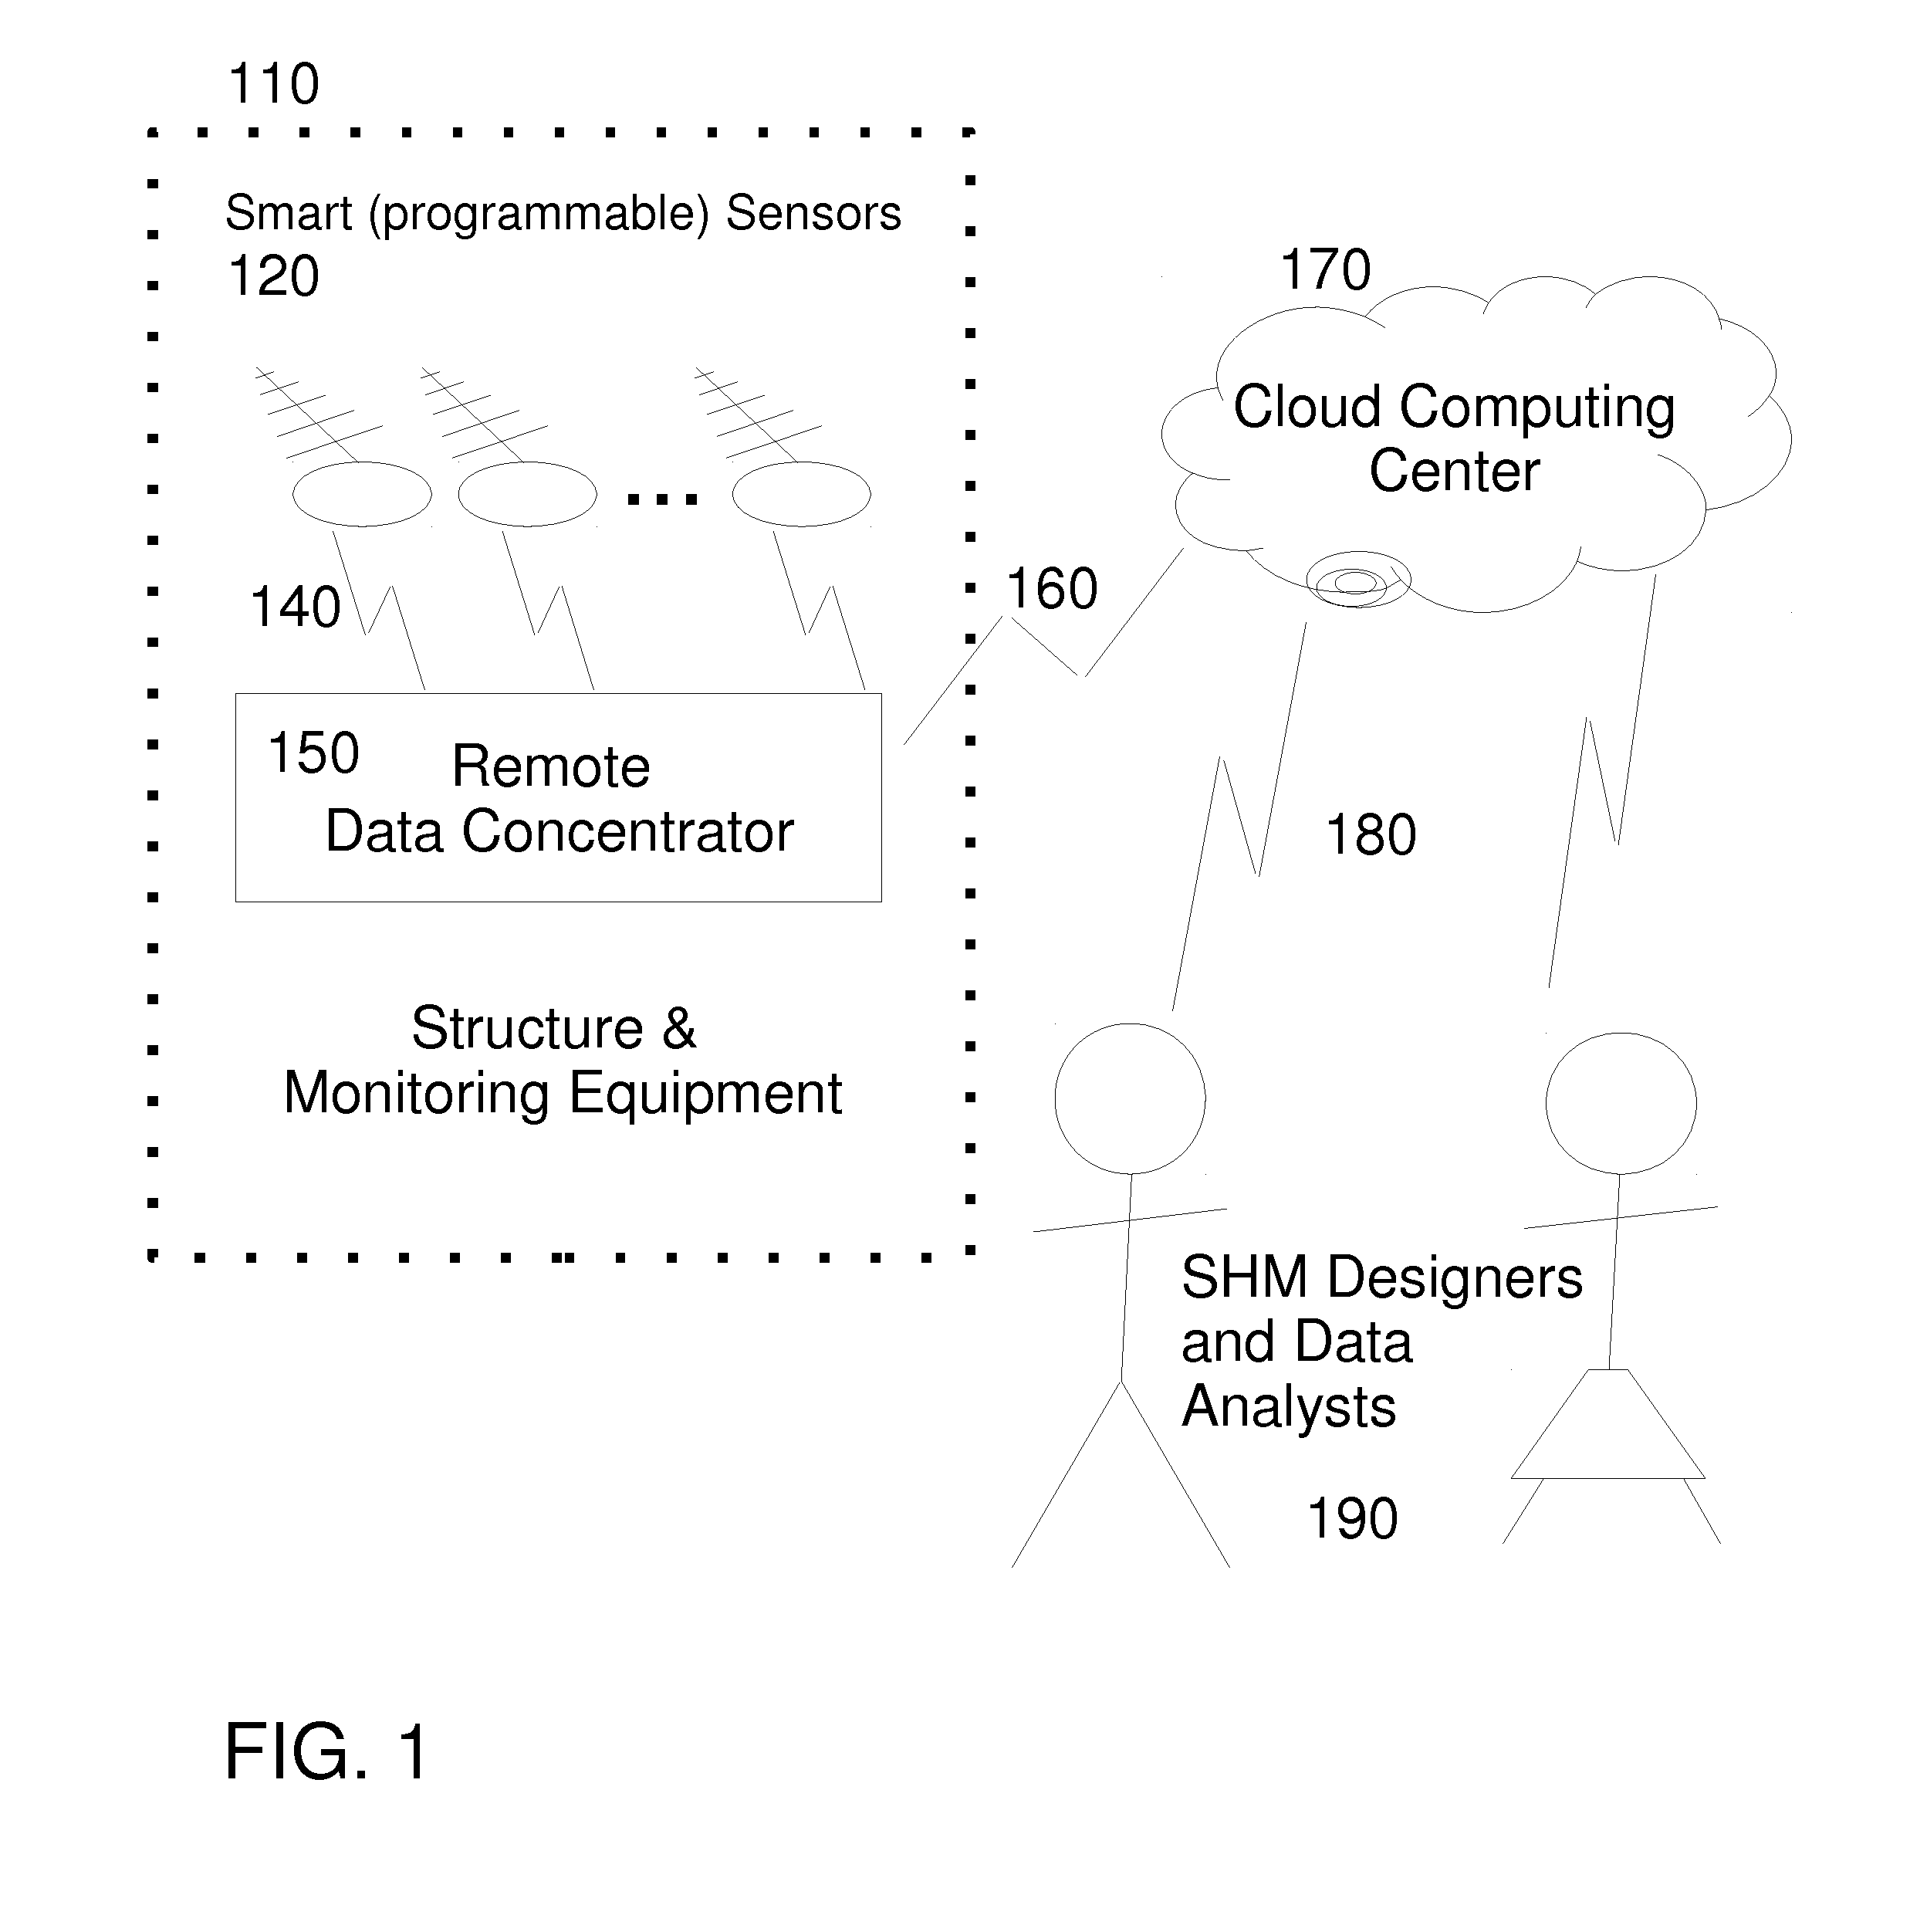
[0031]New computer and sensor technologies provide vast opportunities to improve the productivity of human activities through better monitoring and control of all kinds of processes. The major factor limiting the increased use of these technologies is the limited understanding that potential beneficiaries of such monitoring have of the details of design and use of such monitoring systems. Our software is designed to make it easier for hobbyists, engineering students, practicing engineers and others to learn the principles of monitoring and apply them in applications of interest to them. As more people become better able to understand and use monitoring technologies, the rate of growth in use of those technologies will increase. This in turn can be expected to contribute to better decisions regarding how to get more value from existing investments at a lower total cost.
[0032]A portion of this software deals with the cost of data communications and storage. This is a major issue, especially with modern smart and wireless sensors deployed in remote locations where the electrical power budget is a major portion of the cost. Existing computer and sensor technology can support collecting data much faster than is needed most of the time and faster than can be justified economically generally, storing numbers with apparent precision far beyond the actual accuracy of the measurement equipment. The present patent application appears to be unique in decomposing monitoring data conceptually into (a) important information, (b) unimportant information, and (c) noise:
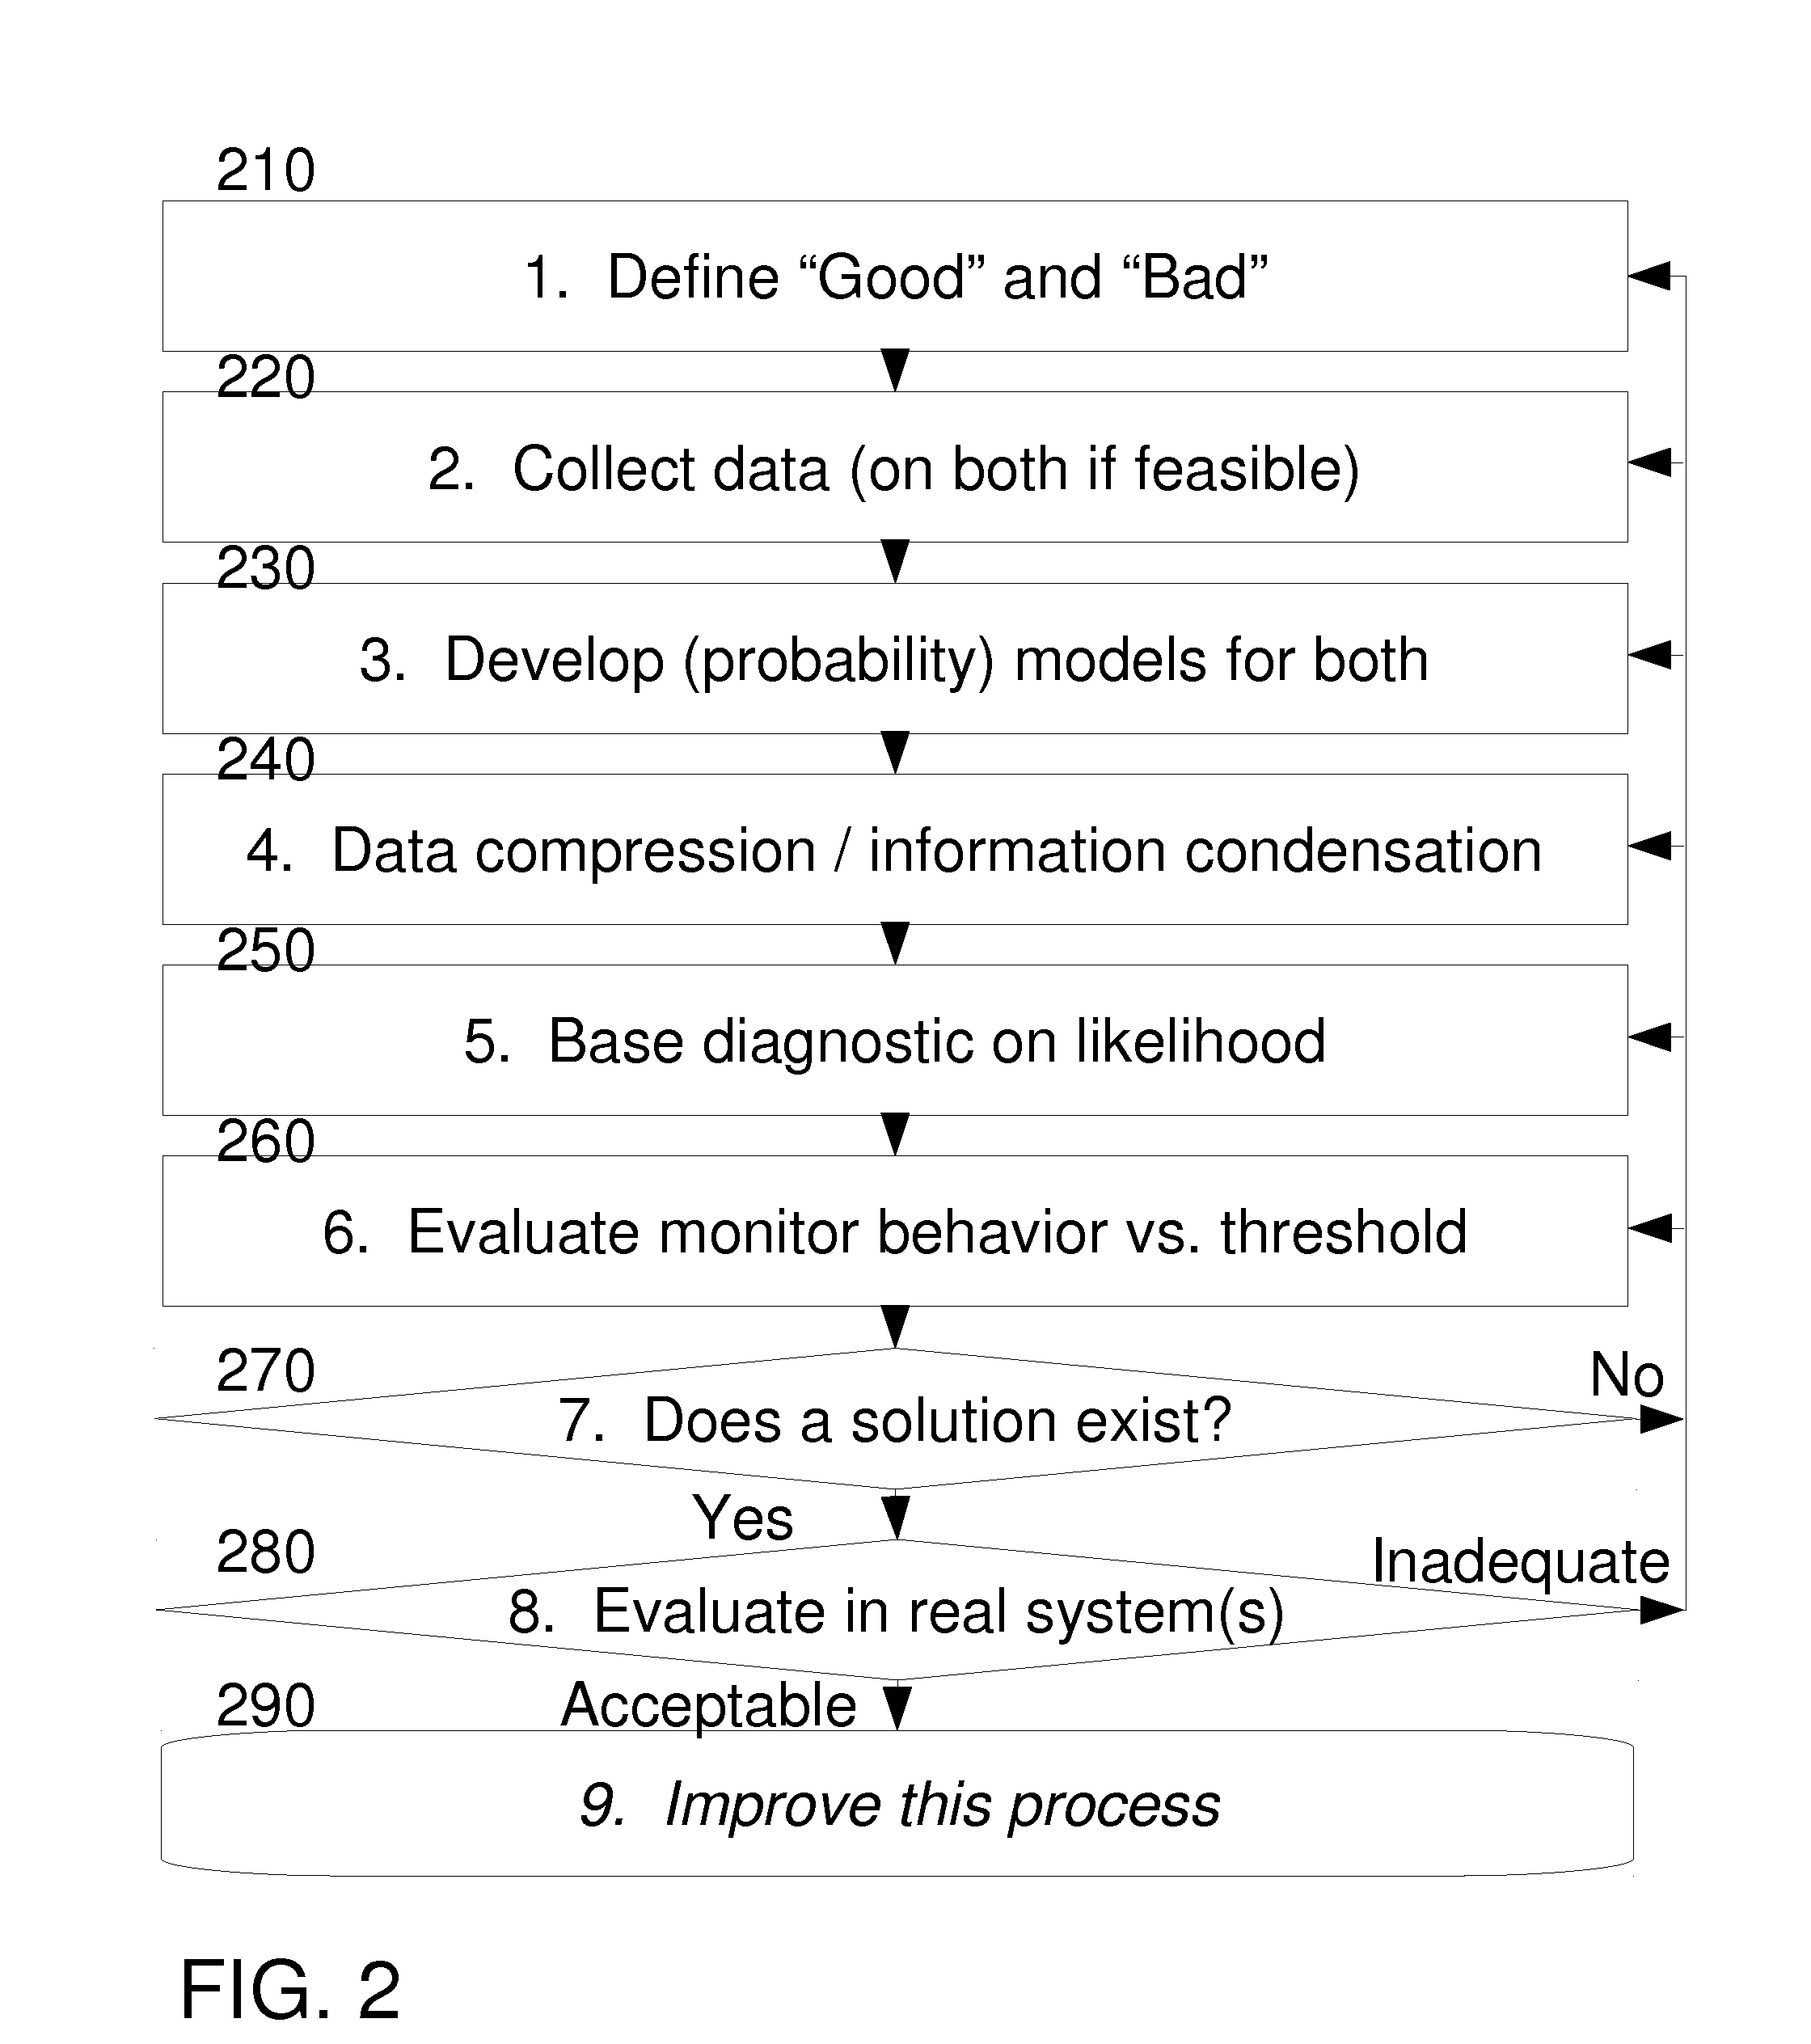
[0033]There are various methods for estimating the probability distribution of noise. For example, the standard deviation of normal noise can be estimated by a study of gauge repeatability and reproducibility (Wikipedia, “ANOVA Gauge R&R”). There are many other methods for evaluating the probability distribution of noise from the residuals from of a model. For example, one common tool for evaluating serial dependence is the autocorrelation function (Wikipedia, “Autocorrelation”). If serial dependence is found in residuals, the model has apparently not captured the entire behavior of the plant. In such cases, the standard deviation of the residuals overestimates measurement error. Similarly, normal probability plots (Wikipedia, “Normal probability plot”) are often used to evaluate whether a normal distribution seems plausible and if not to suggest alternatives such as a contaminated normal (Titterington et al. 1985).
[0034]If the noise is not normally distributed but follows a distribution from a location-scale family of distributions, the scale factor can still be estimated, e.g., by maximum likelihood or a Bayesian procedure. Each residual is then expressed as an integer multiple of this scale factor. (Autocorrelation, normal probability plots, maximum likelihood and Bayesian estimate are common tools well known among people skilled in the art of data analysis.)
[0035]The new data compression methods taught herein begin with state space techniques well known in the statistical literature, e.g., Petris et al. (2009) or Dethlefsen and Lundbye-Christensen (2006). The simplest state space model may be an exponentially weighted moving average (EWMA). For a Kalman formulation of an EWMA, Graves et al. (2002) described how use (a) a gauge repeatability and reproducibility study (Wikipedia, “ANOVA gauge R&R”) to estimate the observation noise level and (b) reliability data to estimate the drift rate (i.e., the probability distribution of if the Kalman migration step). This provides two important advantages over other methods for compressing scientific data, e.g., Fleizach (2006) or Shafaat and Baden (2007): First, it provides statistical theory and a scientific procedure (gauge R&R) for evaluating “how good is good enough?” Second, it incorporates state space representations that could provide a very parsimonious summary that is as good as the physical theory behind the state space representation chosen. The state space representation also includes its own estimate of the uncertainty in its representation of the underlying phenomenon. We have seen nothing else in the literature that explicitly considers the uncertainty in knowledge about the plant.
[0036]For example, thin plate splines (Wikipedia, “Thin Plate Spline”) or some other suitable basis set could be used for functional data analysis (Ramsay et al. 2009) of turbulent flow, decomposing the results further into (a) a solution of Navier-Stokes equations, (b) a component that may still represent phenomena different from the hypothesised Navier-Stokes model, and (c) measurement error. This could be applied adaptively as suggested by Shafaat and Baden (2007), but could achieve substantially greater compression through the use of appropriate physical models for the phenomena under study.

