
Method, an arrangement and a computer program product for analysing a biological or medical sample

a biological or medical sample and analysis method technology, applied in the field of microarray gene expression data analysis, can solve the problems of difficult to obtain corresponding normal tissue samples, difficult to interpret individual samples' data, and huge complexity of digital transformation problem

Inactive Publication Date: 2013-03-14
MEDISAPIENS OY
View PDF4 Cites 5 Cited by
  • Summary
  • Abstract
  • Description
  • Claims
  • Application Information

AI Technical Summary

Benefits of technology

The present invention aims to provide a method for easily extracting data entities (genes) that are responsible for a certain result using supervised clustering. This method can help in identifying the genes involved in a certain biological process and can be used for various biological applications.

Problems solved by technology

This reflects the tremendous complexity of the problem of transforming digital information on expression levels of over 20,000 genes into meaningful biological insights.
Interpretation of data from individual samples is often not possible with these approaches.
For example, samples from disease tissues, such as tumors, are often readily available, whereas the corresponding normal tissue samples may be much harder to obtain.
In other cases, an appropriate control group is hard to define and challenging to acquire, particularly from human tissues.
However, currently there are no tools available for such comparisons.
Even though this is an indispensable part of the diagnostic procedure it is subject to errors and in some cases visual features cannot reveal the exact nature of the cancer.
One problem with the current diagnostic methodologies is that, e.g. because of omitting a number of genes from the scope of the method, they lose information that may be needed for diagnostic and treatment decisions and may even cause a wrong diagnosis if wrong genes are measured.
As a result, the diagnostics process is inefficient and may produce only partial, or even wrong, results.
One further problem with the current diagnostic methodologies is that they are not particularly suitable for identifying a primary tumour of a metastasized cancer disease.
The method is unable to identify genes, which are the most significant ones in the process of identifying a tissue type.
The number of those genes may be very high, making the interpretation of the result very difficult and deteriorates the reliability of the result.
Overall the method assumes each gene to have only two informative expression states, which further limits the predictive potential of the method.
None of the methods known in the art teach a way to analyse and characterize a tissue without first making some assumption about the tissue or limiting the number of genes involved in the process.

Method used


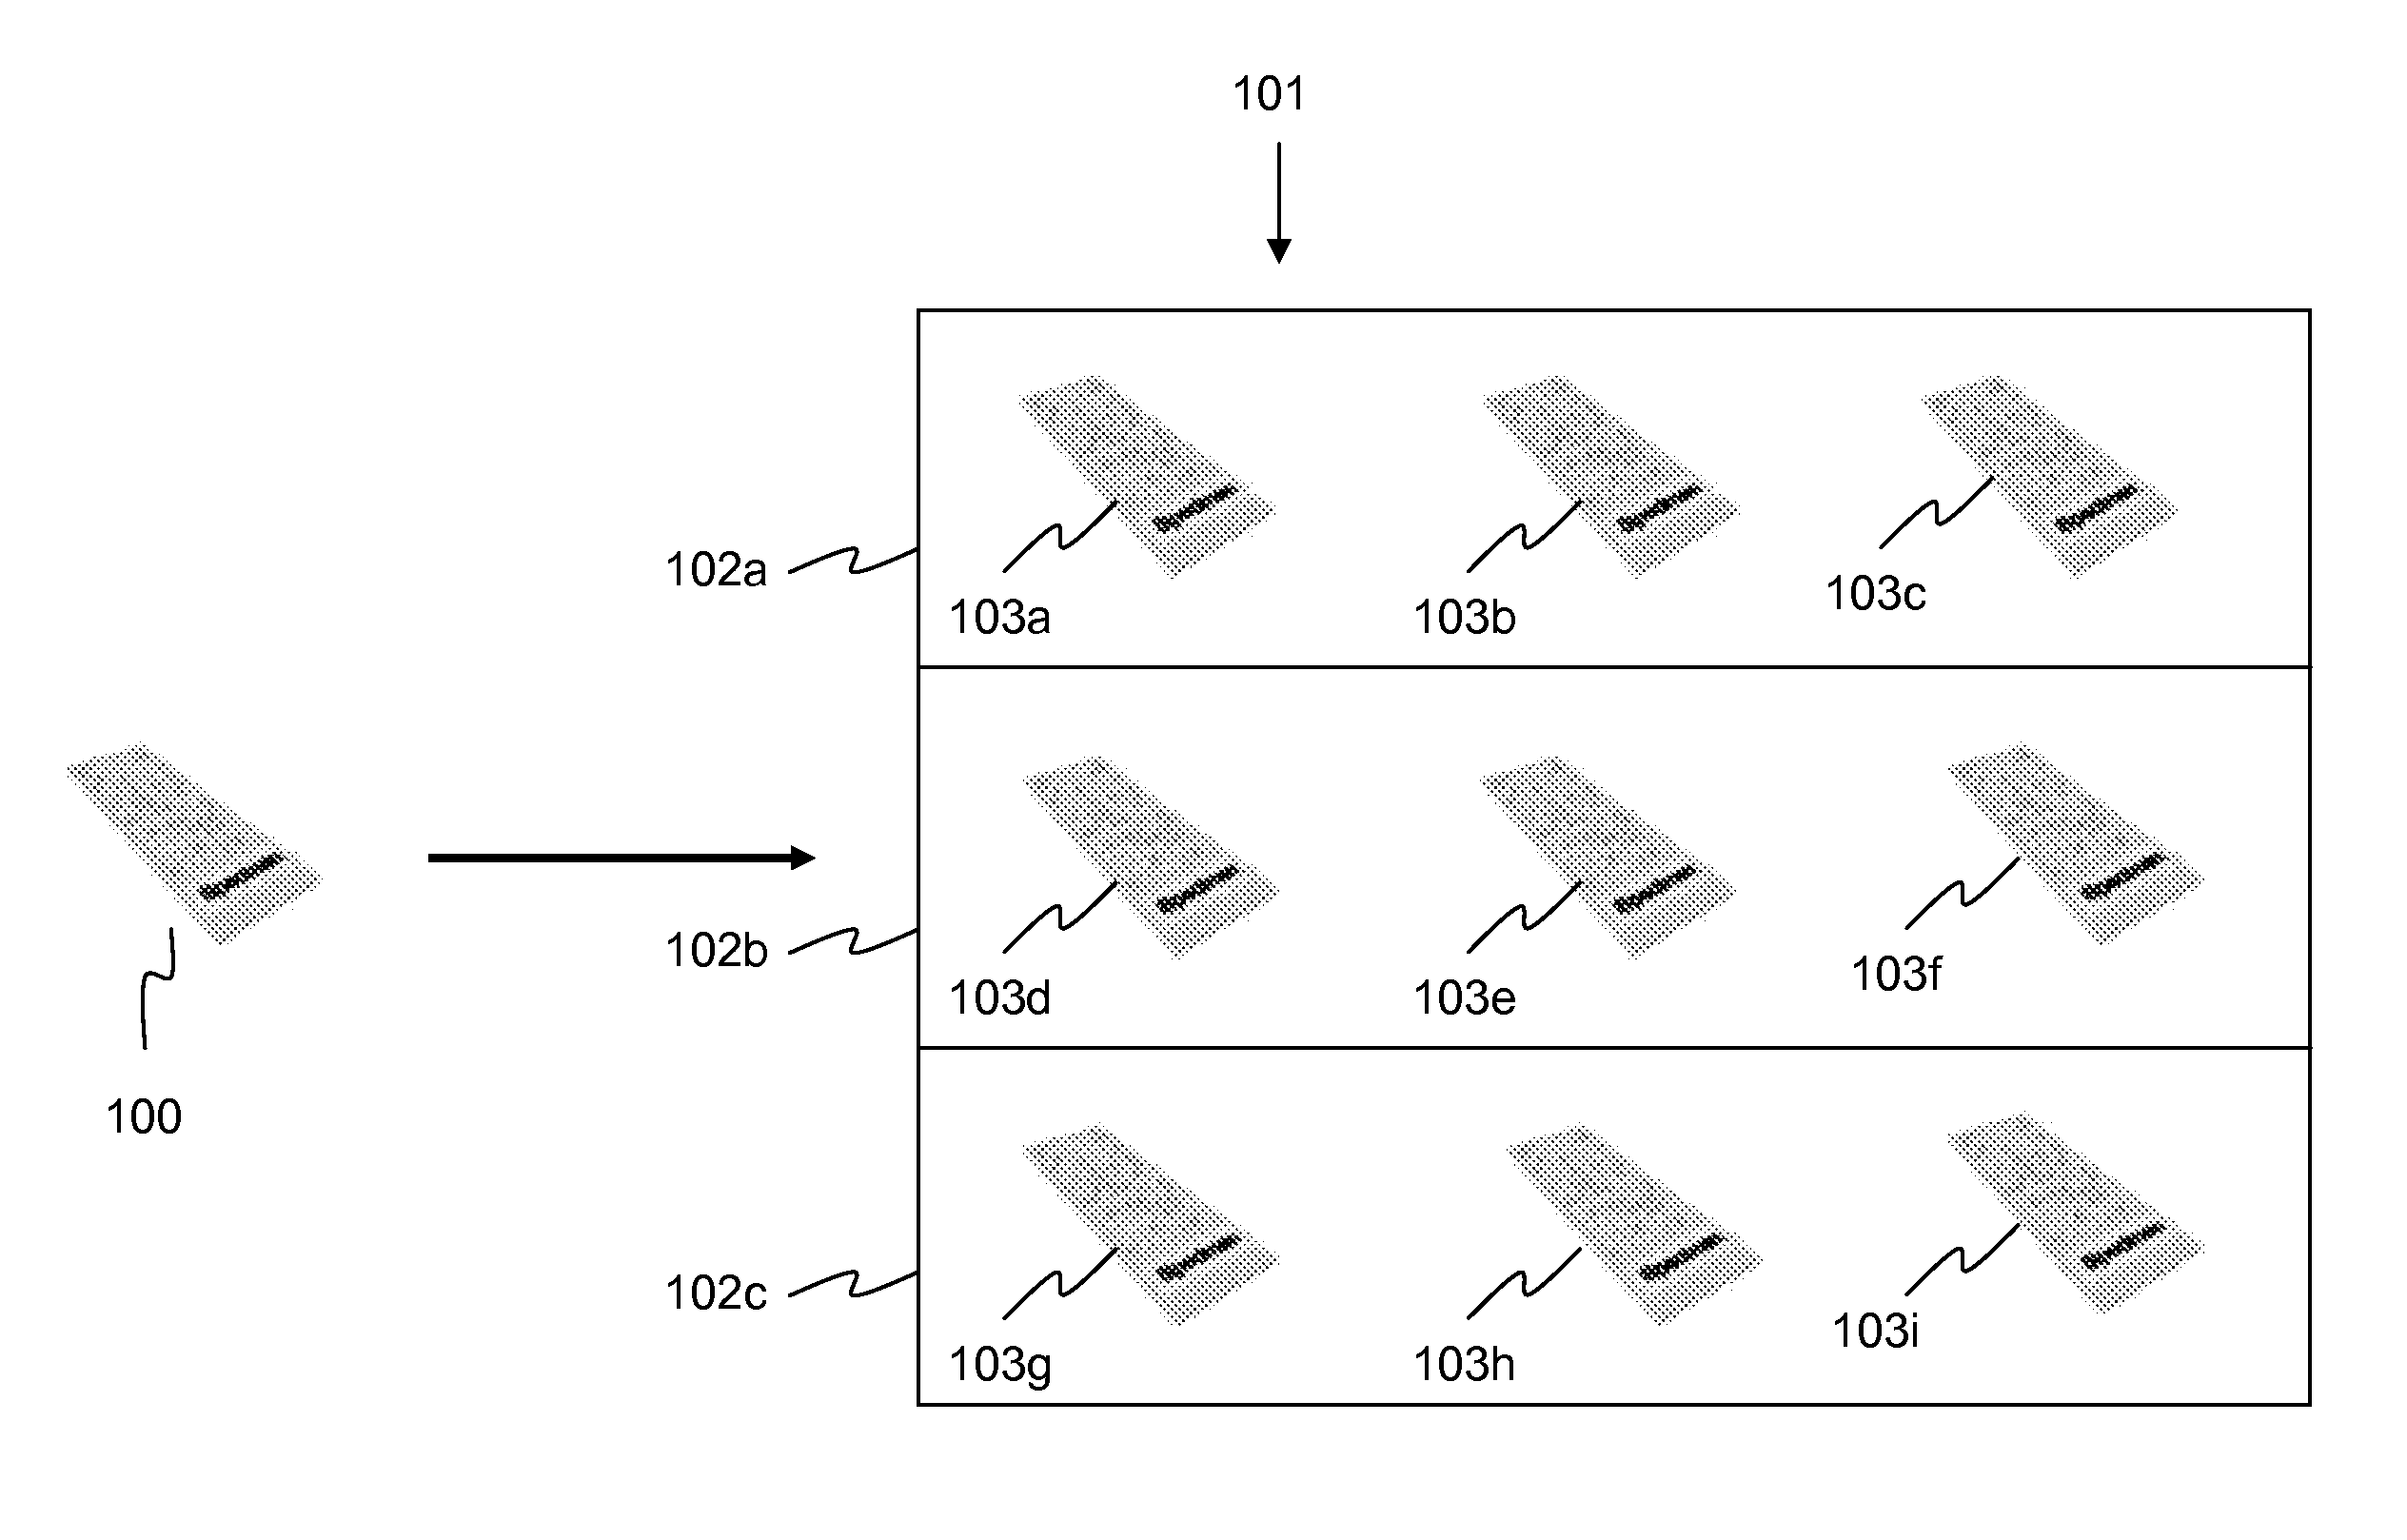
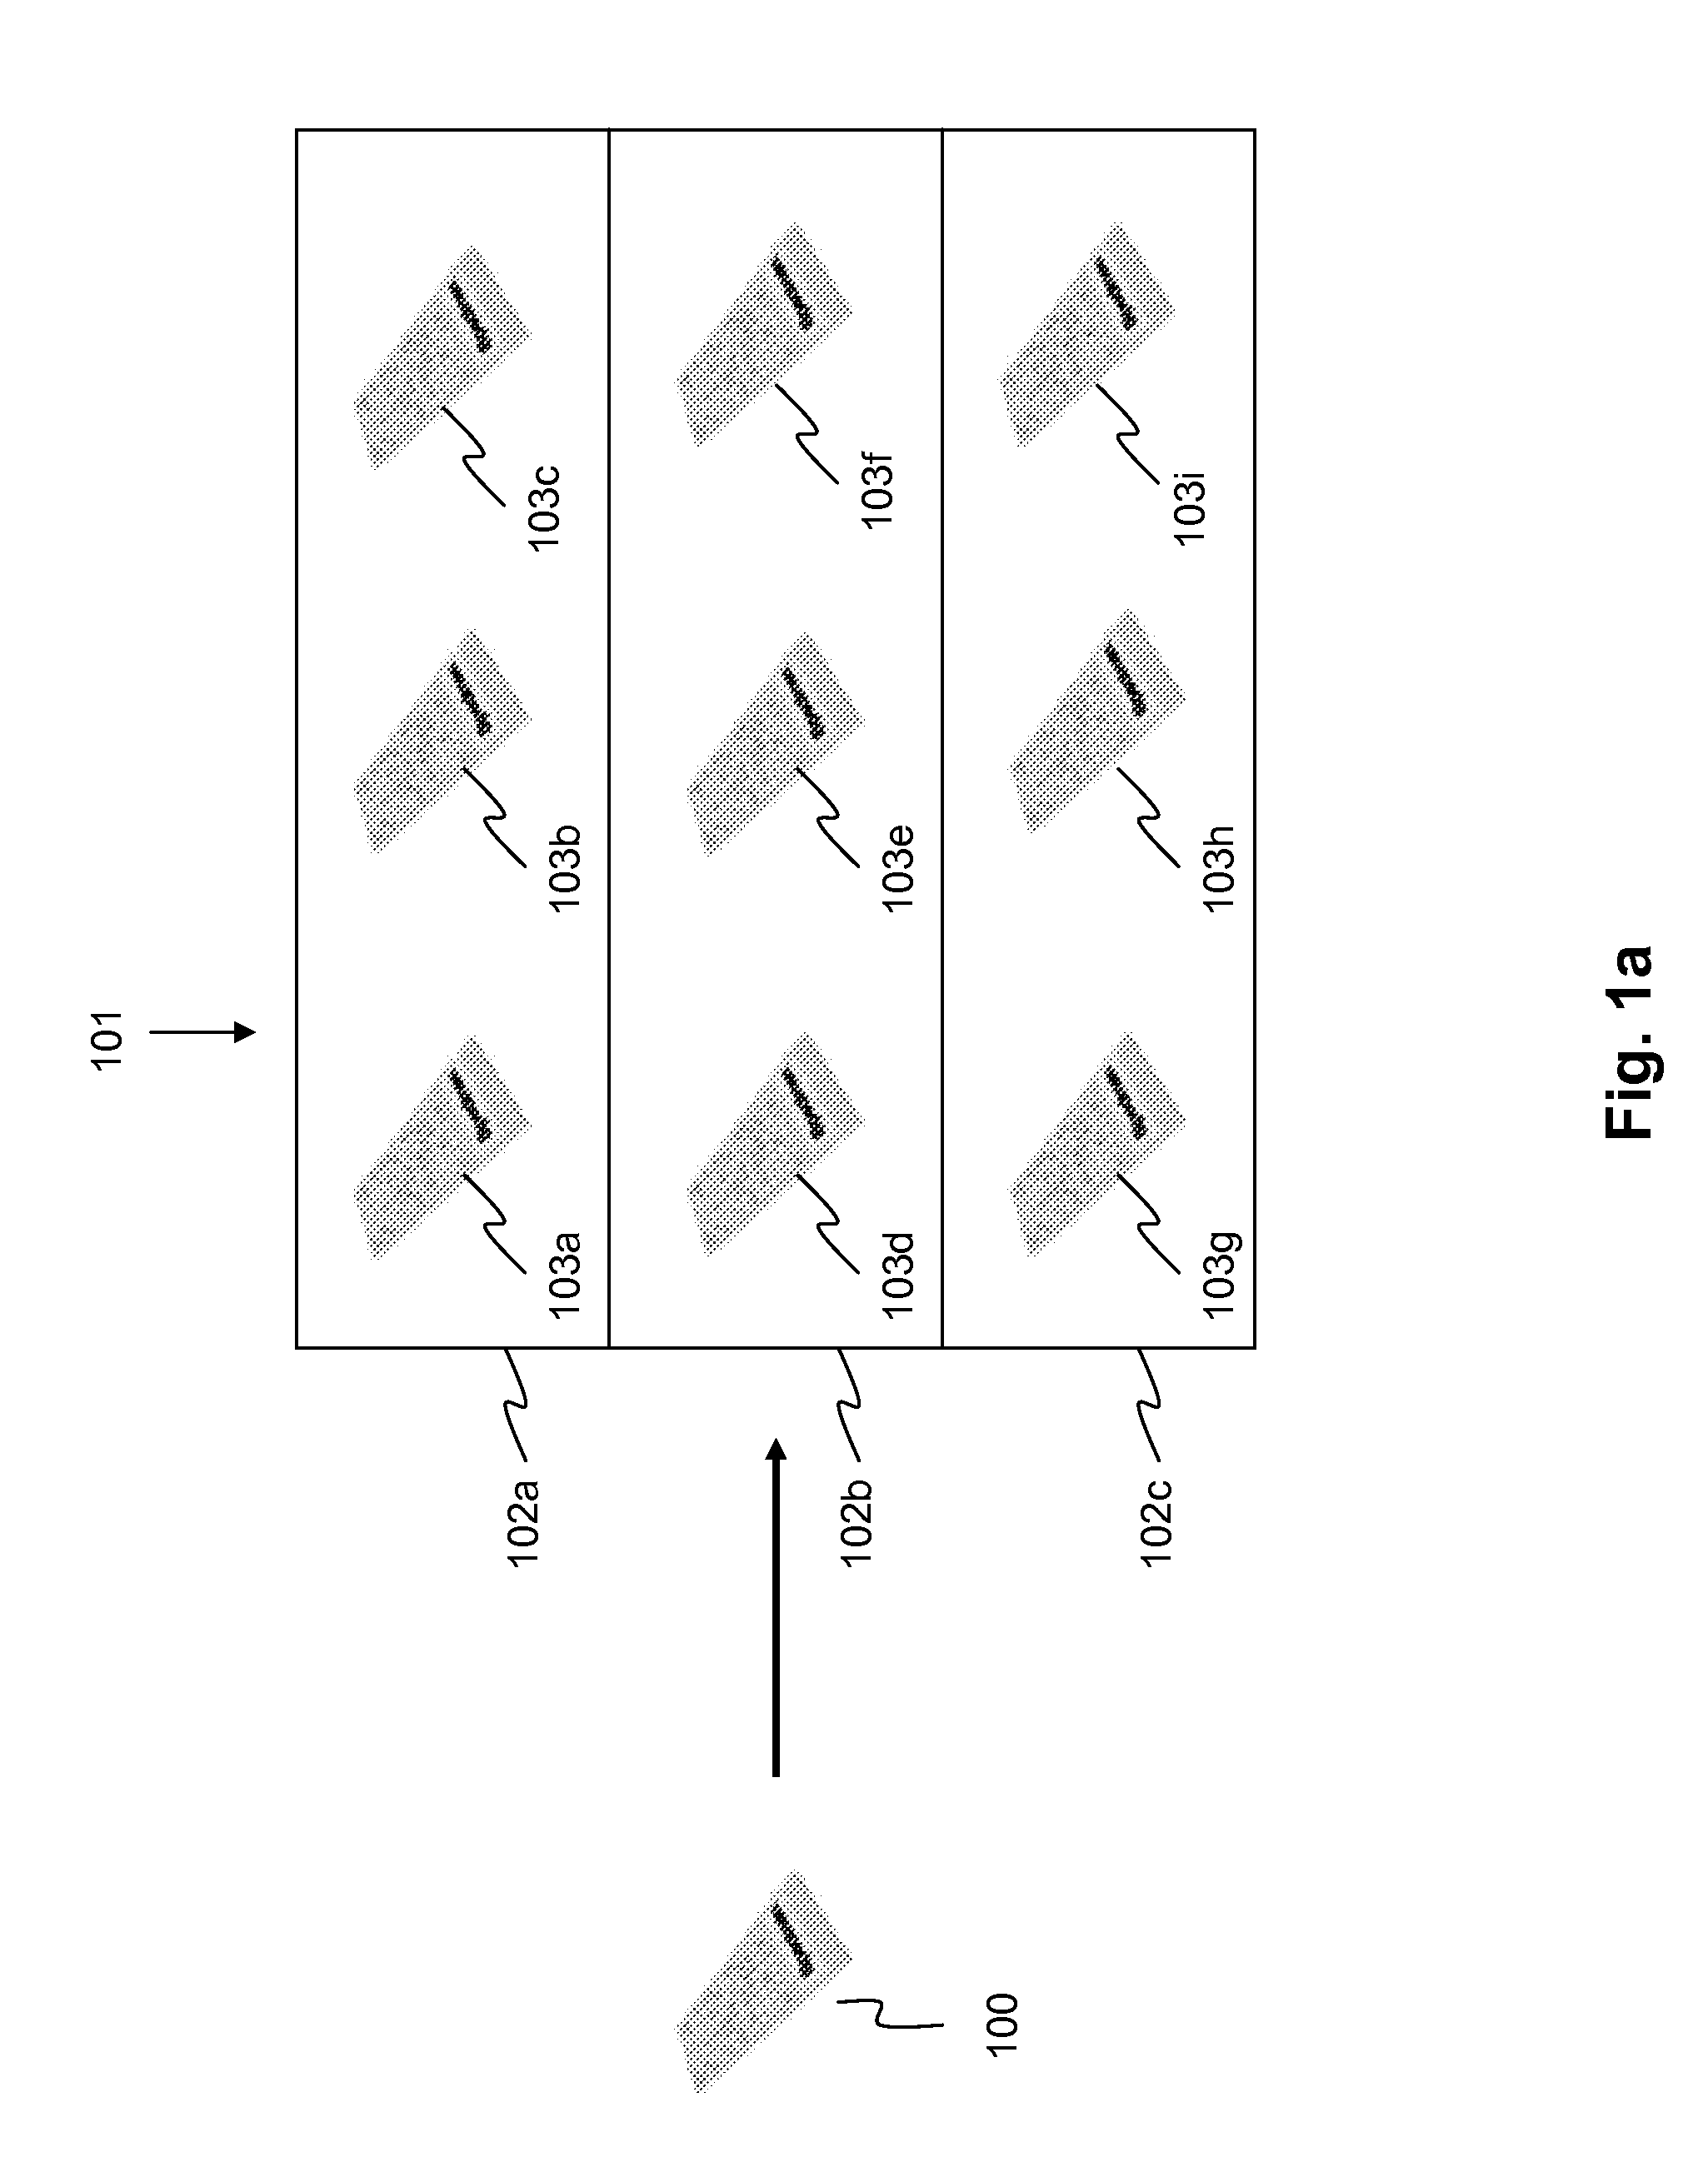
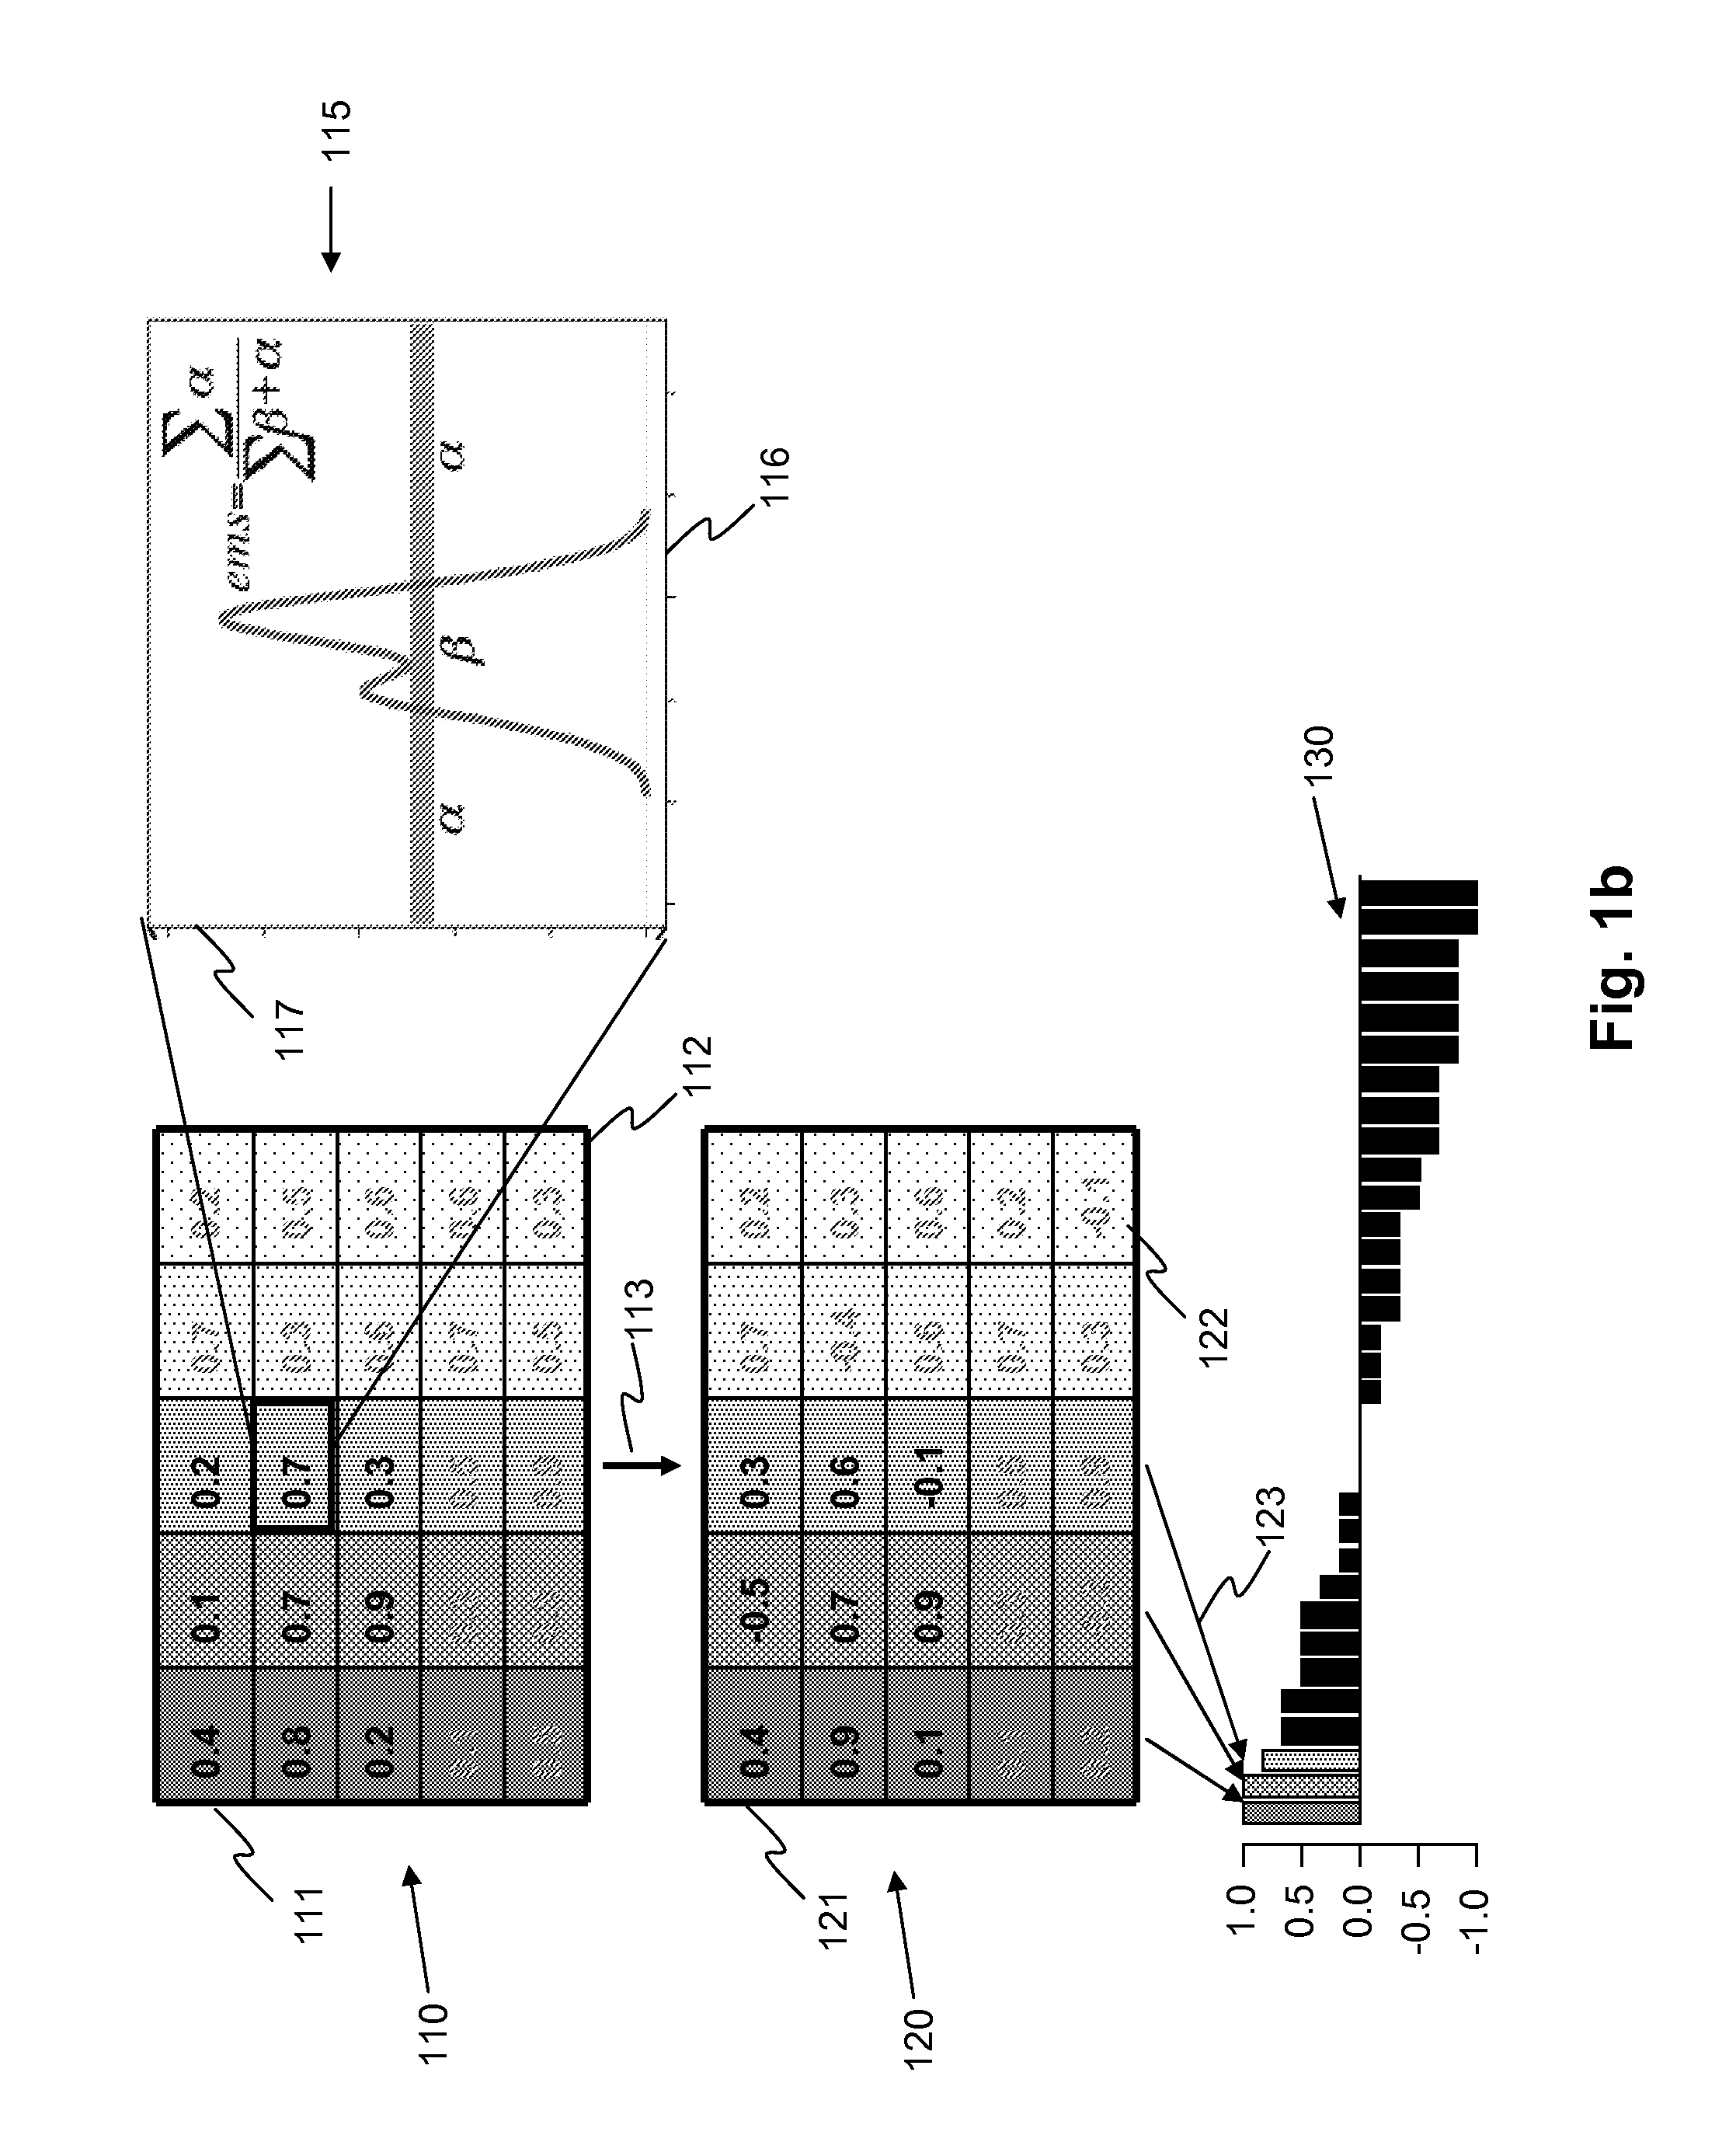
Image

  • Method, an arrangement and a computer program product for analysing a biological or medical sample
  • Method, an arrangement and a computer program product for analysing a biological or medical sample
  • Method, an arrangement and a computer program product for analysing a biological or medical sample

Examples


example 1

[0123]Application of the Array Alignment for the Microarray Data Analysis: Stem Cell Differentiation

[0124]Samples from a differentiation series of mesenchymal stem cells transforming into adipocytes were compared to reference data containing mesenchymal stem cell and adipose tissue samples. It was shown that the method is able to both show progression of differentiation and the genes whose expression level changes with the progression.

[0125]Samples were compared to the reference data as per the described method. The changes in the results are highlighted by comparing the samples from the beginning of the time series, the 0 h samples, with the samples from the end of the series, the 7 d samples. First of all, the 0 h samples had mesenchymal stem cells as the tissue they most resembled, whereas the 7 d samples resembled adipose tissue the most. On the level of biological processes composed of several genes, the trend was also very clear. Genes contributing to adipose tissue related pr...

example 2

[0127]Application of the Array Alignment for the Interpretation of Microarray Data: Dystrophic Muscle

[0128]One purpose of the invention is to provide meaningful interpretation for the gene expression of pathological samples for diagnostic and / or therapeutic purposes. For example when comparing dystrophic muscle samples to healthy striated muscle reference data one can provide molecular level interpretation of the patient. Muscle samples from patients suffering from Duchenne Muscular Dystrophy (DMD) were analyzed, with the reference data containing a large amount of healthy muscle samples.

[0129]As shown in FIG. 2b, which shows similarity of the dystrophic muscle samples to five most similar reference tissues, all samples identified healthy muscle as their closest tissue match, but one sample identified adipose tissue as second closest match (203). All samples displayed abnormal, as compared to healthy muscle, expression of genes relating to inflammatory and immune responses, revealin...


PUM

PropertyMeasurementUnit
Densityaaaaaaaaaa
Gene expression profileaaaaaaaaaa

Abstract

An aspect of the present invention is a computer executable method for characterizing, e.g. for diagnostic purposes, utilizing a reference database, a query sample tissue based on the gene expression data of the tissue. The method is characterized in that it comprises the steps of calculating an expression match score (EM-score) indicating the likelihood of having the gene expression level observed in the query sample in each of the tissue categories of the reference database, calculating for the genes of the sample tissue, using e.g. the EM-score, tissue specificity score (TS-score), that expresses how uniquely a gene identifies the query sample as belonging to a certain tissue category, calculating, utilizing e.g. the TS-score, overall similarity of the sample tissue in relation to a tissue category of the reference database, and storing at least some resulting characterization data to a memory device or outputting the data to an output device of a computer. An arrangement and a computer program product are also disclosed.

Description

AREA OF INVENTION[0001]The invention relates to the area of bioinformatics. More specifically, the invention relates to analysis method of genetic data for e.g. cancer diagnostics purposes.BACKGROUND OF THE INVENTION[0002]A large number of methods have been developed for the analysis of microarray gene expression data. This reflects the tremendous complexity of the problem of transforming digital information on expression levels of over 20,000 genes into meaningful biological insights. Many microarray data analysis approaches are based on a case-control study design, for example comparing treated and untreated cells or matched disease and control tissues. In other cases, characteristic subsets of genes or classifiers are built and tested for specific purposes, such as the differential diagnosis of diseases. In most cases, significant numbers of samples from the case and control groups are expected in order to arrive at statistically significant interpretation of differentially expre...

Claims


Application Information

Patent Timeline
IPC IPC(8): G06F17/30G16B20/20G16B25/10G16B40/10G16B40/20G16B50/30
CPCG06F19/20G06F19/28G06F19/24G06F16/24578G16B25/00G16B40/00G16B20/00G16B20/20G16B40/20G16B25/10G16B50/30G16B40/10G06F16/285G16B50/00Y10S707/941C12Q1/6886
Inventor KILPINEN, SAMIOJALA, KALLEAHOPELTO, TIMOPISTO, TOMMI
Owner MEDISAPIENS OY
Learn More