

System, method and article for normalization and enhancement of tissue images
- Summary
- Abstract
- Description
- Claims
- Application Information
AI Technical Summary
Benefits of technology
Problems solved by technology
Method used
Image

Examples
example 1
Normalization of Excitation
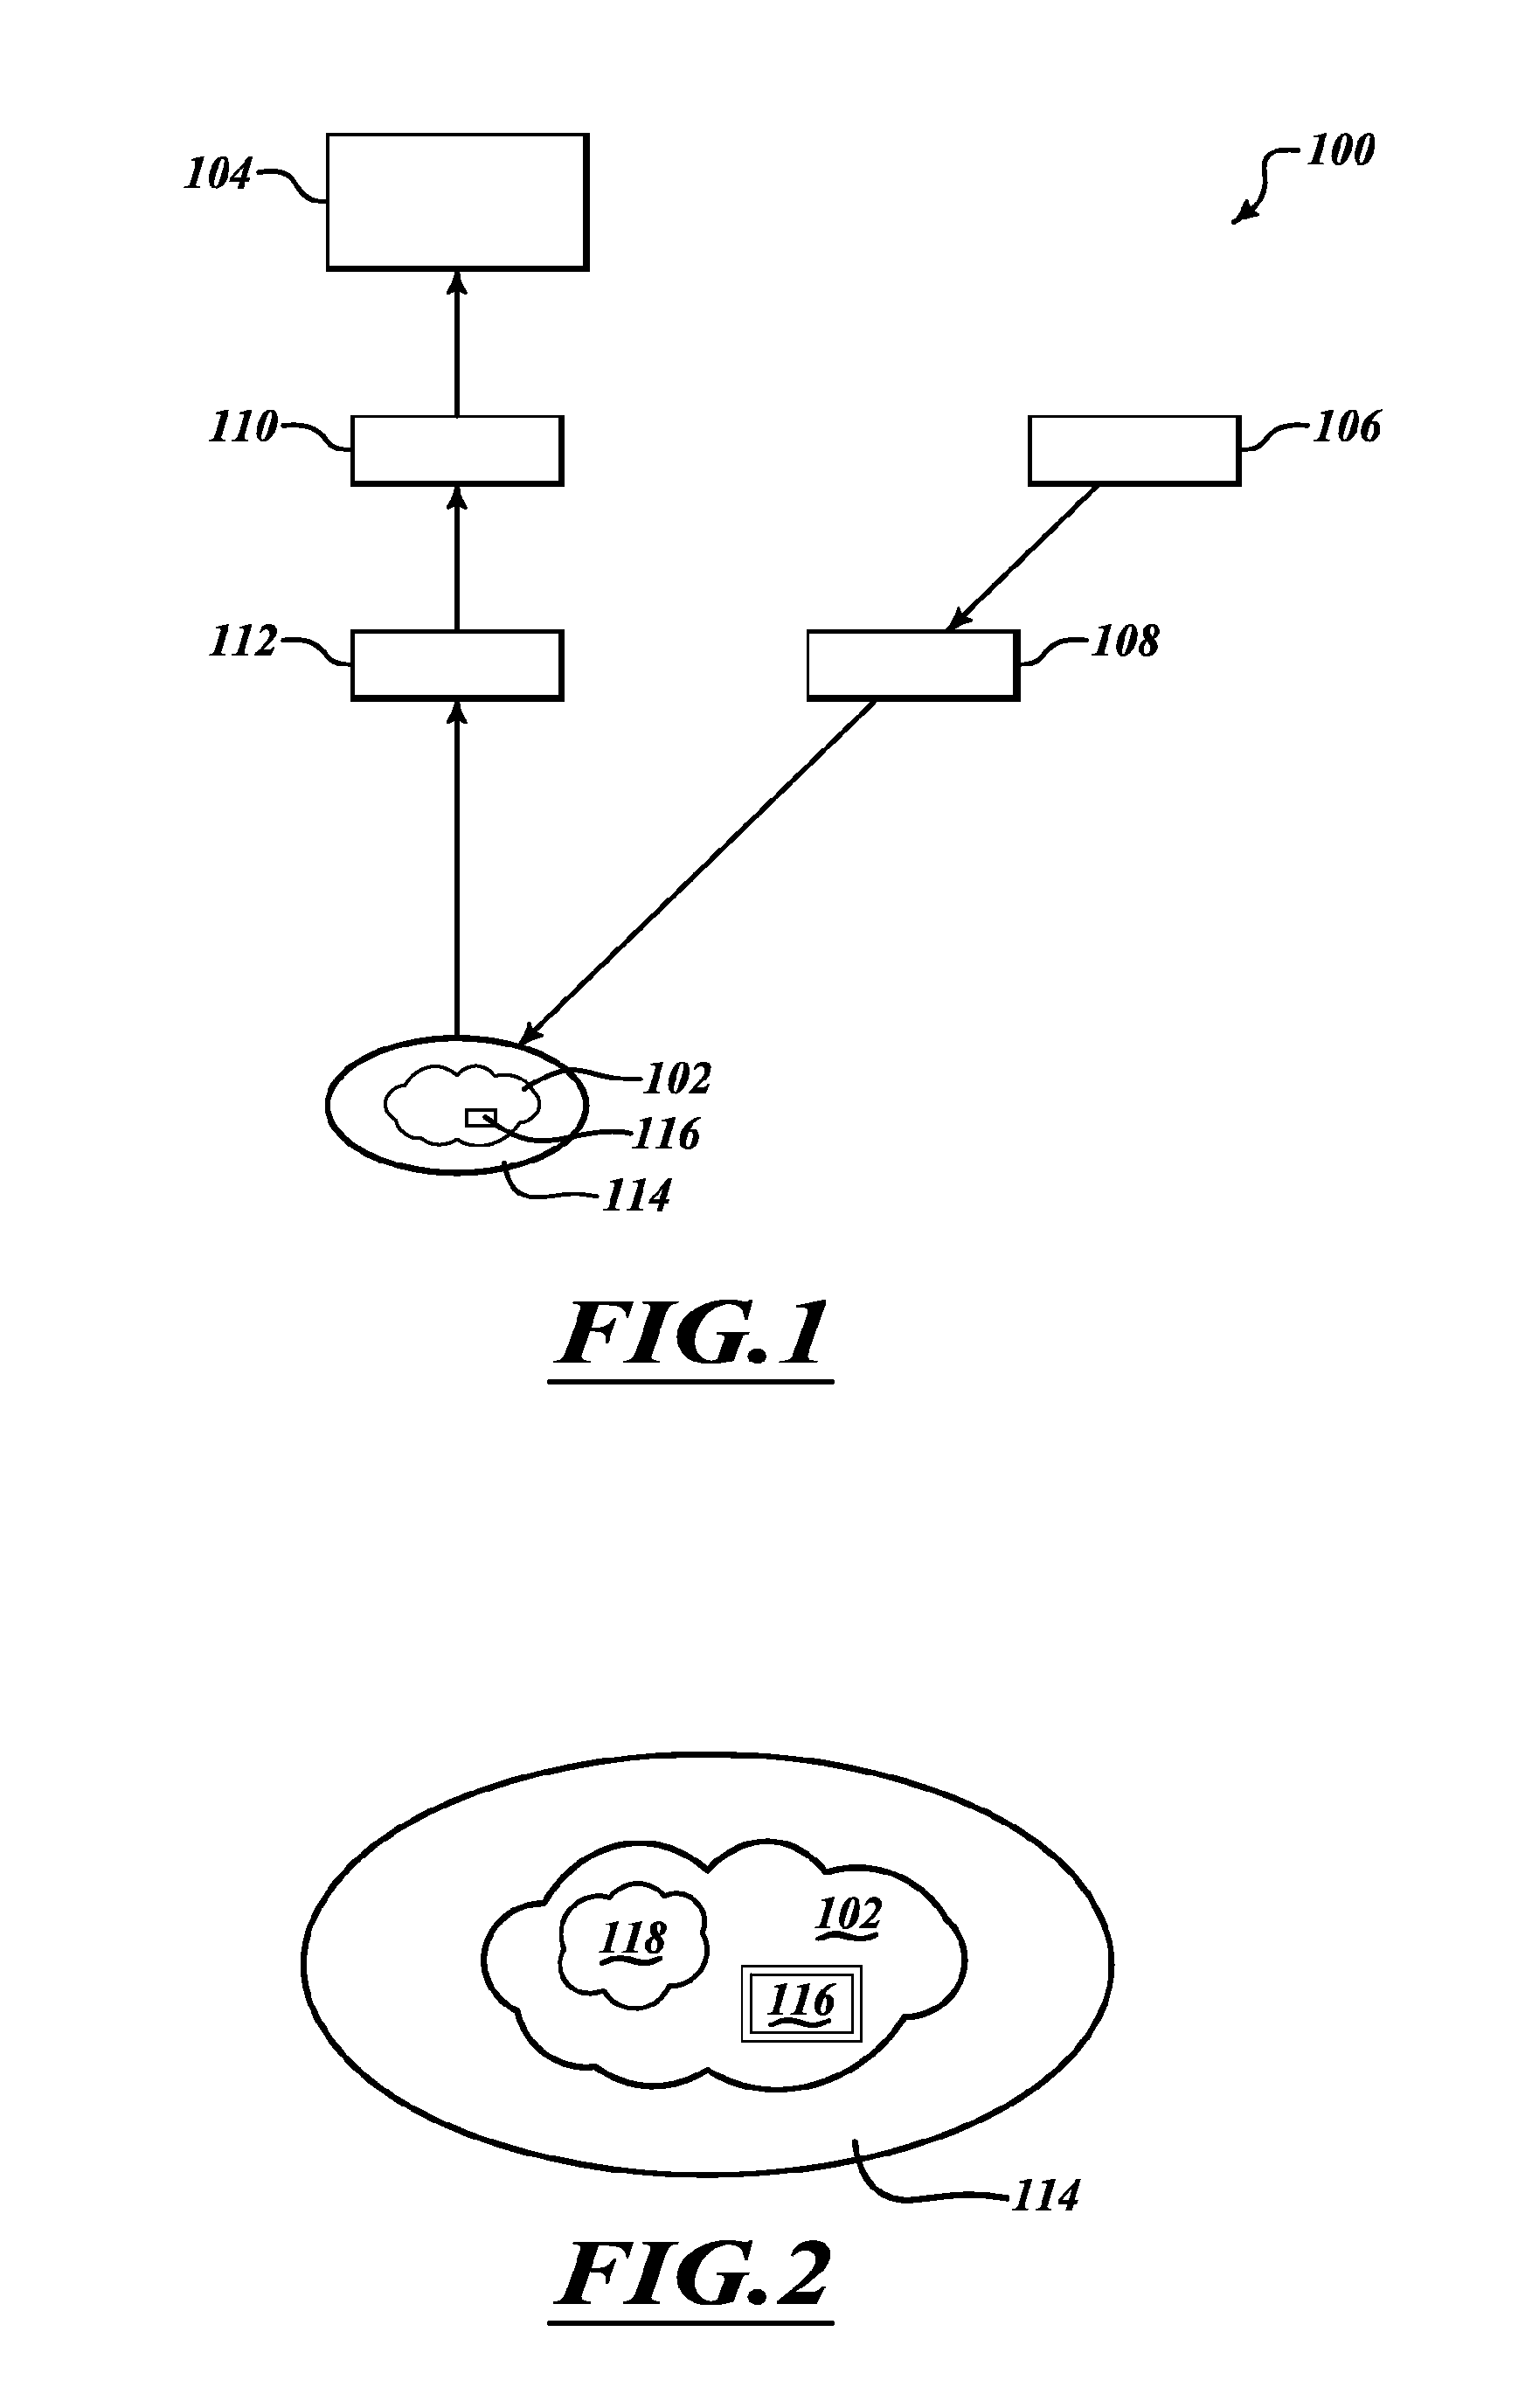
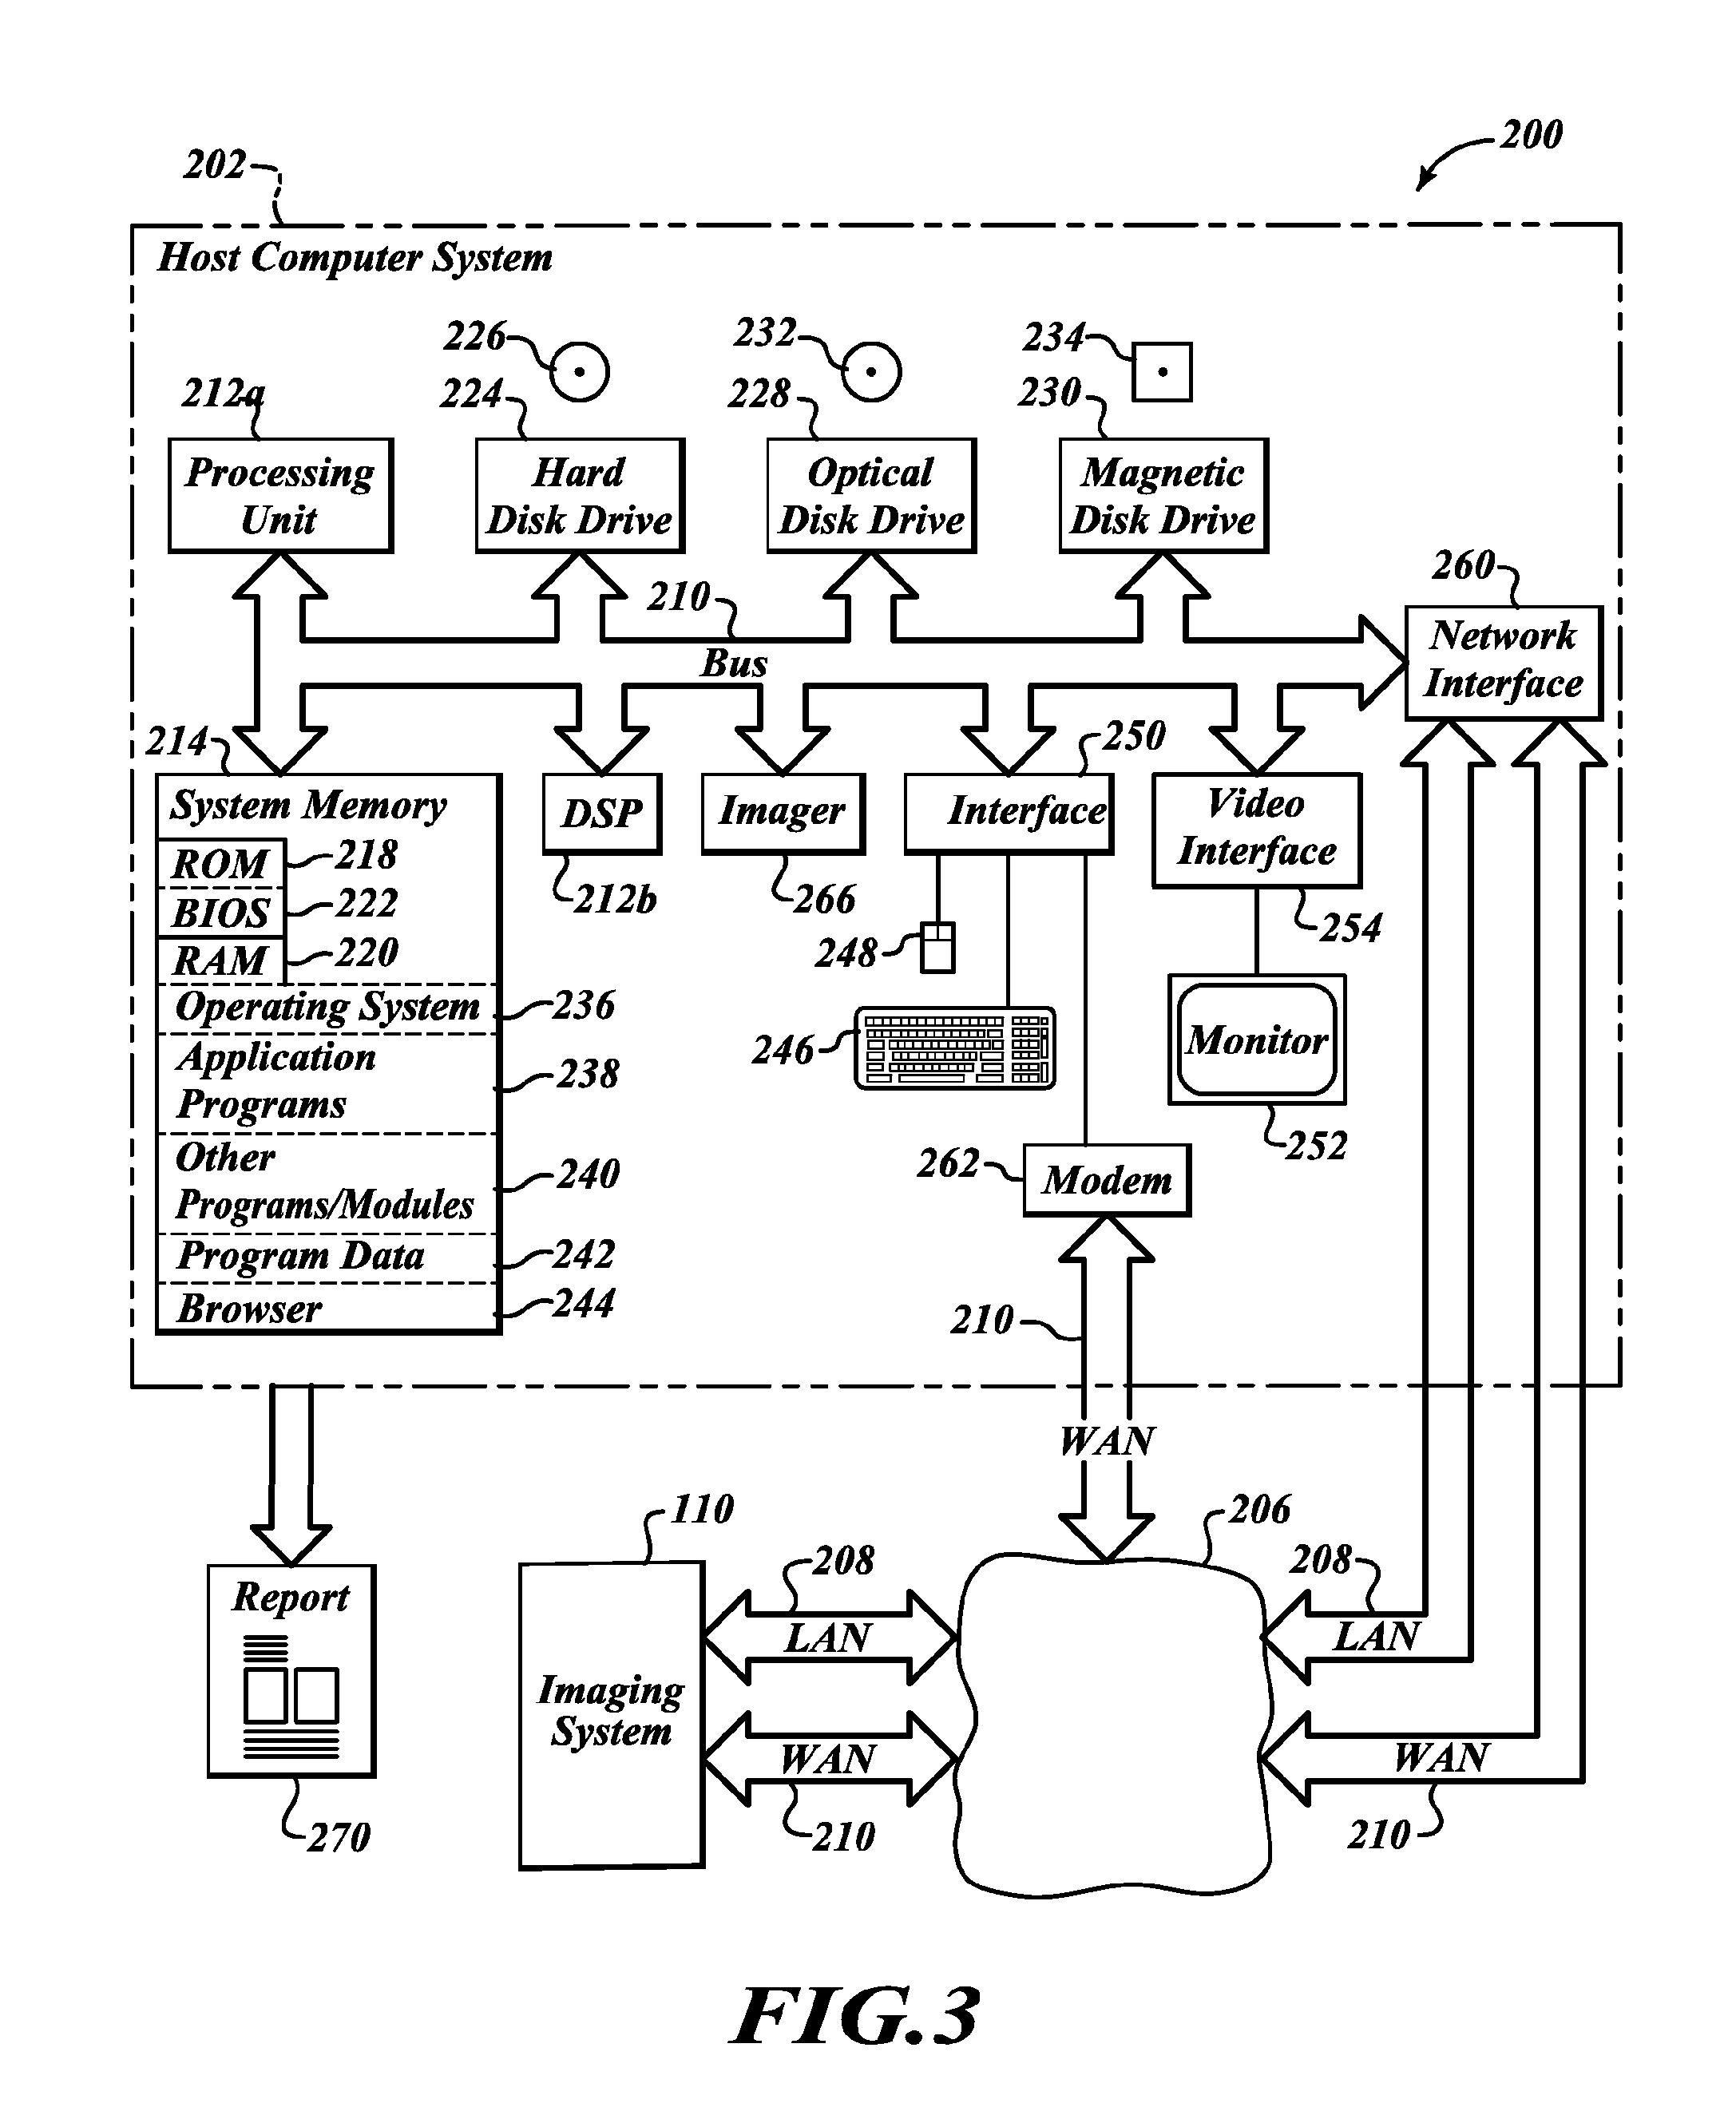
[0189]In one example, the inclusion of fiducial marker(s) 116 (FIGS. 1 and 2) in digital images captured using a digital camera 104 (FIG. 1) allows the tissue image processing host computer 202 (FIG. 3) to compensate for variations in apparent optical excitation such as variations in excitation source to subject distance. The images may have been acquired with different digital cameras 104, and / or with variations in and spatial and spectral sensitivity. Other variations might include distance to subject, focal length and optical axes. Ideally when digital images are captured, the excitation source 106 (e.g., flash) should be ON or illuminating the subject tissue 102, the optical normal of both the region of interest (e.g., lesion) and the fiducial marker 116 should be equal and perpendicular to the optical normal of the digital camera 104, however, this also must be accounted for. Variations might also be the result of ambient conditions and poor image qua...
example 2
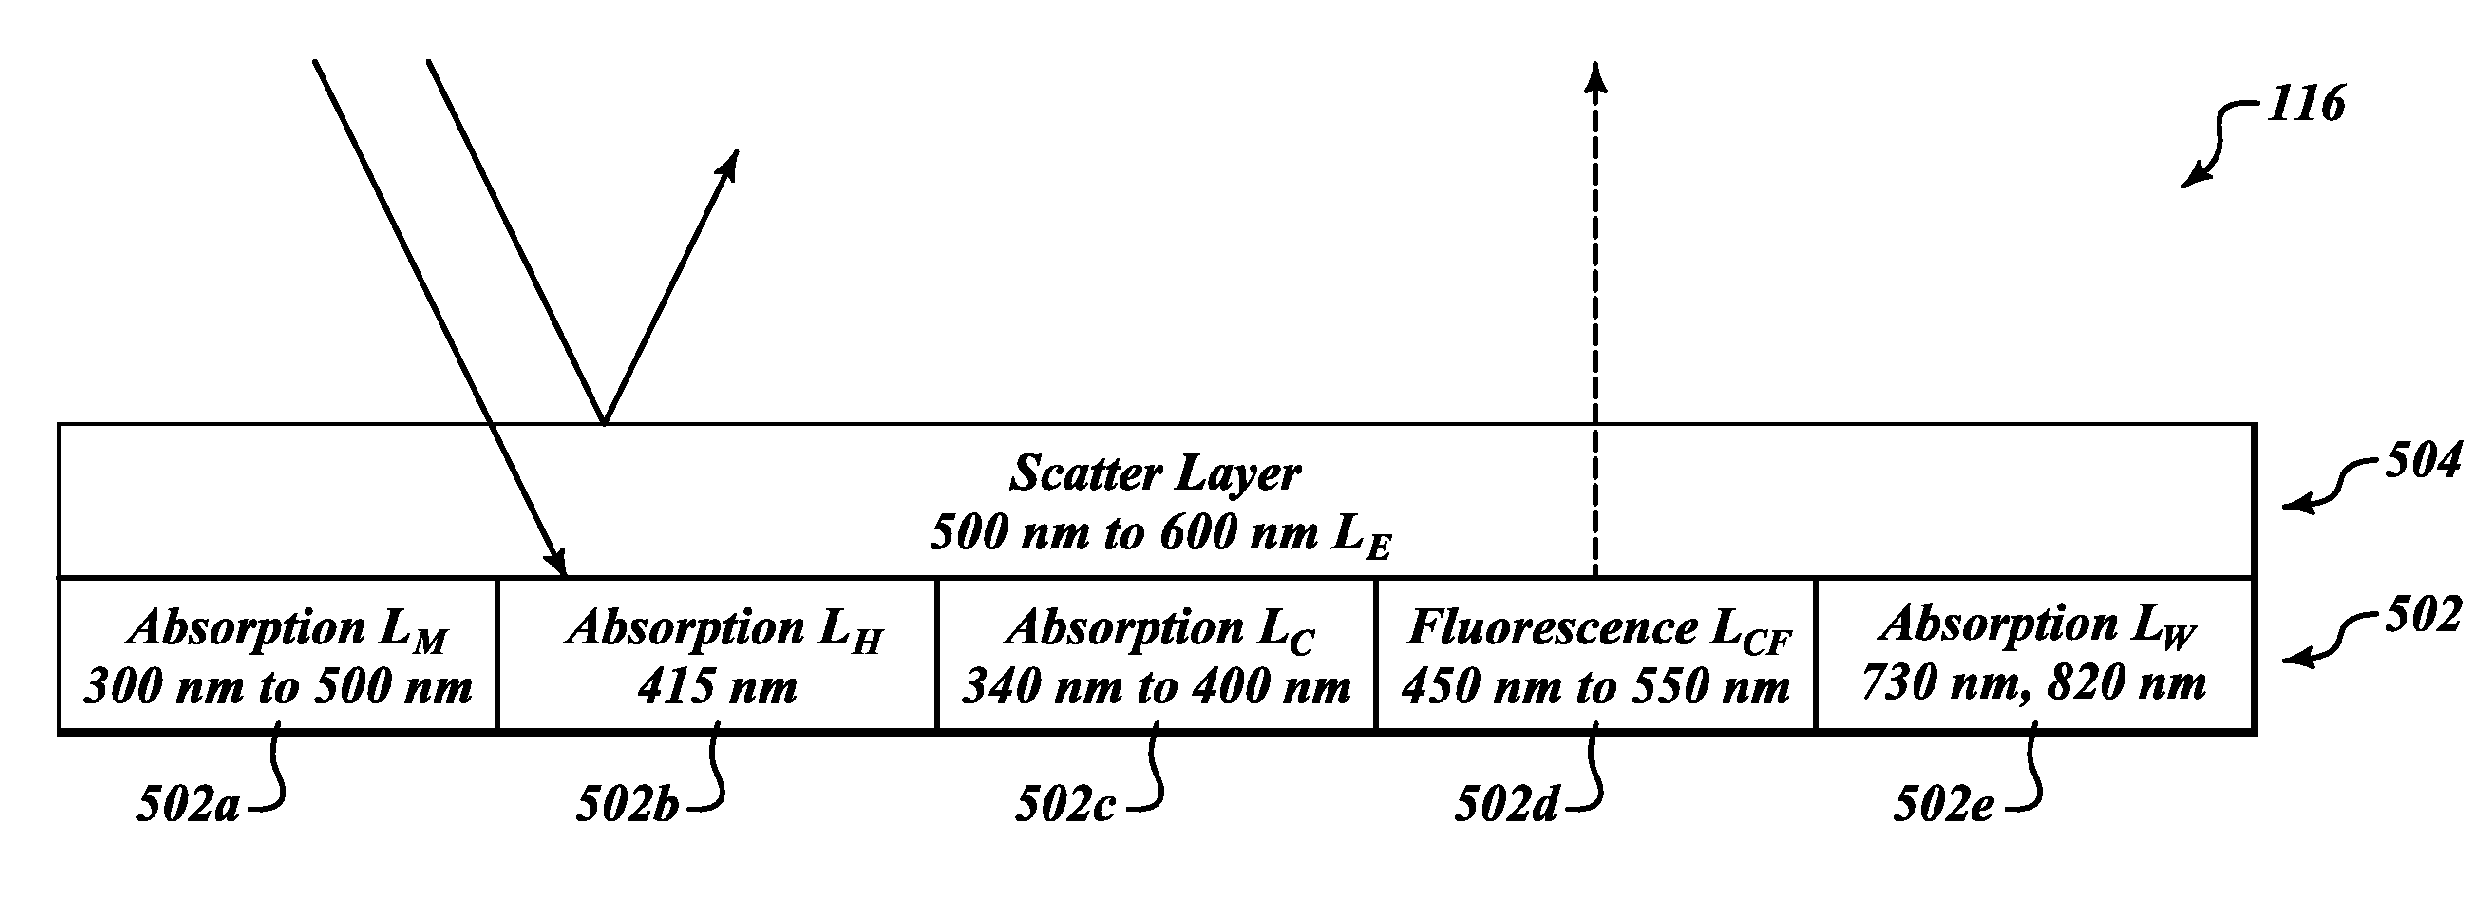
Reflection vs. Backscatter
[0190]In one example, the tissue image processing host computer 202 (FIG. 3) characterizes the tissue response from various optical layers of tissue 102 (FIGS. 1 and 2) in order to be able to differentiate tissue variations that might not be fully visible to the naked eye. The spectra from two digital images are normalized using the fiducial marker 116 and / or areas of tissue 102 in some or all digital images where melanin or hemoglobin spectra appear normal. The spectral distribution is compared between either the whole digital image or a localized area of the digital image. With the major spectral components removed that contribute to reflection from the Epidermal Layer I1LE, the changes in other optical layers such as Melanin Layer I1LM, Hemoglobin Layer I1LH, Collagen Layer I1LC or I1LCF can be more easily compared.
example 3
[0191]In one example, low cost digital cameras 104 (FIG. 1) with minimal capacity for measuring spectral changes but adequate for accessing the shape and color or lesion borders are employed to capture digital images of the tissue 102. Correlation of digital images enables a clinician or automated system (e.g., tissue image processing host computer 202 of FIG. 3) to assess if there are morphological changes. These morphological changes would—subsequently be noted in the ABCD guidance of tissue evolution. The digital images timeline is corrected based on the fiducial marker(s) 116 appearing in the source image I1(xn, y) and the fiducial marker(s) 116 appearing within the time series images I1 . . . n(xn, yn).
PUM
 Abstract
Description
Claims
Application Information