Chromatograph mass spectrometry data processing device

a mass spectrometry and data processing technology, applied in chemical data visualisation, instruments, chemical methods analysis, etc., can solve the problems of difficult comparison between actual measurement mass spectra and standard mass spectrum of target compounds, complicated and troublesome comparison operation, and not only complicated operation, so as to achieve accurate confirmation, simple operation, and easy operation.

Inactive Publication Date: 2014-01-09
SHIMADZU CORP
View PDF6 Cites 13 Cited by
  • Summary
  • Abstract
  • Description
  • Claims
  • Application Information

AI Technical Summary

Benefits of technology

[0010]The present invention was conceived in light of the problems described above, and its purpose is to provide a chromatograph mass spectrometry data processing device capable of improving the efficiency of operations by simplifying the operations performed by an analyst and reducing operational mistakes when performing component identification by analyzing data collected by chromatograph mass spectrometry.
[0018]On the other hand, the spectrum display processing means reads out a standard mass spectrum of the component designated to be confirmed from the storage means and displays it in a region prepared directly above or below using the same mass axis scale as the actual measurement mass spectrum. Magnification / reduction operations of both mass spectra are performed concurrently in the mass axis direction, and when the analyst performs a magnification or reduction operation in the mass axis direction of one of the mass spectra, the mass axis of the other mass spectrum is also magnified or reduced by the same amount. Accordingly, the scales of the mass axes of the two upper and lower mass spectra are always aligned. Therefore, the analyst can easily and accurately compare the intensity patterns of the actual measurement mass spectrum and the standard mass spectrum.
[0019]When the analyst indicates an arbitrary peak in the standard mass spectrum displayed as described above using a pointing device, for example, the extracted ion chromatogram display processing means receives this indication, creates an extracted ion chromatogram of an actual measurement for the mass of the indicated peak, and displays the chromatogram on the display screen. The extracted ion chromatogram at this time may be displayed in an overlapping manner with the total ion current chromatogram (in a form in which they can be distinguished from one another such as a form with different line colors), or it may be displayed independently in a different area of the same screen. If a plurality of peaks are indicated in a mass spectrum, extracted ion chromatograms for the masses of the plurality of indicated peaks should be created and displayed in an overlapping manner in one graph with different line colors or the like. As a result, it is possible to draw a plurality of extracted ion chromatograms and compare their shapes with a simple operation such as the clicking operation of a mouse.
[0020]In addition, in the chromatograph mass spectrometry data processing device of the present invention, instead of the standard mass spectrum, the spectrum display processing means may arrange differential mass spectra obtained by subtracting a standard mass spectrum with uniformly adjusted intensities from the actual measurement mass spectra vertically with the same mass axis scale as the actual measurement mass spectra. The “standard mass spectrum with uniformly adjusted intensities” is a mass spectrum obtained by multiplying a uniformly determined scaling factor by each intensity so that the intensity of each peak in the standard mass spectrum does not exceed that in the actual measurement mass spectrum.
[0022]With the chromatograph mass spectrometry data processing device of the present invention, it is possible for an analyst to easily—that is, with a simple operation—and accurately confirm whether contaminant components other than a target component overlap with an arbitrary peak of a chromatogram based on the intensity patterns of the mass spectrum. In addition, when the overlapping of components is suspected from a comparison of the intensity patterns of the mass spectrum, it is possible to confirm the waveform of an extracted ion chromatogram corresponding to a suspicious peak with an extremely simple operation. As a result, when performing operations such as the confirmation of whether a target component is present in a sample or the identification of contained components, the confirmation operation performed visually by the analyst is simplified, which improves efficiency, and operational mistakes are also reduced, which improves the reliability of the results.

Problems solved by technology

However, the conventional device has the problems that, when the analyst performs operations related to the identification described above, it is difficult to compare the actual measurement mass spectra and the standard mass spectrum of the target compound, or the comparison operation is complicated and troublesome.
In addition, when the overlapping of components in a single peak of the TIC is suspected, it is necessary to manually input the m / z value in order to display the extracted ion chromatogram to be confirmed, and the operation is not only complicated, but it also causes mistakes.

Method used


Image

  • Chromatograph mass spectrometry data processing device
  • Chromatograph mass spectrometry data processing device
  • Chromatograph mass spectrometry data processing device

Examples


Embodiment Construction

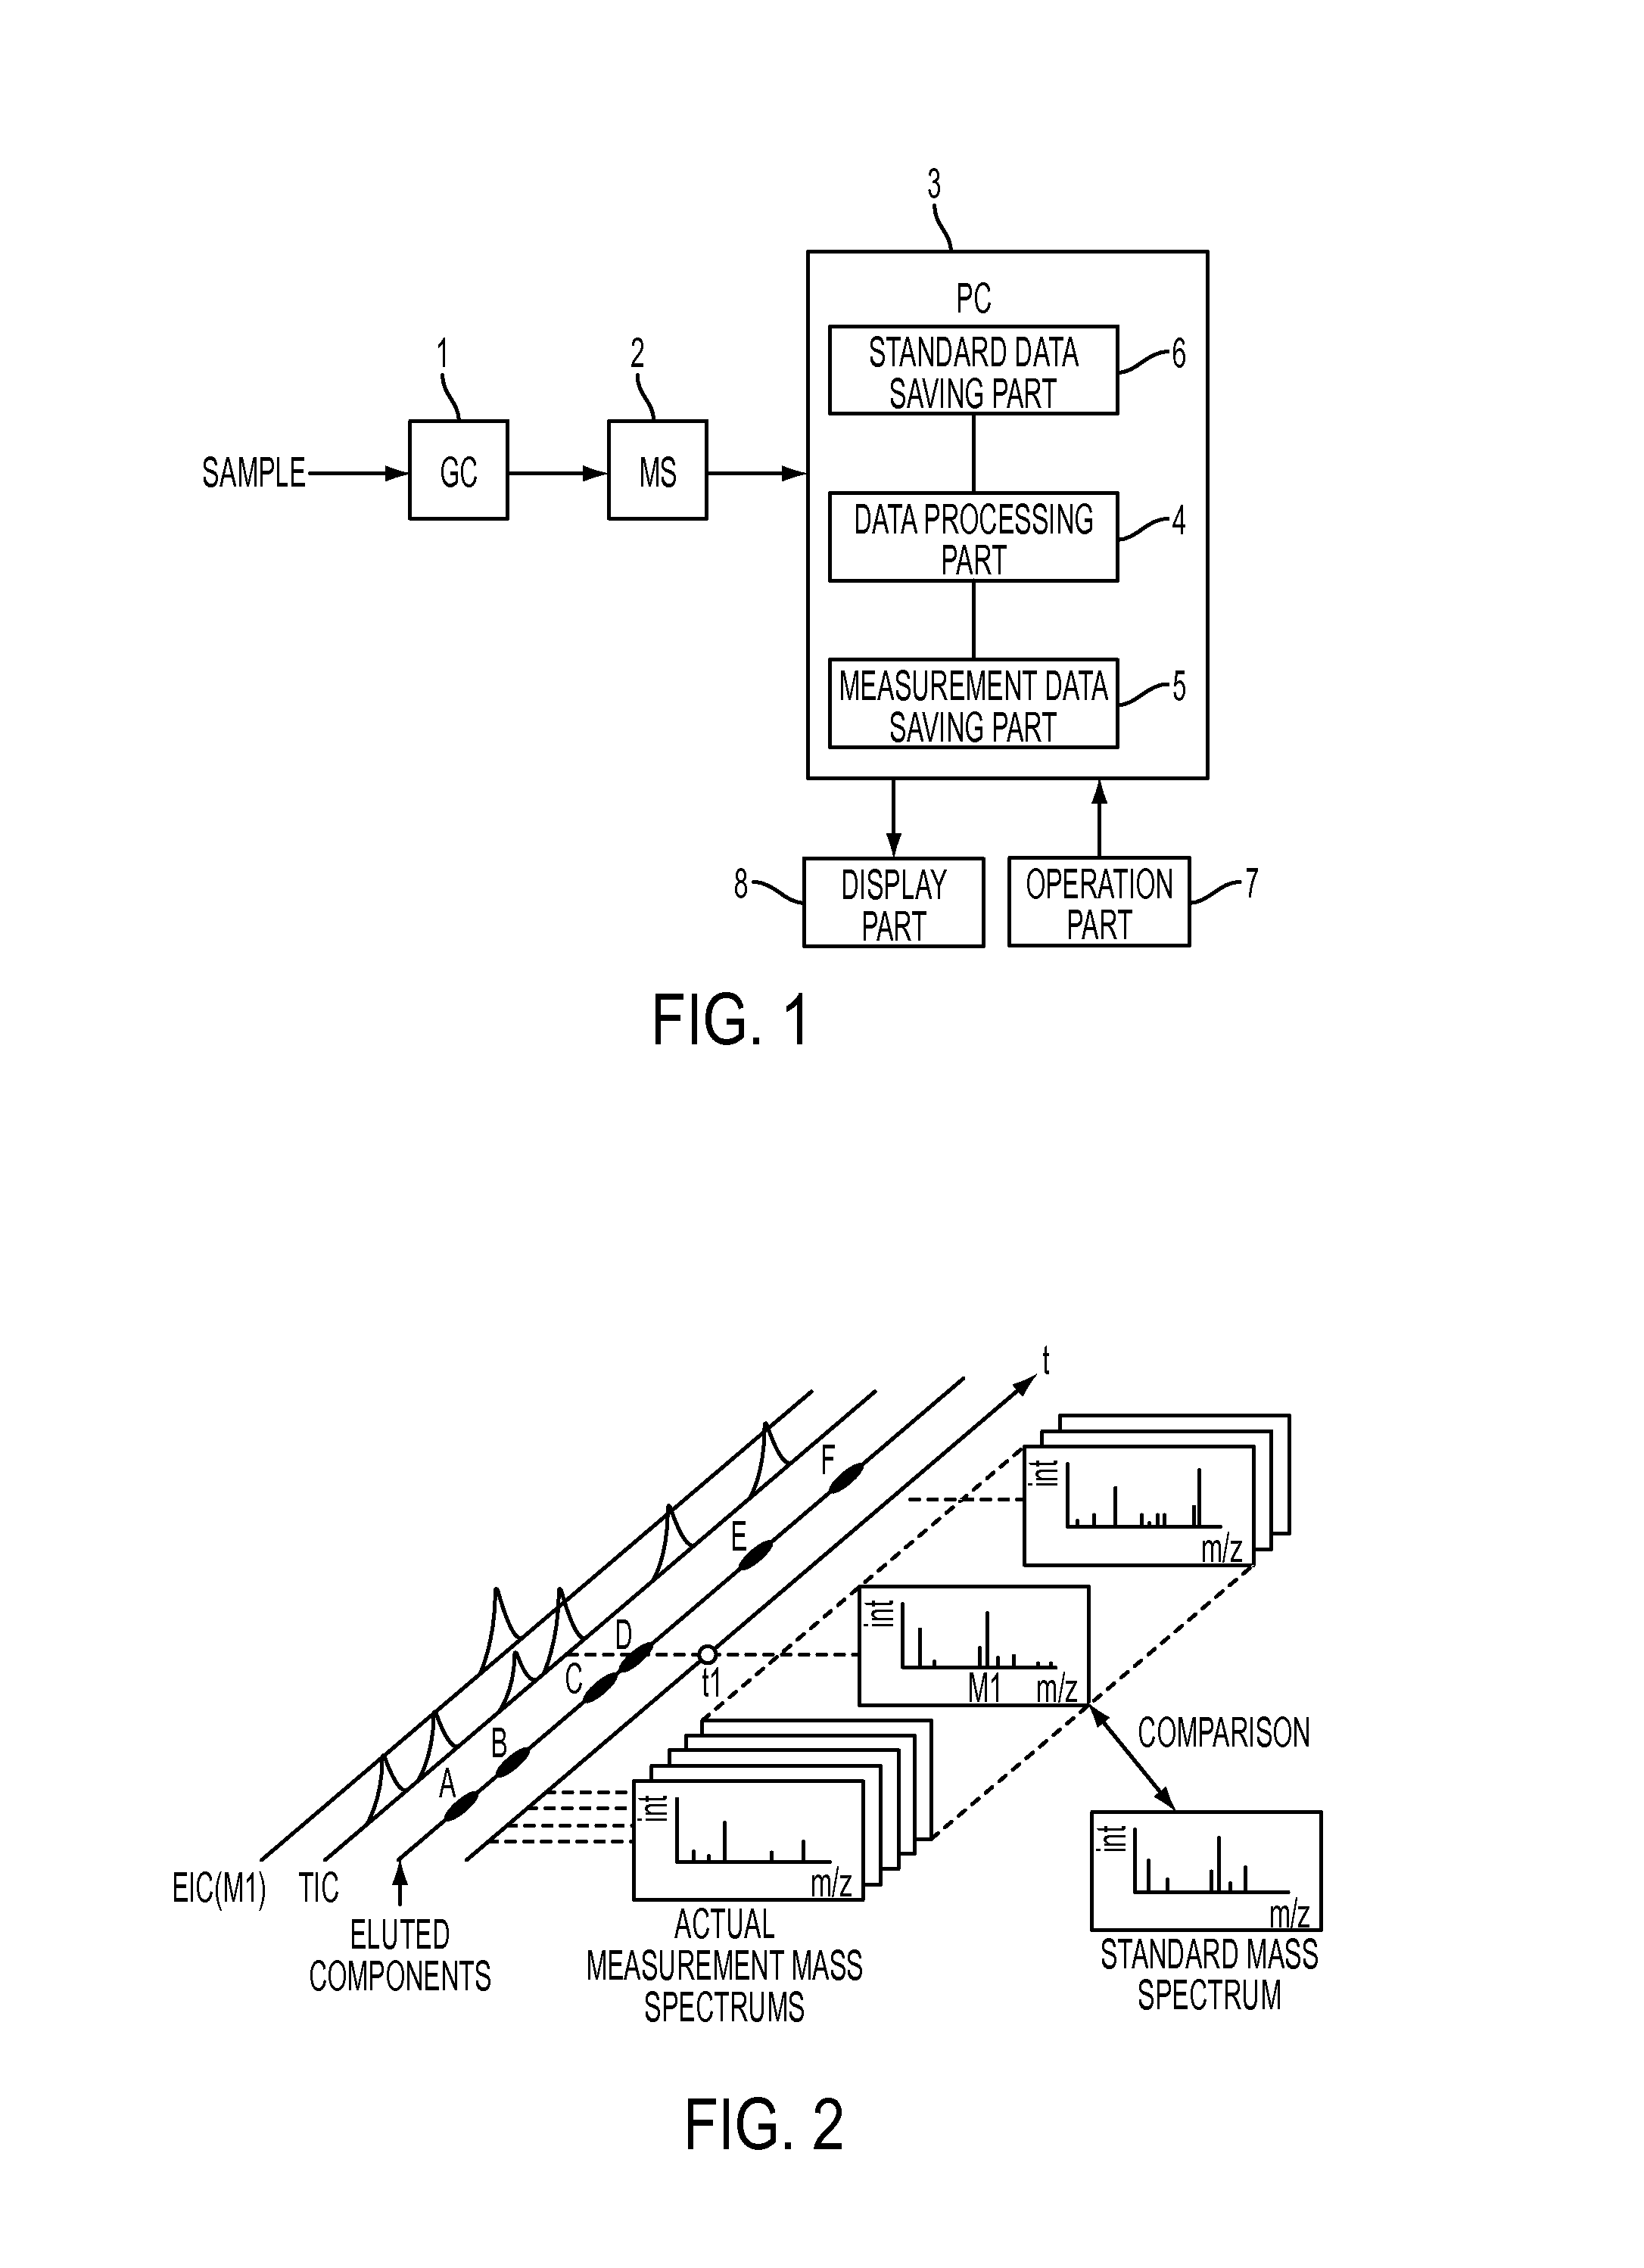
[0027]A GC-MS system containing the chromatograph mass spectrometry data processing device of the present invention will be described below with reference to the attached drawings. FIG. 1 is a schematic block diagram of an embodiment of a GC-MS system according to this embodiment.

[0028]This system is provided with a gas chromatograph (GC) 1 for separating components contained in a sample over time, a mass spectrometer (MS) 2 for separating and detecting each of the separated components according to the mass-charge ratio (strictly speaking, m / z), and a personal computer (PC) 3 for processing data obtained by the MS 2. Dedicated data processing software is installed in the PC 3, the functions of a data processing part 4, a measurement data saving part 5, a standard data saving part 6, and the like shown in the drawing are realized by executing this software with the PC 3. In addition, an operation part 7, which is a pointing device such as a keyboard or a mouse, and a display part 8 a...


PUM


Abstract

When an analyst designates an arbitrary component on a component table displayed in a component table display area, an EIC of the characteristic mass in the vicinity of the retention time of the component is created and is displayed in a chromatogram display area. In addition, an actual measurement mass spectrum at the retention time of the designated component and a pure standard mass spectrum of the component are aligned vertically in the same mass axis scale and displayed in a mass spectrum display area. Further, when the mass axis of one of the mass spectra is magnified / reduced by a dragging operation of a mouse or by a magnification / reduction button, the mass axis of the other mass spectrum is concurrently magnified / reduced.

Description

TECHNICAL FIELD[0001]The present invention relates to a data processing device for processing data collected by a chromatograph mass spectrometer using a mass spectrometer (MS) as a detector for a gas chromatograph (GC) or a liquid chromatograph (LC); more specifically, the present invention relates to data processing technology for a man-machine interface for screen display processing, operation input processing, or the like in a chromatograph mass spectrometer.BACKGROUND ART[0002]In GC / MS analysis, various components contained in a test sample are passed through a column and separated over time, and the ions generated from each of the separated components are separated according to their mass-charge ratios (m / z) by a mass spectrograph such as a quadrupole mass filter and detected with a detector. When identifying unknown compounds contained in a sample, scan measurements of prescribed mass ranges (m / z ranges) are ordinarily executed repeatedly in MS, and a mass spectrum is created...

Claims


Application Information

Patent Timeline
Patent Type & Authority Applications(United States)
IPC IPC(8): G06F19/00
CPCG06F19/708H01J49/0036G01N30/72G01N30/8624G01N30/8675G16C20/20G16C20/80
Inventor TANEDA, KATSUYUKI
Owner SHIMADZU CORP
Why Eureka
Try Eureka