
Method of analyzing hemoglobins

a hemoglobin and analysis method technology, applied in the field of analyzing hemoglobins, can solve the problems of large number of cases requiring separation and detection of hemoglobin s, severe anemia, poor analysis accuracy, etc., and achieve the effects of accurate separation and analysis in a short time, excellent resolution, and convenient hemoglobin separation

Active Publication Date: 2015-01-22
SEKISUI MEDICAL CO LTD
View PDF2 Cites 4 Cited by
  • Summary
  • Abstract
  • Description
  • Claims
  • Application Information

AI Technical Summary

Benefits of technology

This approach enables accurate and rapid separation of hemoglobins, reducing elution time variability and improving quantification precision, facilitating quicker and more reliable diabetes diagnosis and hemoglobinopathy analysis.

Problems solved by technology

Consequently, the analysis may provide poor separation accuracy (e.g. detection of broad elution peaks or elution peaks in a bimodal distribution).
Especially, the number of cases requiring separation and detection of hemoglobin S is large because hemoglobin S is the most common abnormal hemoglobin and causes sickle cell disease which results in severe anemia.
If hemoglobins are eluted in broad elution peaks or elution peaks in a bimodal distribution, separation of the abnormal hemoglobins from normal hemoglobins is difficult and this difficulty may cause a negative impact on obtained measurements.
Furthermore, deteriorated blood samples tend to give broad elution peaks or elution peaks in a bimodal distribution compared to fresh blood samples.
This is because the amount of methemoglobin is increased due to deterioration.
Therefore, in the case of analysis of a preserved sample (e.g. re-examination), there is a possibility of a negative impact on obtained measurements.
However, no matter which technique is used among the techniques of Patent Literatures 1 to 3, HPLC measurement of a blood sample containing hemoglobins in various forms including oxyhemoglobin, deoxyhemoglobin, and methemoglobin possibly results in broad elution peaks or elution peaks in a bimodal distribution.
Such a degasser may cause fluctuations in elution times of hemoglobins and have a negative impact on separation of hemoglobins because its gas removing performance is not stable for a while immediately after start-up.
Especially, immediately after start-up or when the temperature of an eluent is unstable, the HPLC instruments are likely to cause fluctuations in elution times of hemoglobins and deterioration of quantification accuracy.
This extends the time before a first report of analysis for diabetes diagnosis using hemoglobin A1c as a marker although such analysis requires a rapid result.

Method used


Image

  • Method of analyzing hemoglobins
  • Method of analyzing hemoglobins
  • Method of analyzing hemoglobins

Examples


example 1

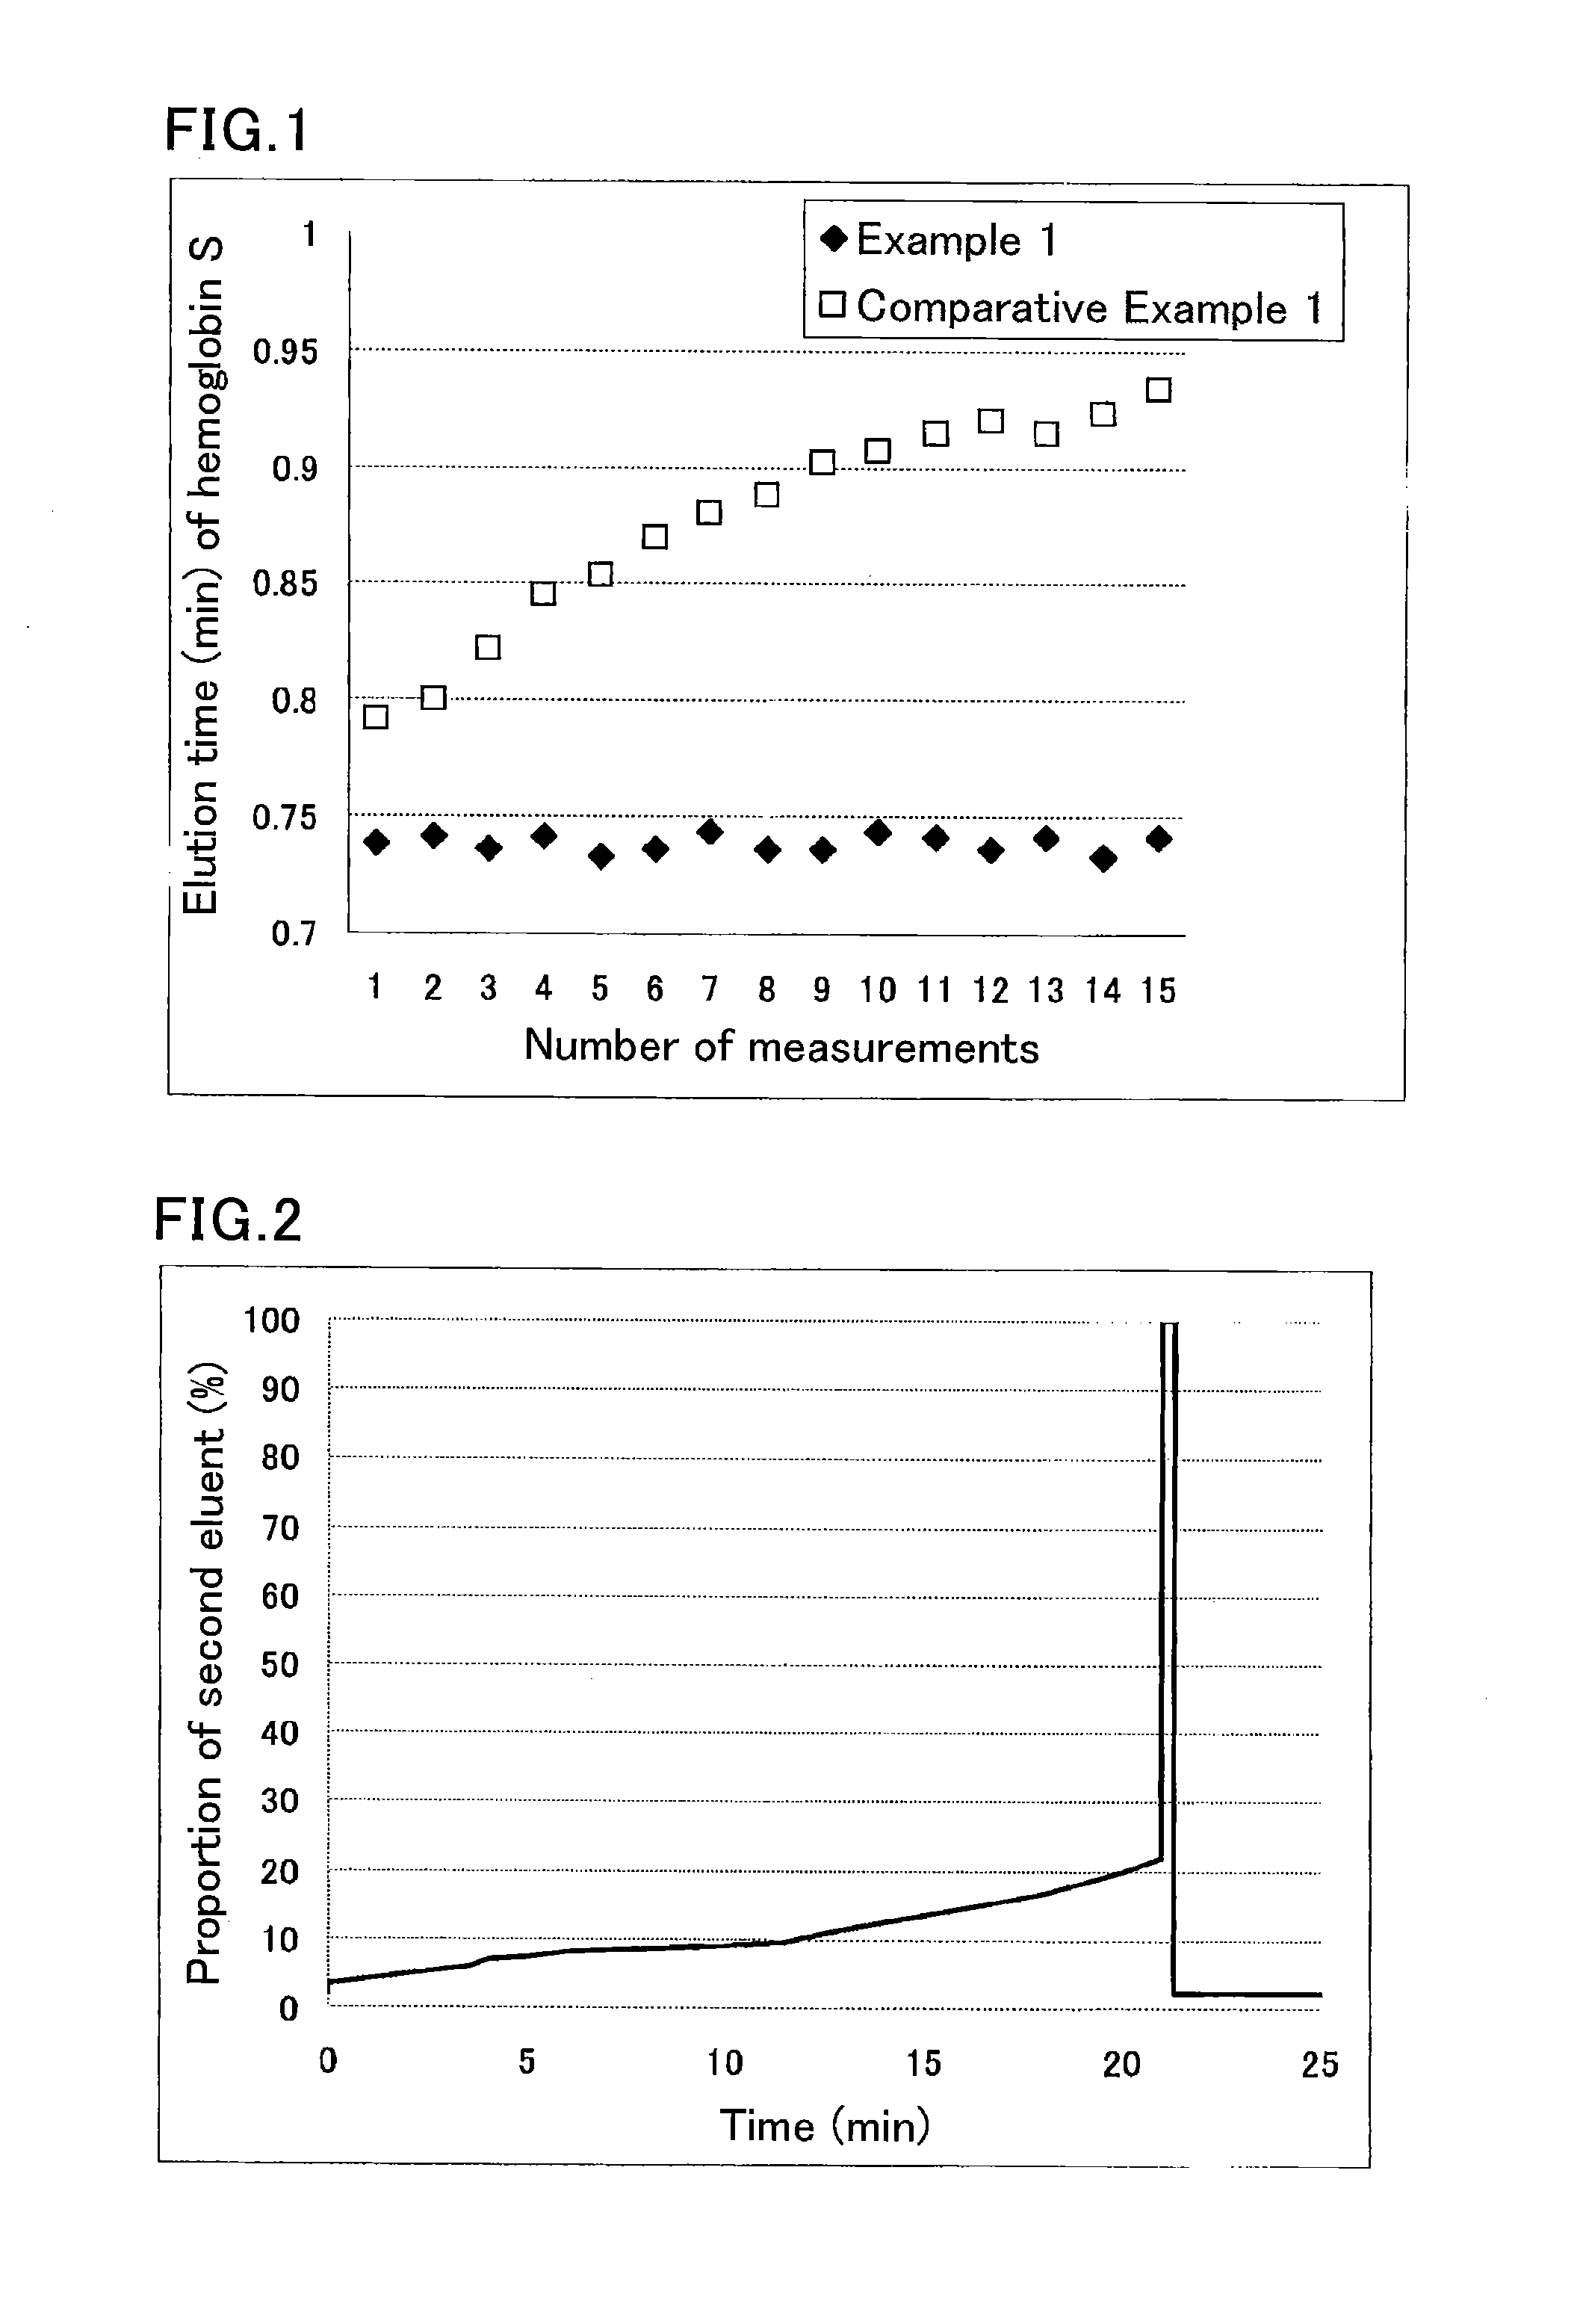
[0075]A sample was prepared by diluting a hemoglobin S-containing blood sample 100-fold with a sample pre-treatment solution (phosphate buffer (pH 7.0) containing 0.1% by weight Triton X-100).

[0076]The used separation column was a column containing cation-exchange resin filler particles having sulfonic acid groups on the surfaces.

[0077]The used HPLC instrument was provided with an autosampler SIL-20AC (Shimadzu Corp.), a delivery pump LC-20AD (Shimadzu Corp.), a degasser DGU-20A5 (Shimadzu Corp.), a column oven CTO-20AC (Shimadzu Corp.), and a detector SPD-M20A (Shimadzu Corp.). The instrument was run under the following conditions:

[0078]eluent flow rate: 1.7 mL / min;

[0079]detection wavelength: 415 nm; and

[0080]amount of introduced sample: 10 μL.

[0081]Each portion of the sample was eluted and measured using the following eluents for the respective periods of time:

[0082]until 0.5 minutes after the start: eluent 1 (40 mmol / L phosphate buffer (pH 5.4) containing 60 mmol / L sodium perchlo...

example 2

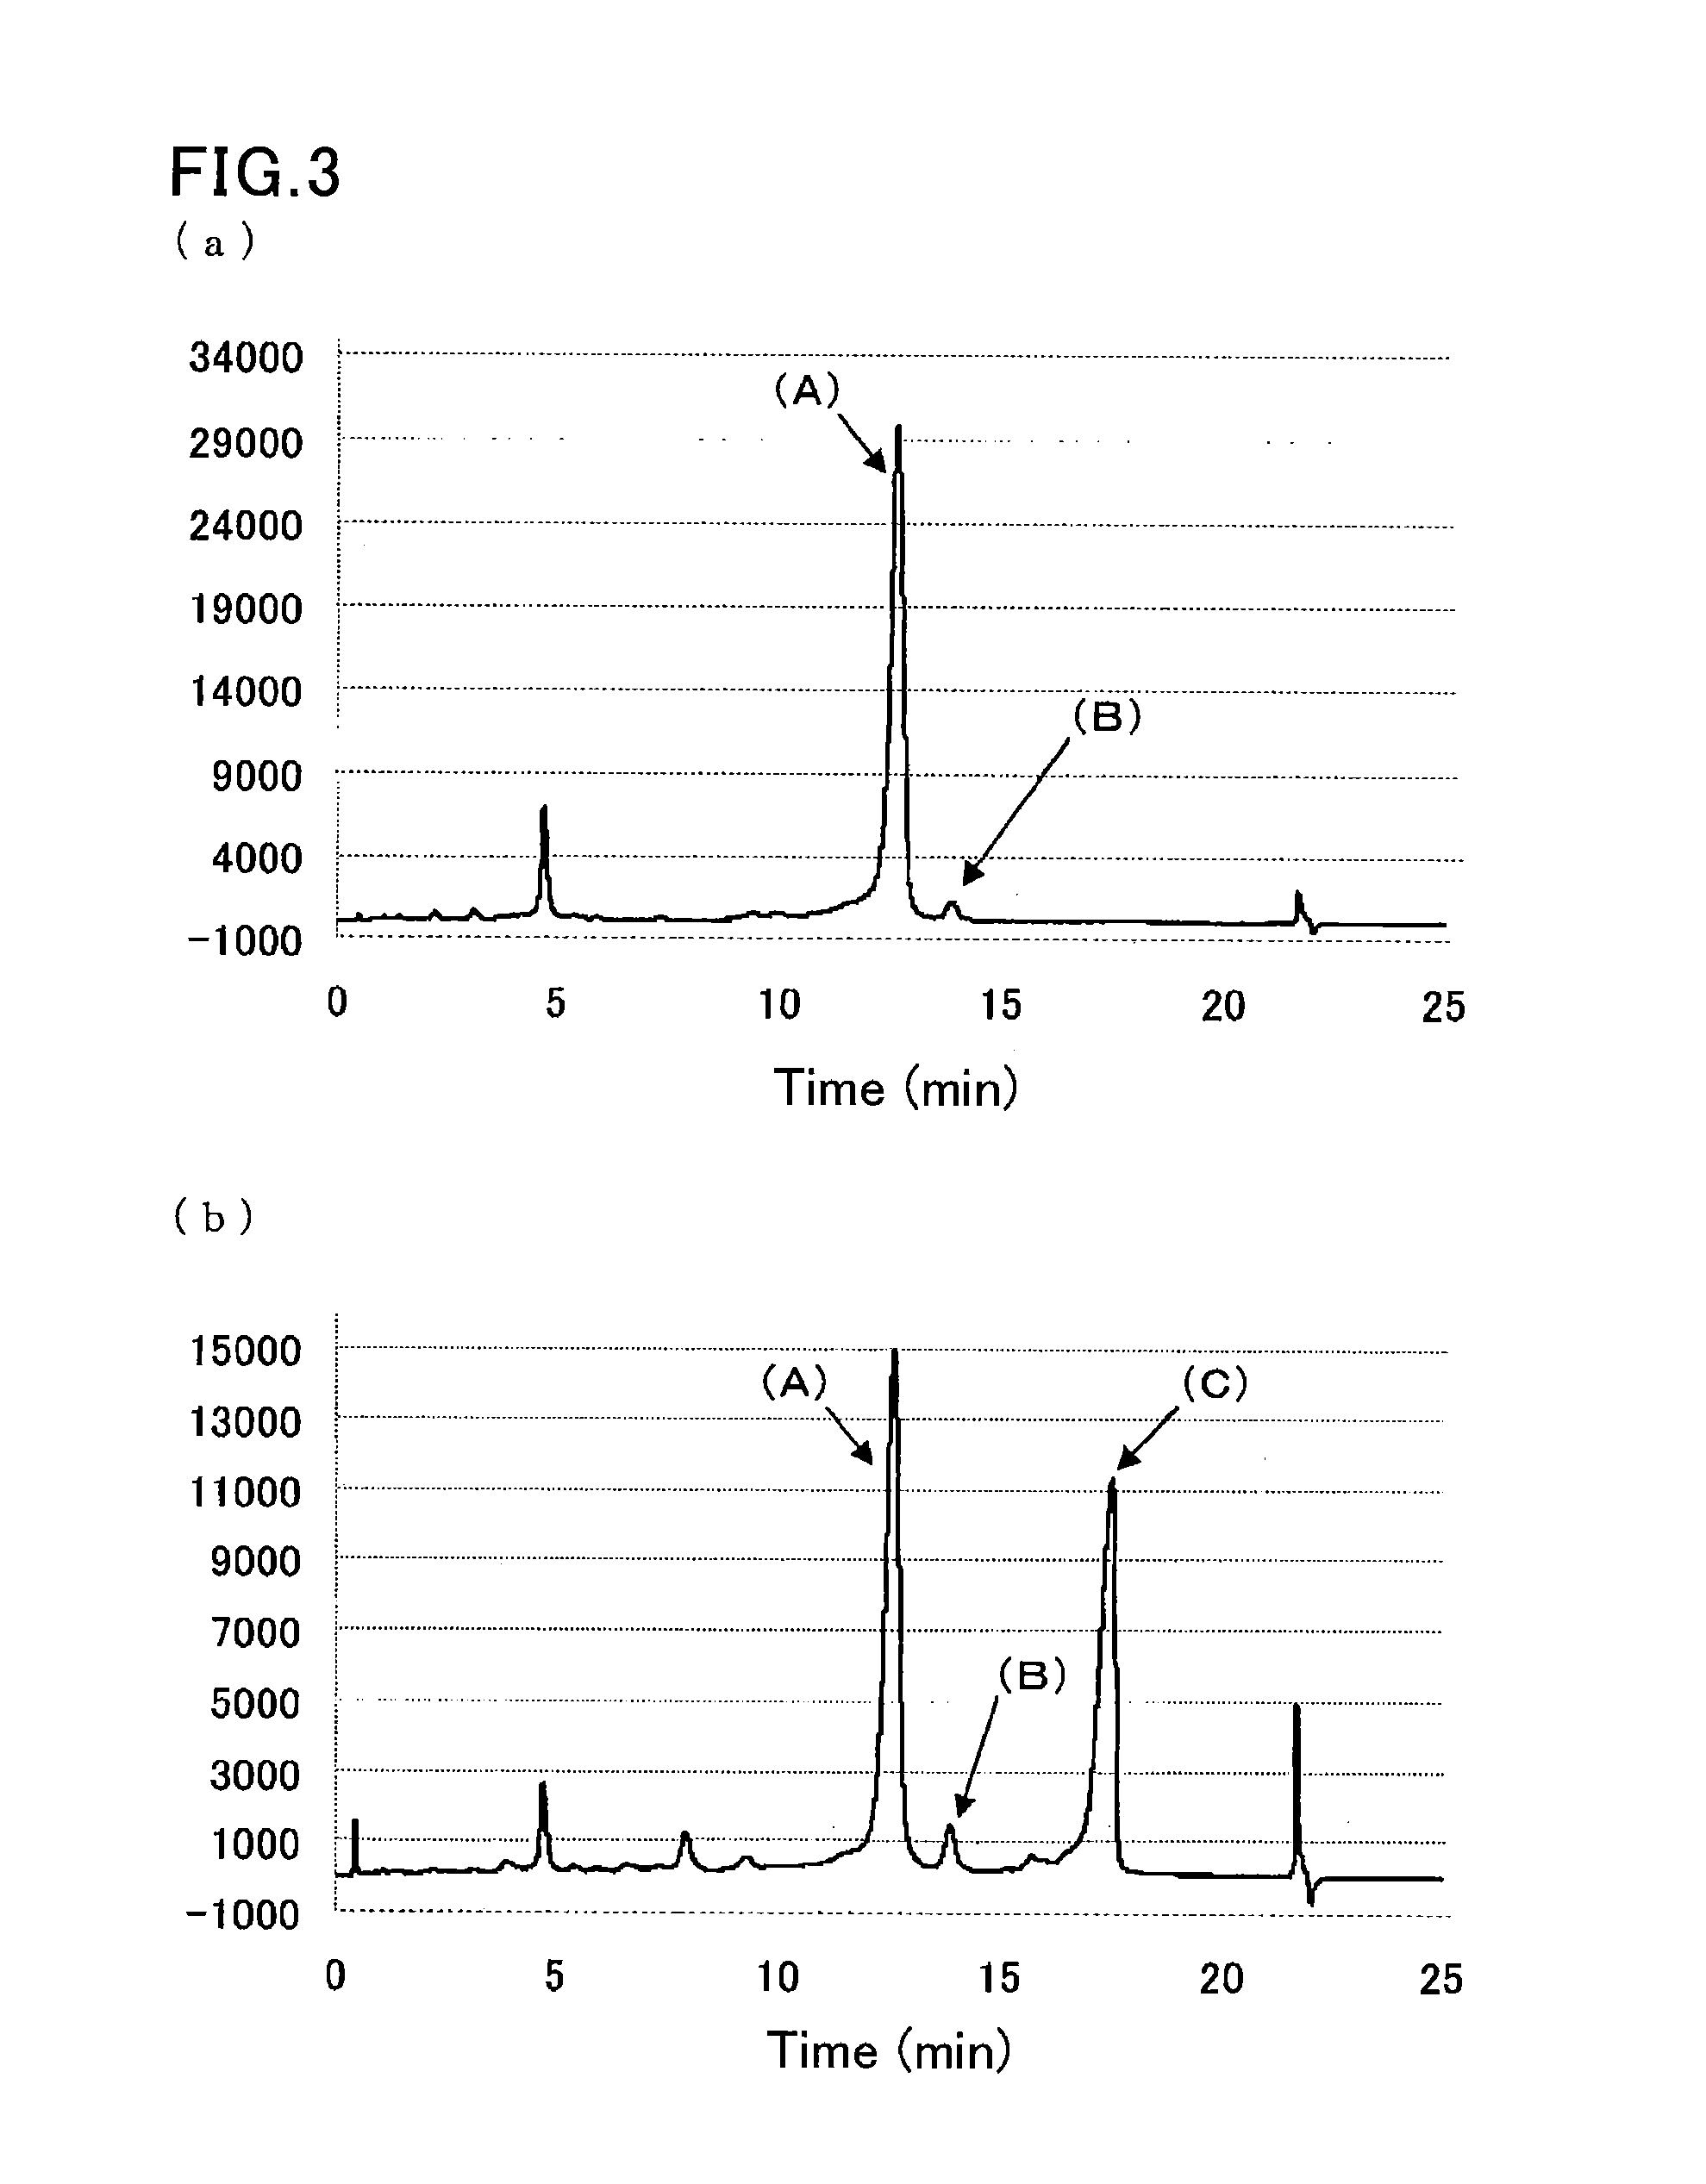
[0090]A sample was prepared by dissolving glycohemoglobin control level II (Sysmex Corp.) in water for injection (200 TL), and further diluting the solution 100-fold with a sample pre-treatment solution (10 mmol / L phosphate buffer (pH 7.0) containing 0.1% by weight Triton X-100).

[0091]Another sample was prepared by diluting a hemoglobin S-containing blood sample 100-fold with the sample pre-treatment solution (10 mmol / L phosphate buffer (pH 7.0) containing 0.1% by weight Triton X-100).

[0092]The same separation column as that of Example 1 was used.

[0093]The same HPLC instrument as that of Example 1 was run under the following conditions:

[0094]flow rate: 1.7 mL / min;

[0095]detection wavelength: 415 nm; and

[0096]amount of introduced sample: 10 μL.

[0097]Each sample was eluted and measured by linear gradient of two eluents:

[0098]first eluent: eluent 6 (20 mmol / L phosphate buffer (pH 5.4) containing 30 mmol / L sodium perchlorate, 1 mmol / L sodium nitrite, and 1 mmol / L sodium azide); and

[0099]...

example 3

[0101]A sample was prepared by dissolving glycohemoglobin control level II (Sysmex Corp.) in water for injection (200 μL), and further diluting the solution 100-fold with a sample pre-treatment solution (10 mmol / L phosphate buffer (pH 7.0) containing 0.1% by weight Triton X-100, 1 mmol / L sodium nitrite, and 1 mmol / L sodium azide).

[0102]Another sample was prepared by diluting a hemoglobin S-containing blood sample 100-fold with the sample pre-treatment solution (10 mmol / L phosphate buffer (pH 7.0) containing 0.1% by weight Triton X-100, 1 mmol / L sodium nitrite, and 1 mmol / L sodium azide).

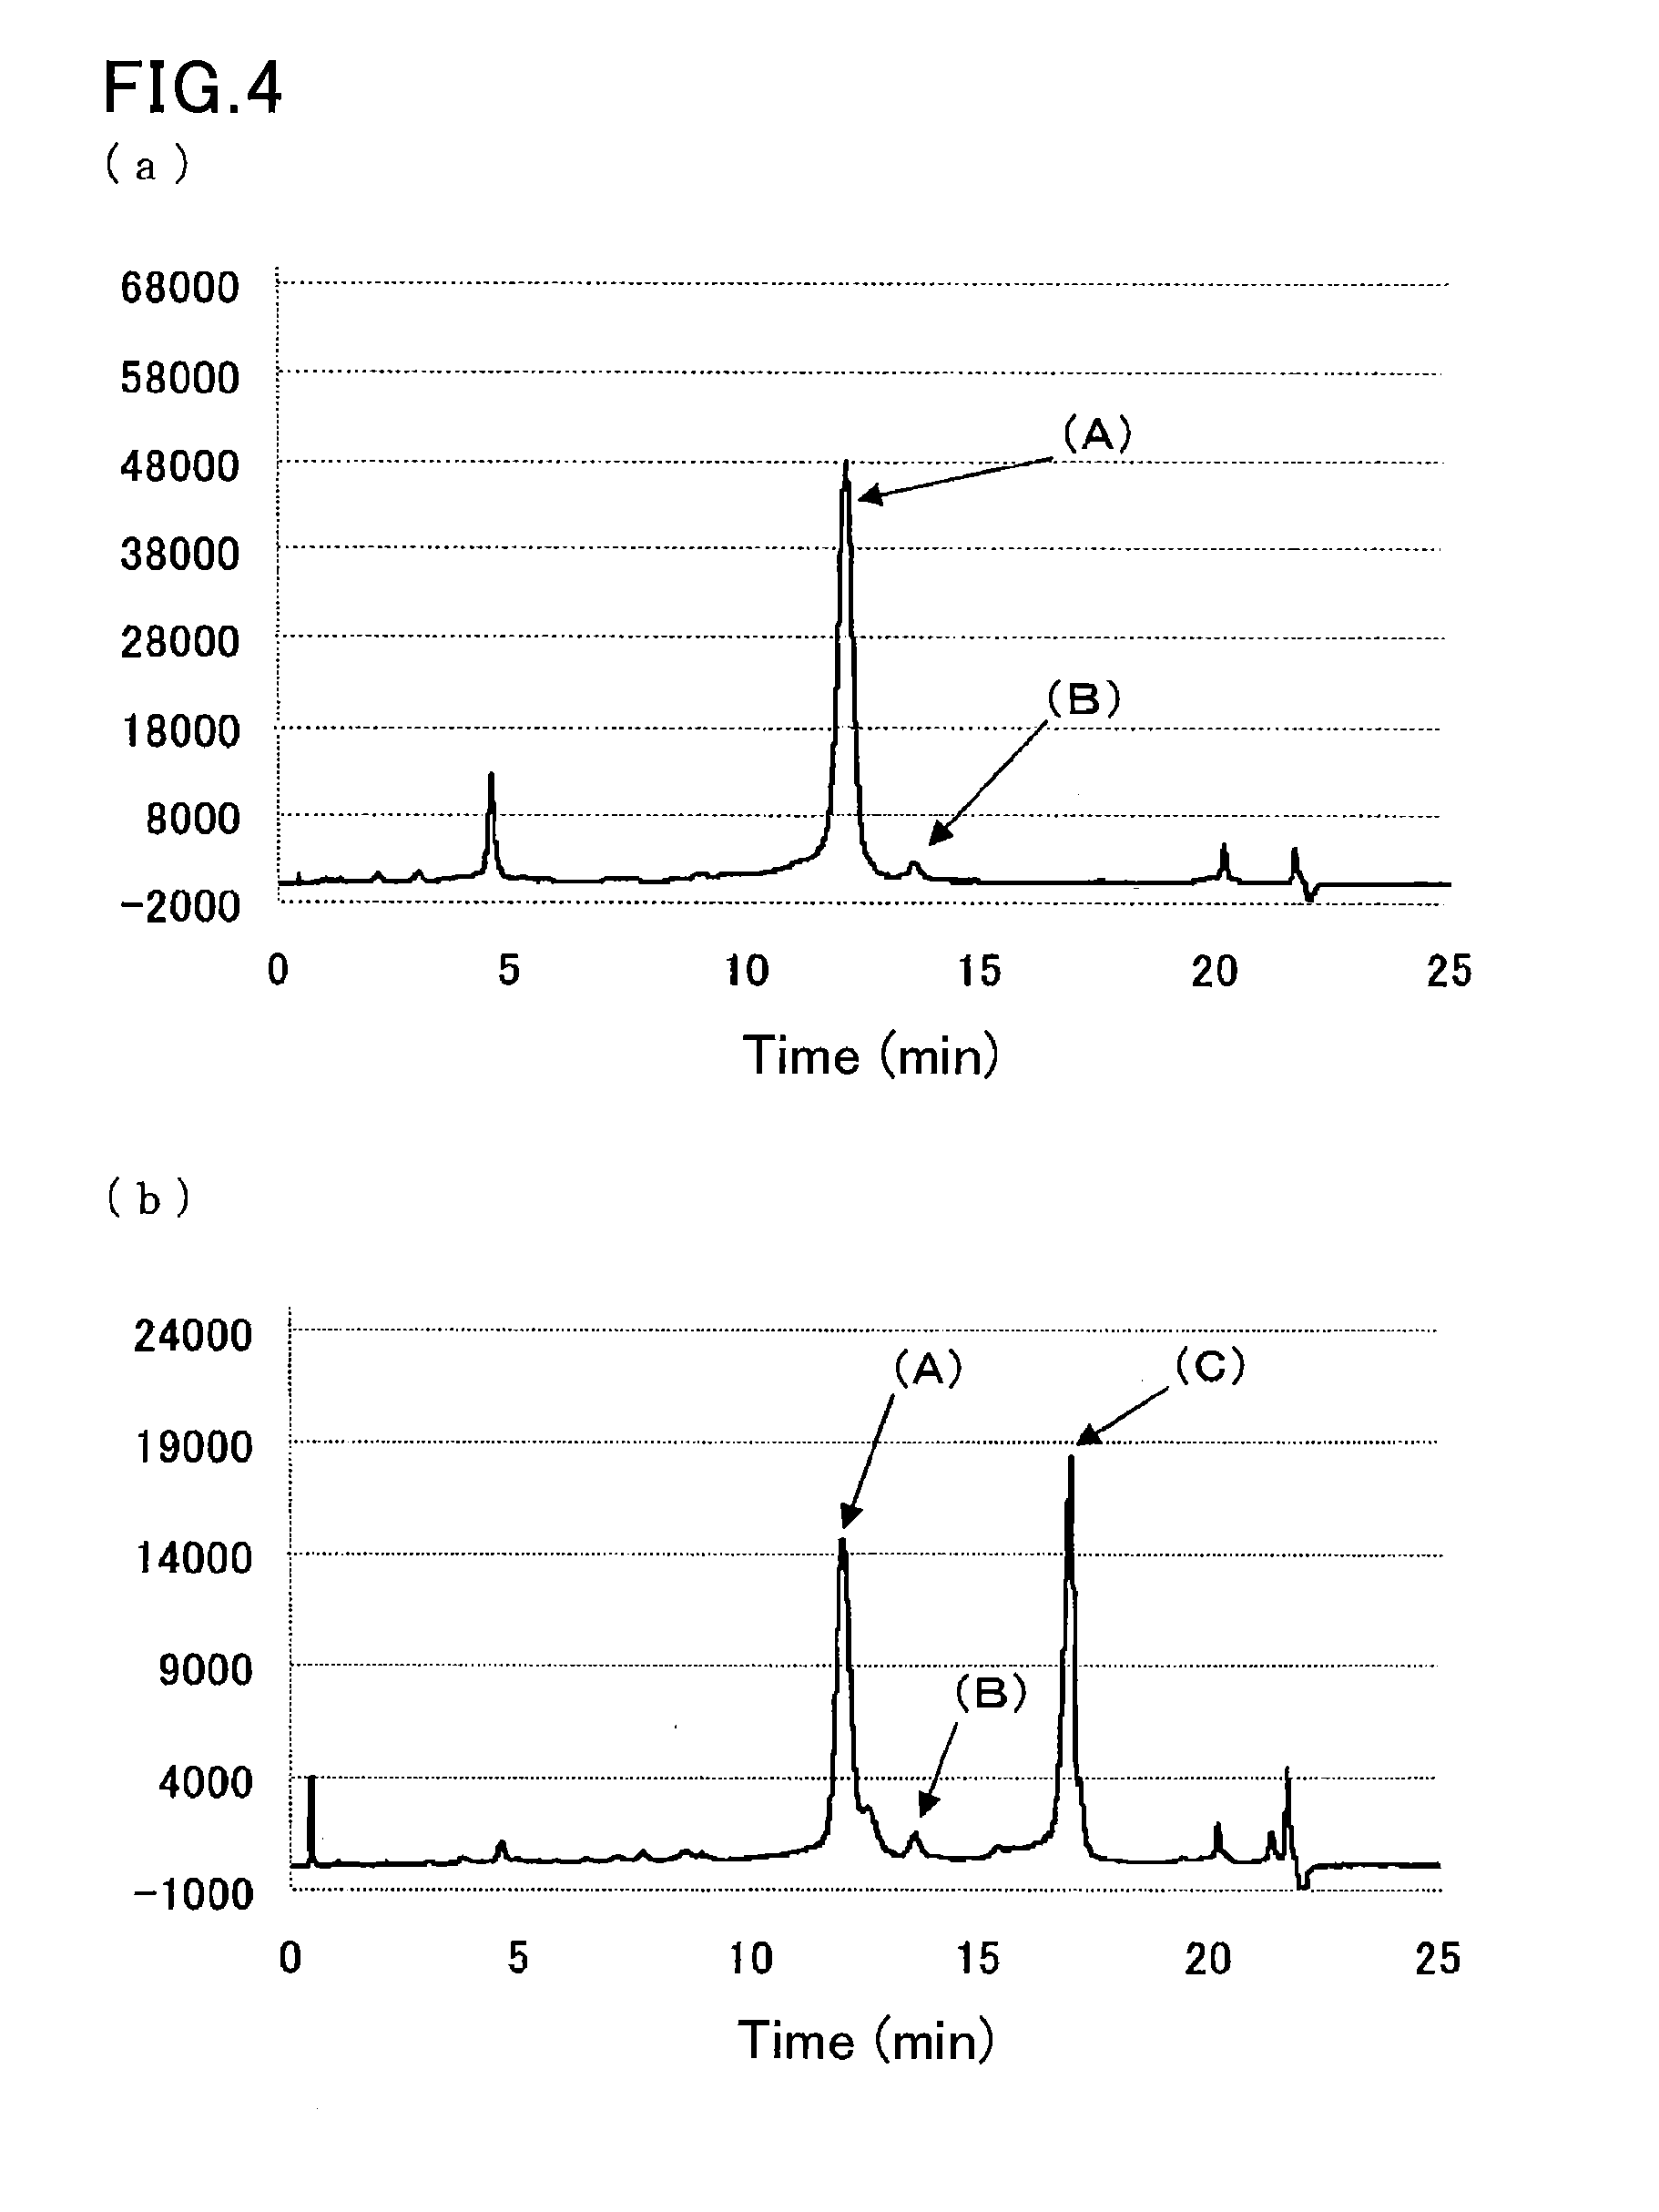
[0103]The samples were measured in the same manner as in Example 2, except that eluent 3 (40 mmol / L phosphate buffer (pH 8.0) containing 0.8% by weight Triton X-100, 300 mmol / L sodium perchlorate, and 1 mmol / L sodium azide) used in Example 1 was used as the second eluent. FIG. 4 are the resulting chromatograms.


PUM

PropertyMeasurementUnit
flow rateaaaaaaaaaa
flow rateaaaaaaaaaa
detection wavelengthaaaaaaaaaa

Abstract

An object of the present invention is to provide a method for analyzing hemoglobins which can accurately separate hemoglobins in a short time by liquid chromatography.The present invention provides a method for analyzing hemoglobins by liquid chromatography which includes pre-treating a sample with an oxidant and a binder for trivalent heme iron.

Description

TECHNICAL FIELD[0001]The present invention relates to a method for analyzing hemoglobins by separating hemoglobins by liquid chromatography.BACKGROUND ART[0002]High-performance liquid chromatography (HPLC) analysis of hemoglobins is a widely used technique. Specifically, this technique is used, for example, to quantify a glycohemoglobin known as hemoglobin A1c or to analyze abnormal hemoglobins for diagnosis of diabetes. For example, a method utilizing liquid chromatography has been known which separates hemoglobin components in a diluted hemolyzed blood sample by a cation-exchange method based on the difference in positive charge among the hemoglobin components. A recent increase in patients with diabetes has also increased the number of cases requiring measurement of hemoglobin A1c. This tendency has created a demand for more accurate, less time-consuming measurement by HPLC.[0003]Hemoglobins are present in the body in the forms of oxyhemoglobin that contains bound oxygen, deoxyhe...

Claims


Application Information

Patent Timeline
Patent Type & Authority Applications(United States)
IPC IPC(8): G01N33/72
CPCG01N2440/00G01N33/721B01D15/362G01N30/34G01N33/96G01N2030/8831G01N30/96G01N30/06G01N2030/067G01N2030/8822
Inventor TAIRA, HIROAKIOKA, TAKAYUKI
Owner SEKISUI MEDICAL CO LTD
Learn More