Method for detecting nano-particles

a nano-particle and nano-particle technology, applied in the field of instruments and analysis, can solve the problems of low signal strength, inability to detect nano-particles with smaller particle size, and inability to detect smaller nano-particles with lower refractivity

Active Publication Date: 2015-08-20
NANOFCM INC
View PDF1 Cites 9 Cited by
  • Summary
  • Abstract
  • Description
  • Claims
  • Application Information

AI Technical Summary

Benefits of technology

[0006]With the technical solution described above, the method provided in the present invention can be used to detect low-refractivity nano-particles with 24-1,000 nm particle size (e.g. polystyrene and silicon dioxide nano-particles) and gold nano-particles with 6.7-150 nm particle size.

Problems solved by technology

However, the technical solution disclosed in the technical literatures can only detect polystyrene nano-particles in particle size greater than 100 nm, but can't detect smaller nano-particles with lower-refractivity.
For nano-particles, the intensity of scattered light is attenuated at a rate proportional to sixth-power of particle size, i.e. when the particle size is halved, the signal strength will be decreased by 64 times. Therefore, it is difficult to detect nano-particles with smaller particle size.

Method used


Image

  • Method for detecting nano-particles
  • Method for detecting nano-particles
  • Method for detecting nano-particles

Examples


example 1

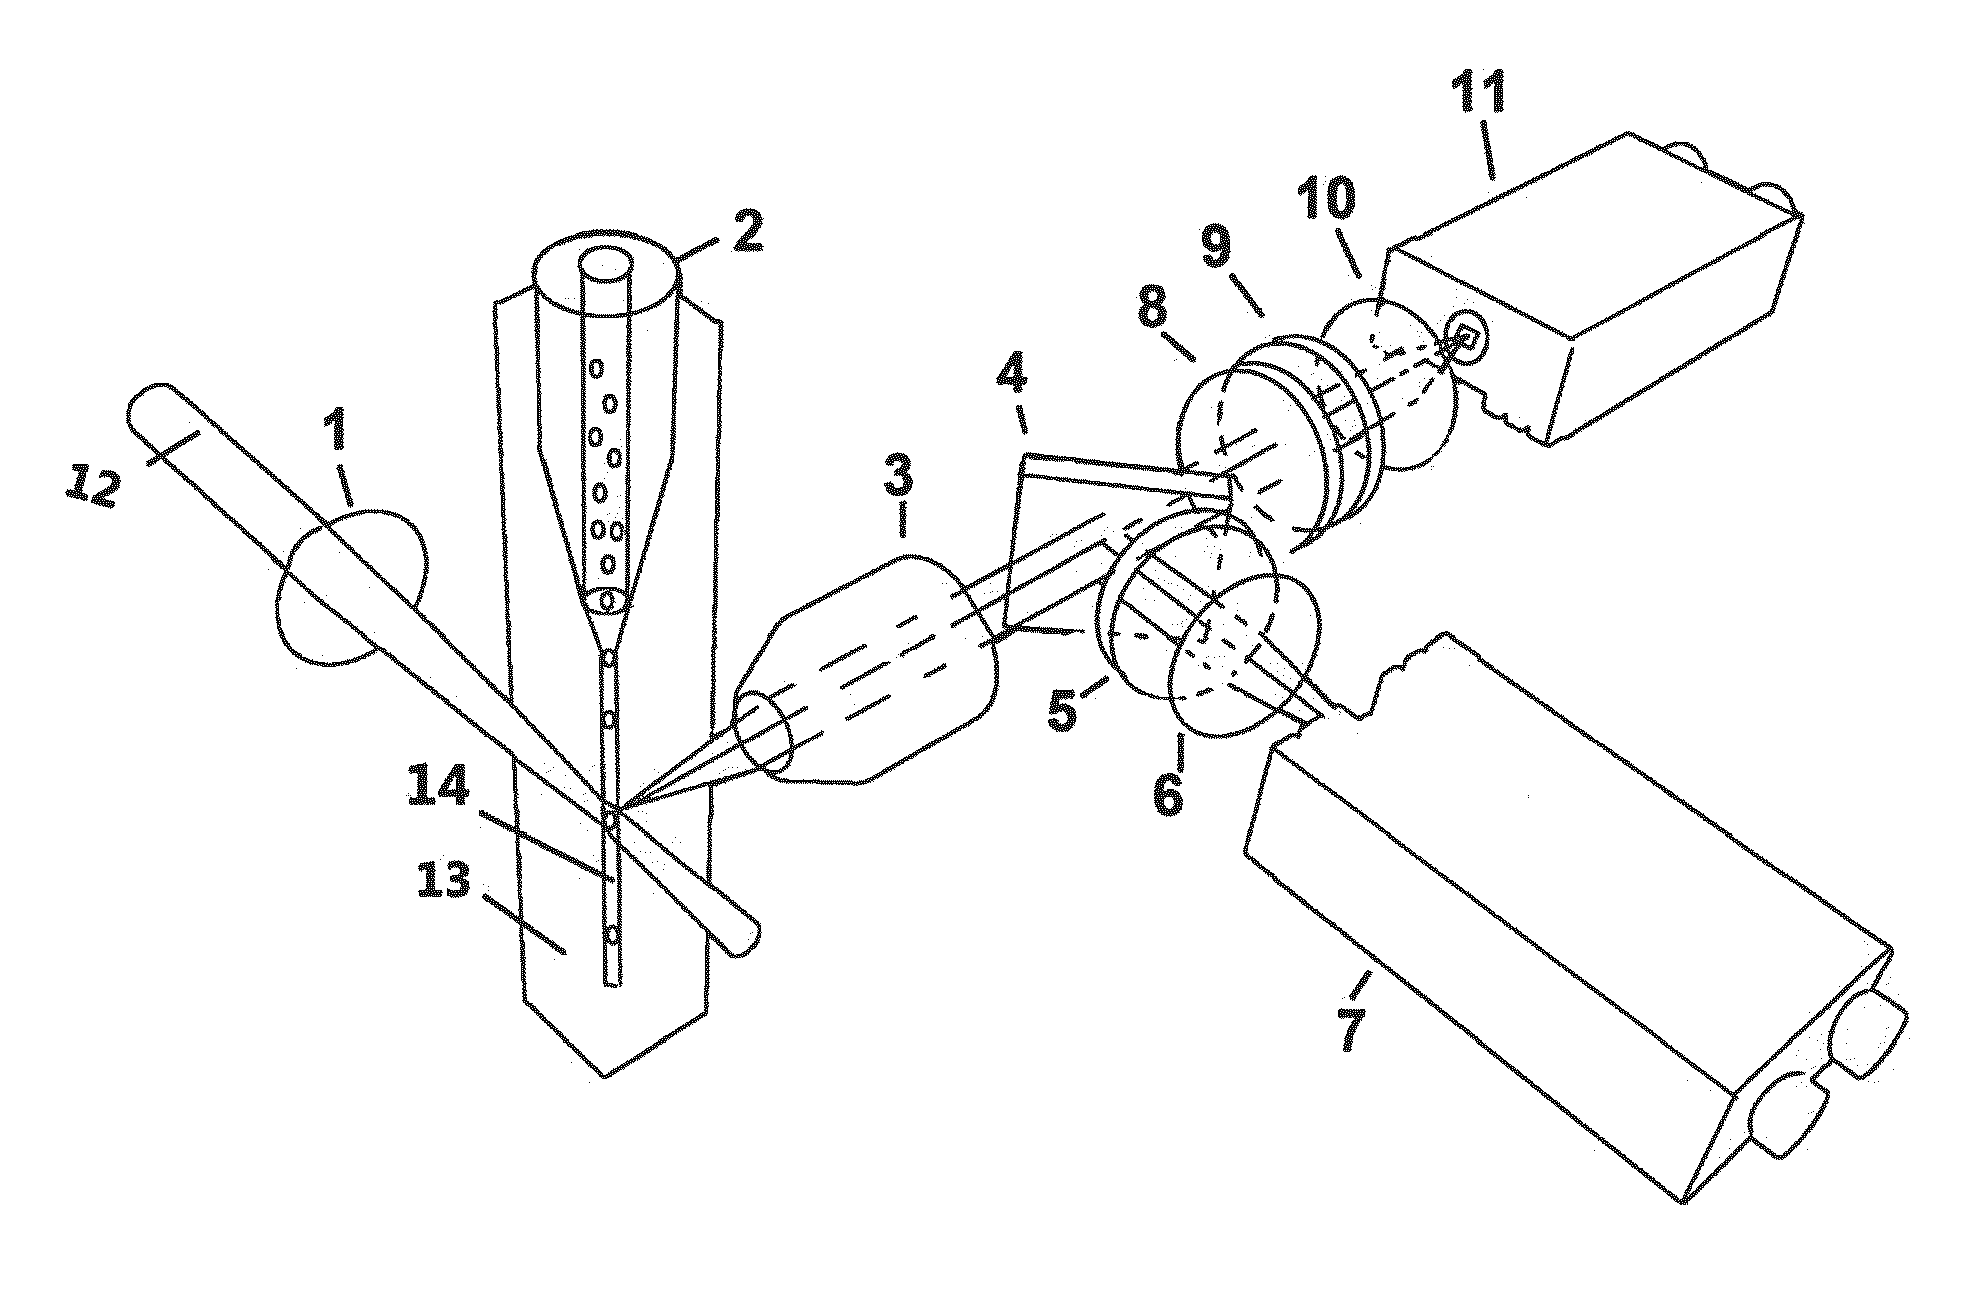
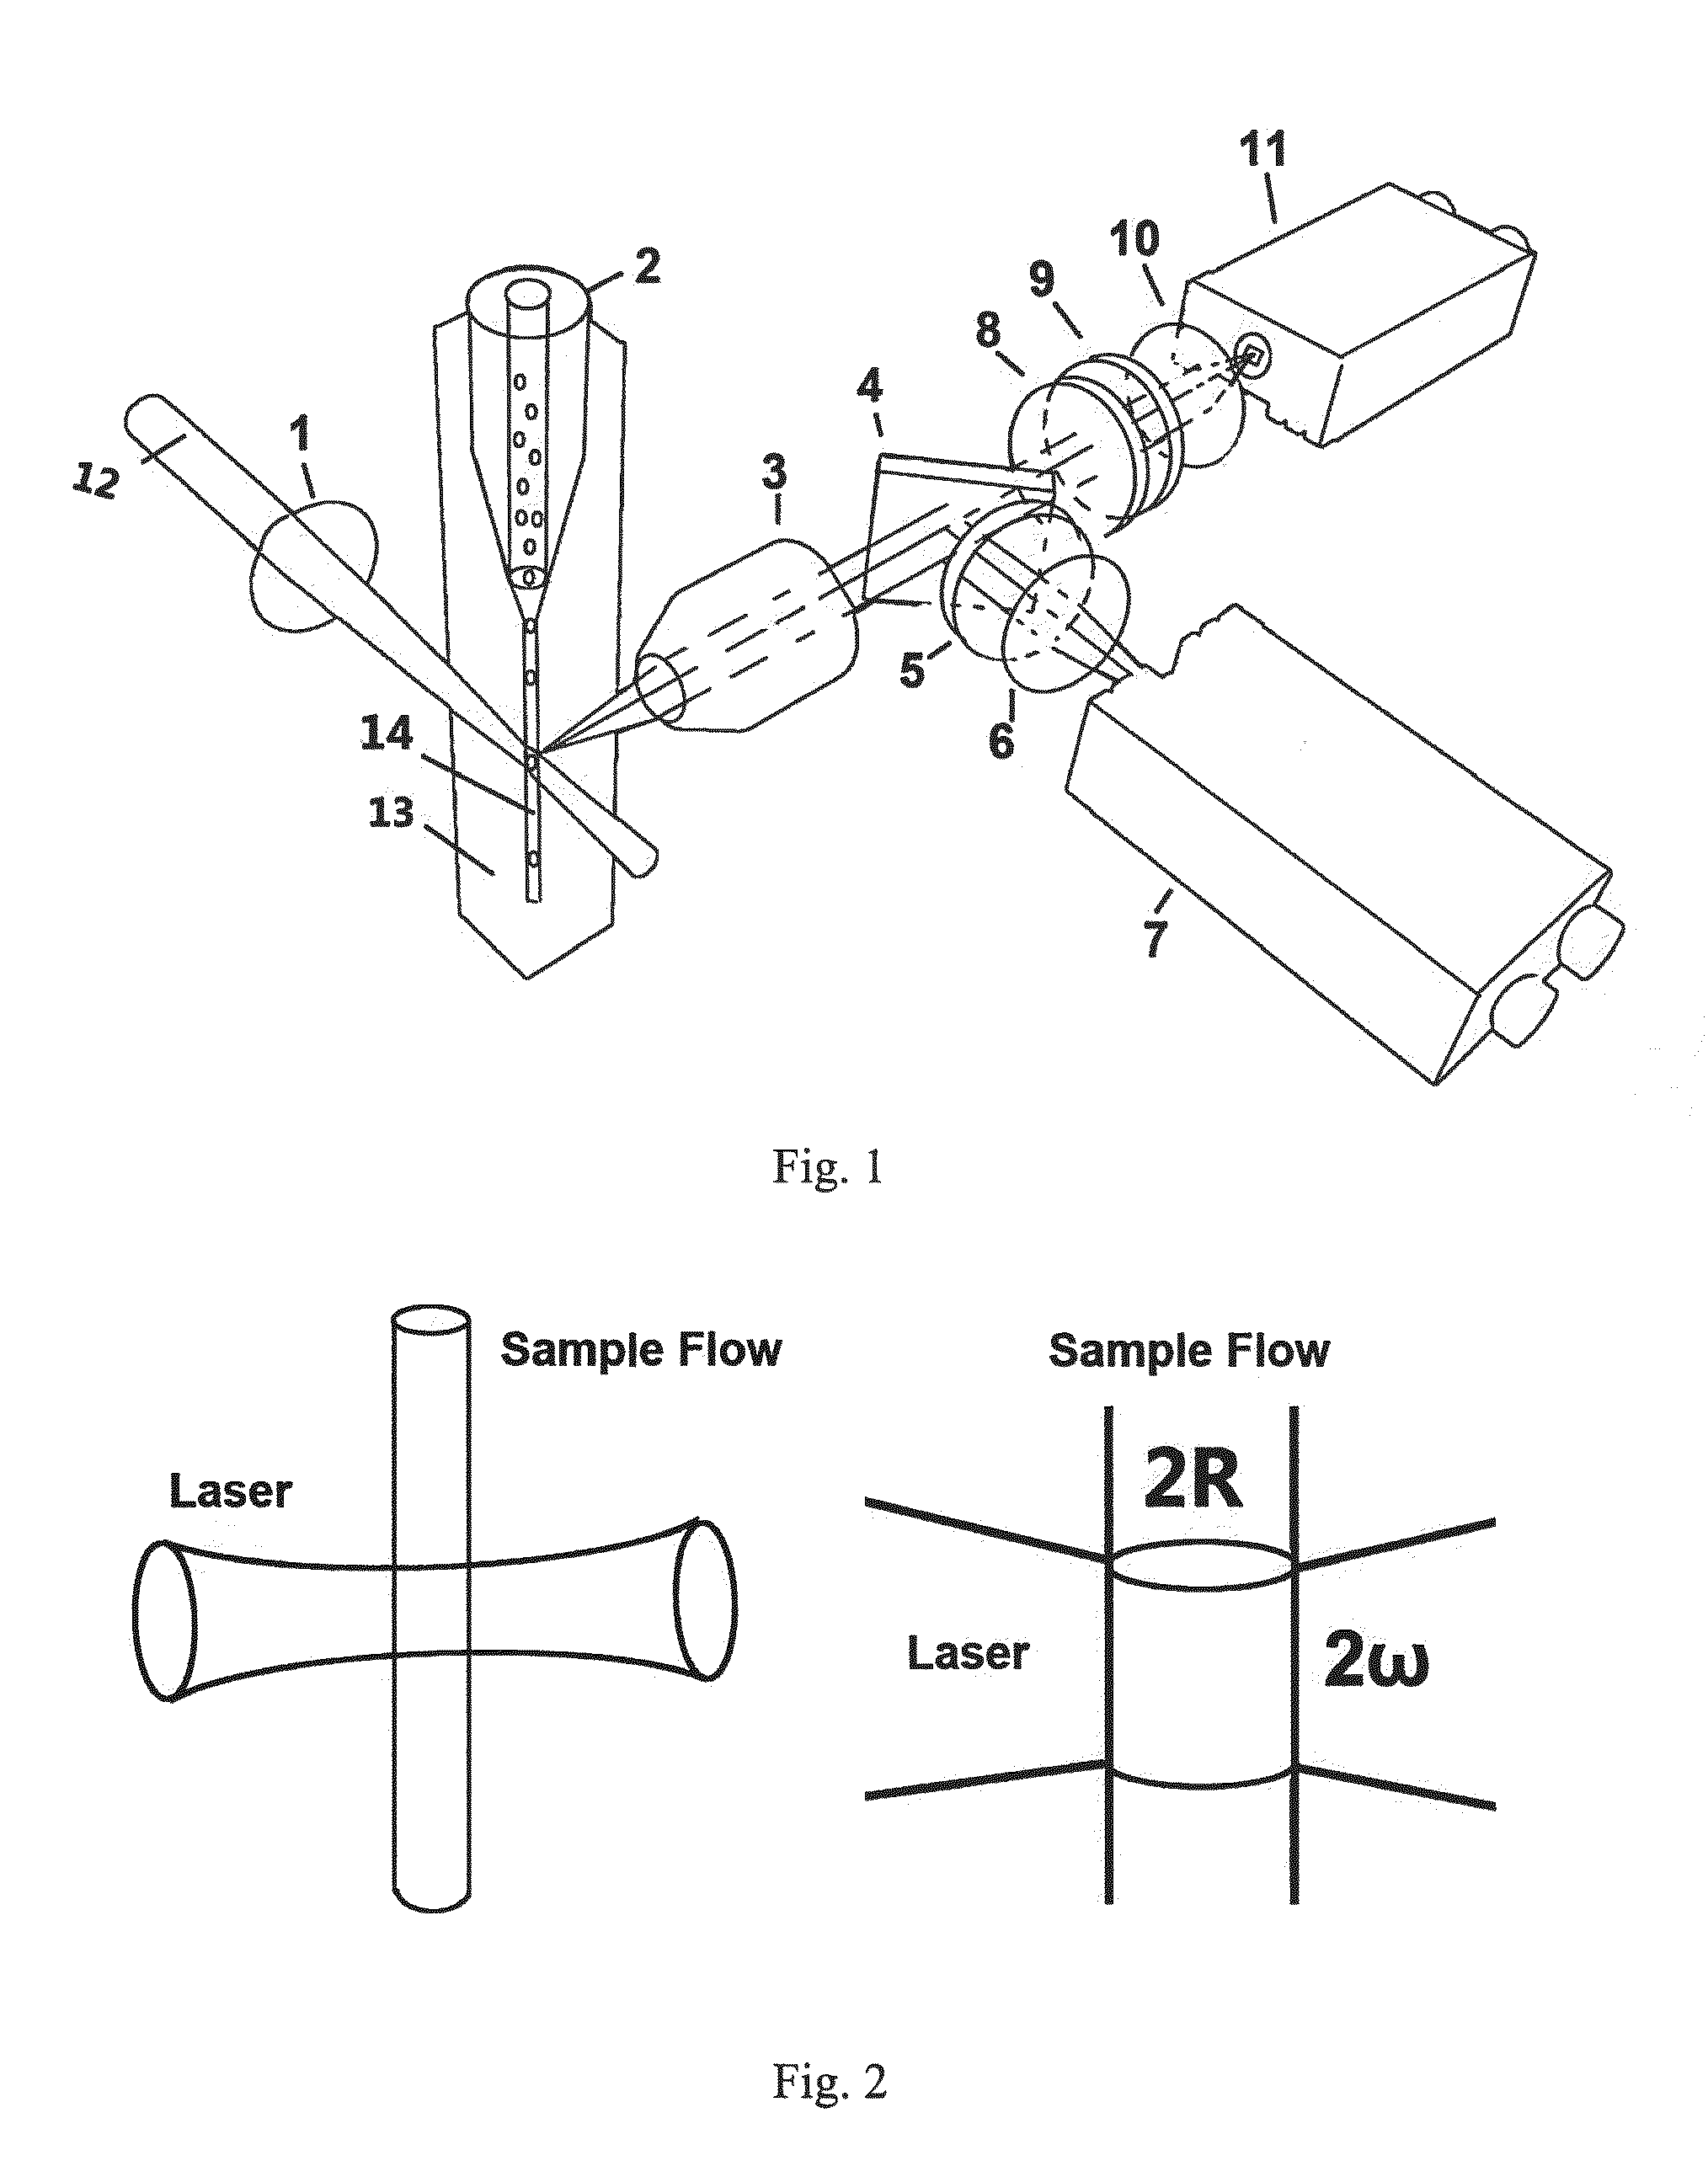
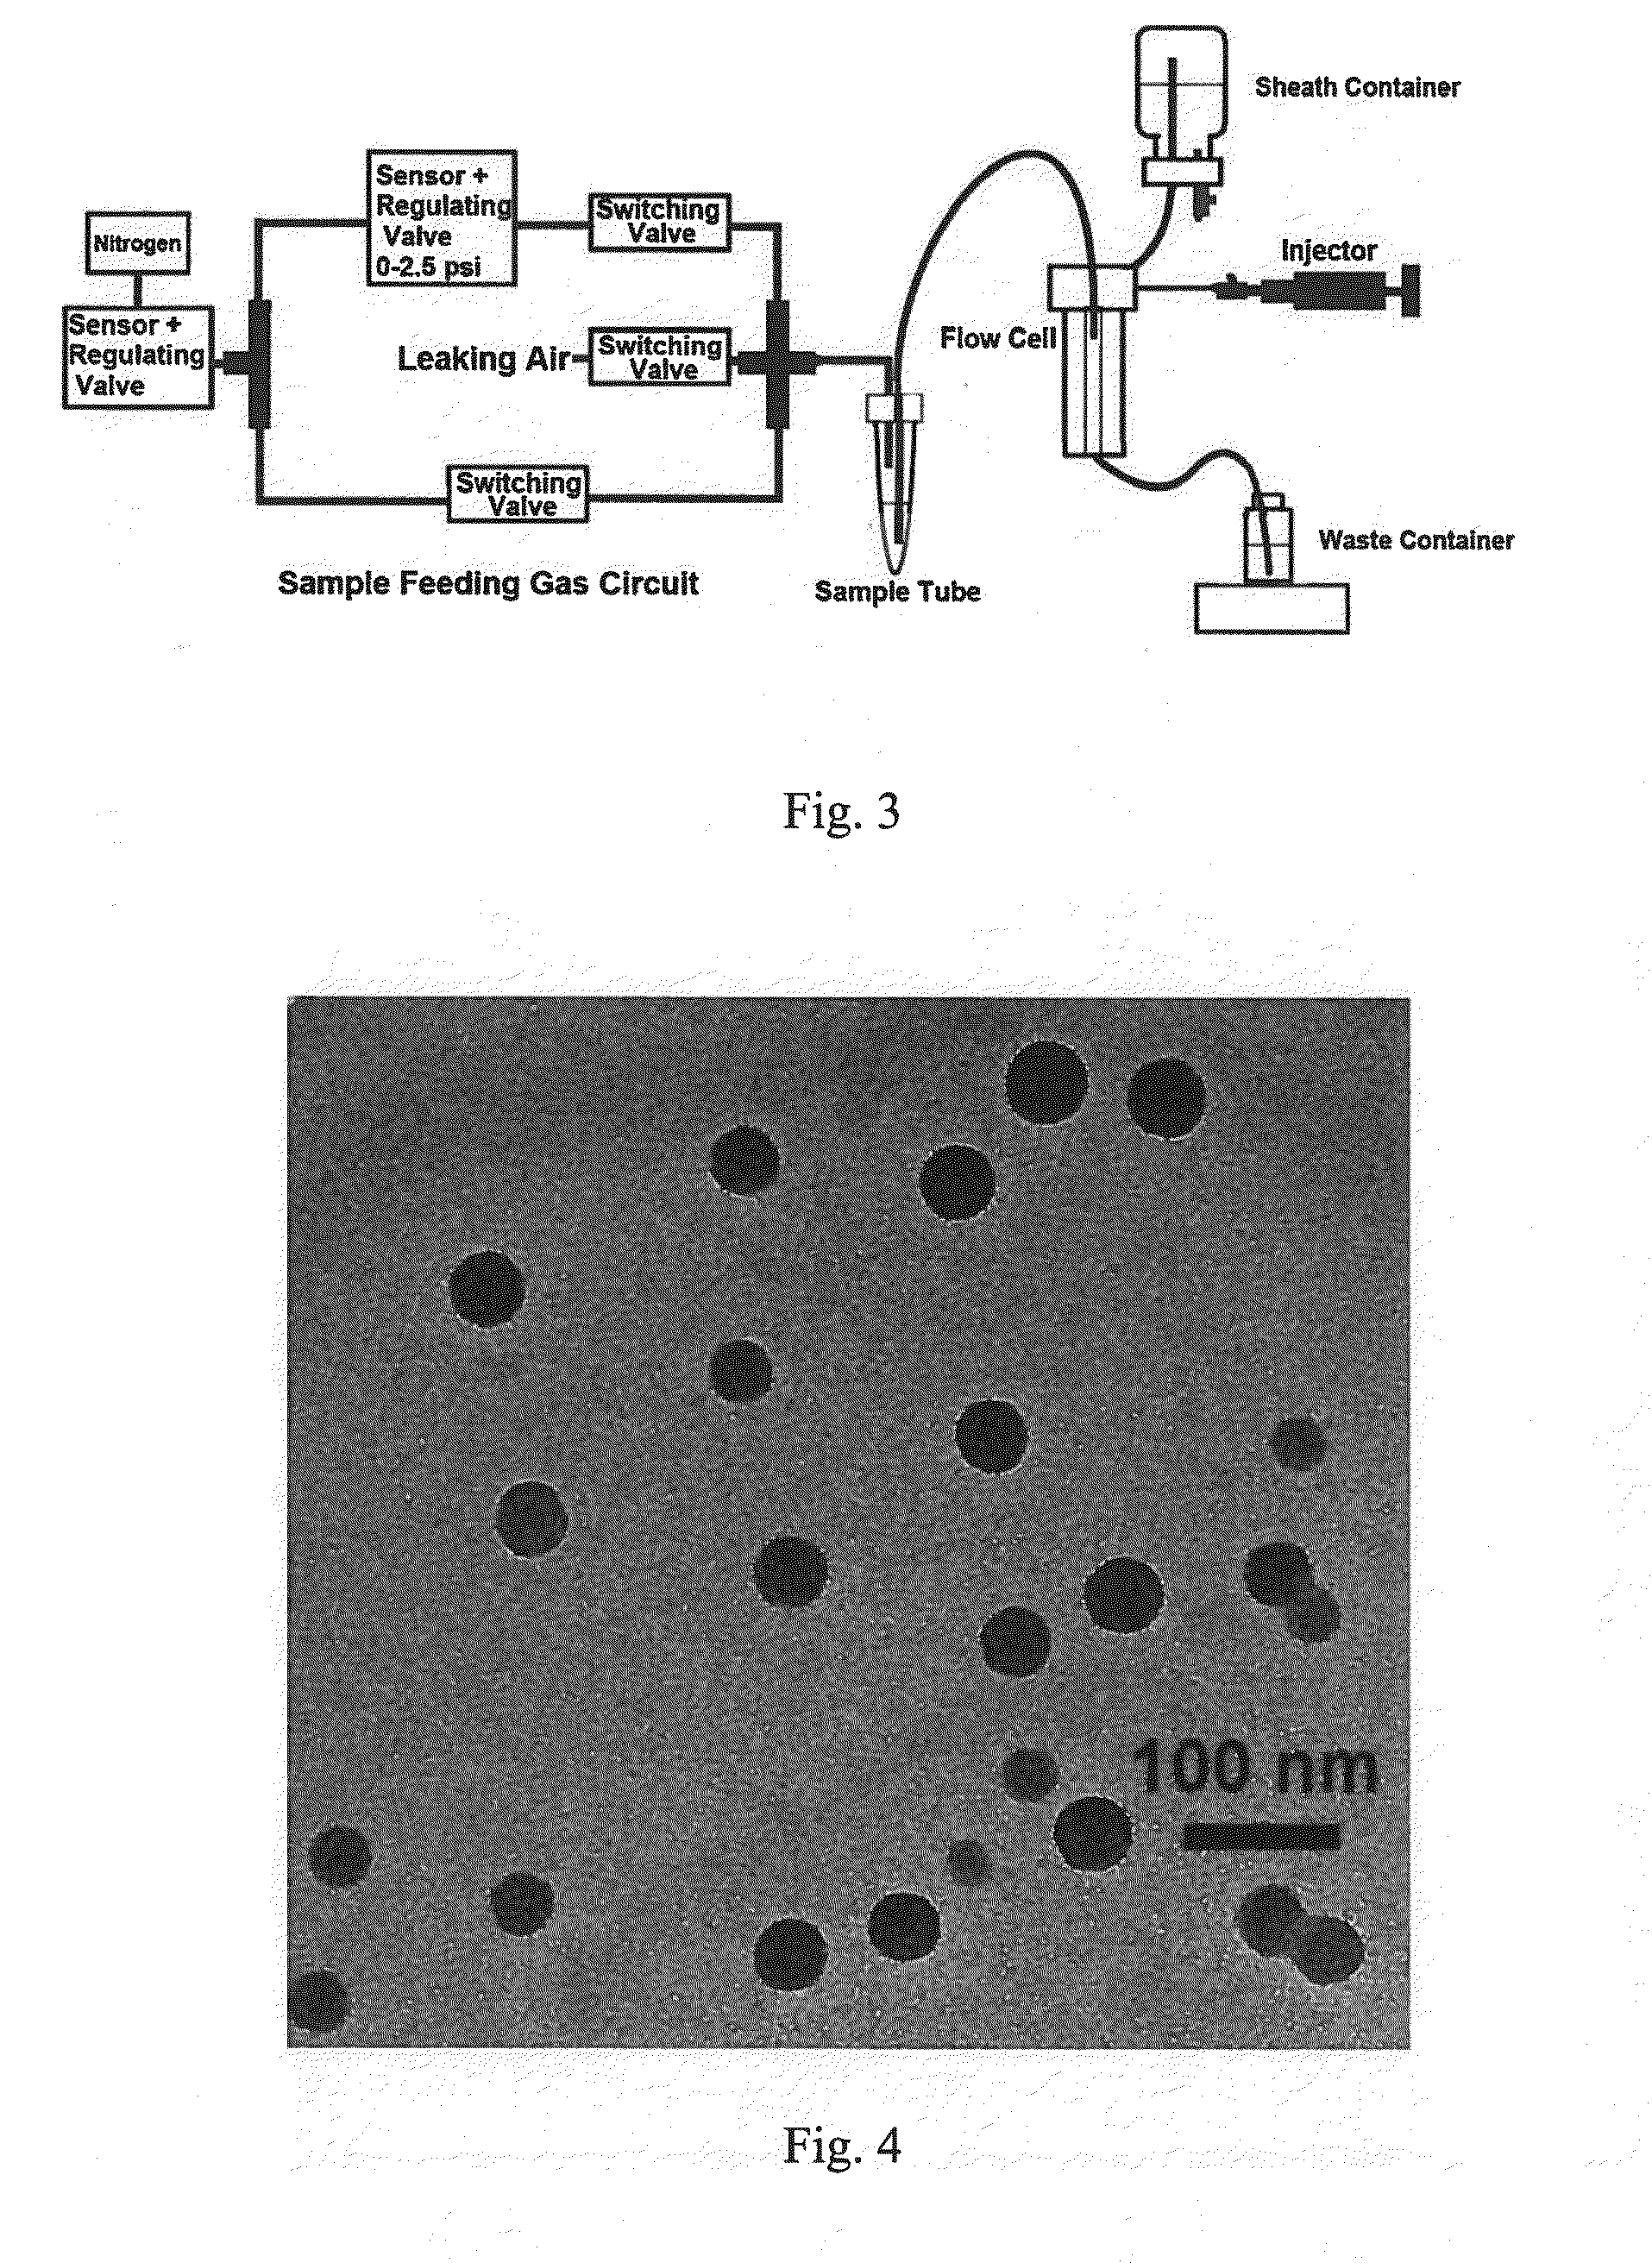
[0049]With reference to the light path system shown in FIG. 1 and the liquid flow system shown in FIG. 3, a sample liquid to be tested (suspension liquid of polystyrene nano-spheres with 44 nm particle size at a concentration of 2×10⁹ particles / mL) is pressed with nitrogen at 150 kPa pressure into an pressure-tight sample tube 2, and the pressure of the nitrogen is regulated so that the volumetric flow rate of the sample liquid is 2 nL / min. Wherein the sample tube is a quartz capillary tube with 40 μm inner diameter and 240 μm outer diameter, the terminal of the capillary tube is ground to an approx. 12° taper. The sample tube is inserted into a sheath fluid cavity from top to bottom in an axially parallel state, the sheath fluid cavity is a cuboid-shaped cavity formed by quartz glass, with 250 μm×250 μm cross section and 20 mm axial length, and the terminal of the sample tube is positioned at 8 mm above the top of the sheath fluid cavity in axial direction. A sheath fluid 13 flows ...

example 2

[0062]The measurement is made with the method described in the example 1, but the difference is: the sample liquid to be tested is a suspension liquid of silicon dioxide nano-spheres with 40 nm particle size at a concentration of 2×10⁹ particles / mL.

[0063]The relational diagram of the electrical signals obtained through conversion using an APD (serves as the photoelectric detector 7) vs. time is shown in FIG. 6B1, and the calculated S / N is 10. It can be seen from the result in FIG. 6B1: the scattered light from a single silicon dioxide nano-sphere with 40 nm particle size can be clearly distinguished from the background.

[0064]The frequency distribution histogram of the peak area of scattered light obtained through conversion using an APD (serves as the photoelectric detector 7) is shown in FIG. 6B2, and the calculated CV is 40%. Based on the Mie scattering theory, a CV of particle size distribution can be obtained, i.e.

CV=((1+40%)6-1)×100%=5.8%.

That value is essentially the same as t...

example 3

[0065]The measurement is made with the method described in the example 1, but the difference is: the sample liquid to be tested is a suspension liquid of gold nano-particles with 10 nm particle size at a concentration of 2×10⁹ particles / mL.

[0066]The relational diagram of the electrical signal obtained through conversion using an APD (serves as the photoelectric detector 7) vs. time is shown in FIG. 6C1, and the calculated S / N is 10. It can be seen from the result in FIG. 6C1: the scattered light from a single gold nano-particle with 10 nm particle size can be clearly distinguished from the background.

[0067]The frequency distribution histogram of the peak area of scattered light obtained through conversion using an APD (serves as the photoelectric detector 7) is shown in FIG. 6C2, and the calculated CV is 55%. Based on the Mie scattering theory, a CV of particle size distribution can be obtained, i.e.

CV=((1+55%)6-1)×100%=7.6%.

That value is essentially the same as the CV (7.1%) obtain...


PUM

PropertyMeasurementUnit
volumeaaaaaaaaaa
volumeaaaaaaaaaa
volumeaaaaaaaaaa

Abstract

Disclosed is a method for detecting nano-particles, comprising the steps of (1) compressing a sample liquid to be tested into a sample liquid flow by hydrodynamic focusing using a sheath fluid; (2) irradiating a measuring light to the sample liquid flow, wherein a single nano-particle in the sample liquid flow is irradiated by the measuring light for a duration of 0.1-10 milliseconds; (3) defining the area in which the measuring light irradiates the sample liquid flow as a detecting area, and collecting light signals emitted from the area irradiated by the measuring light by a lens imaging system, and allowing the light signals collected by the lens imaging system to pass a field stop, so as to filter out the light signals outside the detecting area and enrich the light signals from the detecting area; and (4) subjecting the light signals enriched by the field stop to optoelectronic signal conversion. The method can achieve detection for nano-particles with a low refractive index and a particle size of 24-1000 nm as well as nano-scale gold particles with a particle size of 6.7-150 nm.

Description

FIELD OF THE INVENTION[0001]The present invention relates to the instrumental analysis field, in particular to a method for detecting nano-particles.BACKGROUND OF THE INVENTION[0002]As nano-biotechnology was developed rapidly in recent years, artificially synthesized nano-particles with unique structures and functions have taken an increasingly important role in the biomedical field, including targeted drug delivery, high-resolution tumor imaging, and disease diagnosis, etc., and in other fields, such as protein purification, biochemical analysis, food safety, and environmental monitoring, etc. The measurement of size distribution of functional nano-particles is of great importance for quality control and actual application of nano-particles. In addition, there are various biological nano-particles in the natural world, such as bacteria, viruses, organelles, molecular assemblies, etc. Quick and high-resolution nano-particle detection techniques will provide powerful analytical means...

Claims


Application Information

Patent Timeline
Patent Type & Authority Applications(United States)
IPC IPC(8): G01N15/14G01N21/85
CPCG01N15/1434G01N2201/06113G01N21/85G01N2015/0038G01N21/53G01N2015/1447G01N15/1459G01N2015/1413
Inventor YAN, XIAOMEIZHU, SHAOBIN
Owner NANOFCM INC
Why Eureka
Try Eureka