Method of electron beam diffraction analysis

a technology of electron beam and electron beam, applied in the field of electron beam diffraction analysis, can solve the problems of limited accuracy, much greater accuracy, and computation effort not spent evaluating

Active Publication Date: 2015-12-24
OXFORD INSTR NANOTECH TOOLS
View PDF3 Cites 14 Cited by
  • Summary
  • Abstract
  • Description
  • Claims
  • Application Information

AI Technical Summary

Benefits of technology

[0017]Whereas the initial analysis of the pattern does not use any crystallographic information, may use a reduced resolution version of the original data to speed up computation and gives a result with limited accuracy, the refinement procedure uses additional crystallographic information about the candidate phase of the specimen to generate an accurate simulation for such a phase that can be compared with the original high resolution pattern, and produce a result with much greater accuracy. Furthermore, because the refinement procedure only uses selected bands in the image, computation effort is not spent evaluating pixels that do not contain relevant diffraction information. Thus, high accuracy is obtained with an efficient computational approach.
[0018]In other words, this invention provides an analysis method that uses a refinement algorithm informed by additional knowledge of physical properties of the assumed specimen phase under observation, and thus improves efficiency of calculation as well as accuracy of crystallographic measurements.
[0019]The benefits of the invention are significant. These include higher angular resolution of orientation measurements, increased robustness of phase identification, and direct measurements of plastic deformation. Each of these benefits is much sought after in the field of EBSD analysis.
[0023]The size of the image dataset may have a significant influence on the computational resources needed to perform the method. In the case of the initial image data set, we have found that the size of the image data set may be advantageously reduced whilst maintaining the quality of the process results as a whole. Thus, prior to step (a) the image data set used in the method may be produced by processing an initial image data set so as to reduce the size of the image data set in comparison with the initial image data set.
[0028]In many practical situations, the availability of computational resources (such as computational power) is limited. This in turn places limitations upon the overall speed of the process or may require preselection of candidate materials so as to reduce the number of calculations for example. Such limitations are generally undesirable. However, one great advantage of the inventive method is that, in step (d), it is possible to restrict the number of bands simulated to those most likely to improve the solution. This makes efficient use of the simulation since only a subset of detected bands are used. For example, the first Hough routine in (b) will try to find well-defined bands that give more than a threshold intensity in the Hough transform. With knowledge of the camera geometry, the interplanar angles between each pair of bands can be calculated giving a large set of interplanar angles. A database of candidate materials contains a list of interplanar angles for all planes likely to contribute to a pattern and the measured set is compared with the set for each material to find a set of indices for the bands that is consistent with the crystal structure for the material. It is likely that some of the measured bands will not fit, but the bands that contribute to likely interplanar angles can now be identified with particular crystal planes and these bands can thus be “indexed”. The refinement method is only applied to those bands that have been successfully indexed and this is typically 6 to 12 bands. The number of bands simulated may be made equal to the number of bands for which estimated diffraction parameters are generated in step (b) and where the band has been successfully indexed by matching of interplanar angles with those for a candidate phase. In order to increase the accuracy of the method, the effect of the adjustment in step (e) may be calculated at a number of separated locations along the bands.
[0030]As an additional step which may assist with a user of a system implementing the method an image of the bands of the image data set may be overlaid with the simulated bands so as to provide a visual representation of the correlation.

Problems solved by technology

Whereas the initial analysis of the pattern does not use any crystallographic information, may use a reduced resolution version of the original data to speed up computation and gives a result with limited accuracy, the refinement procedure uses additional crystallographic information about the candidate phase of the specimen to generate an accurate simulation for such a phase that can be compared with the original high resolution pattern, and produce a result with much greater accuracy.
Furthermore, because the refinement procedure only uses selected bands in the image, computation effort is not spent evaluating pixels that do not contain relevant diffraction information.

Method used


Image

  • Method of electron beam diffraction analysis
  • Method of electron beam diffraction analysis
  • Method of electron beam diffraction analysis

Examples


Embodiment Construction

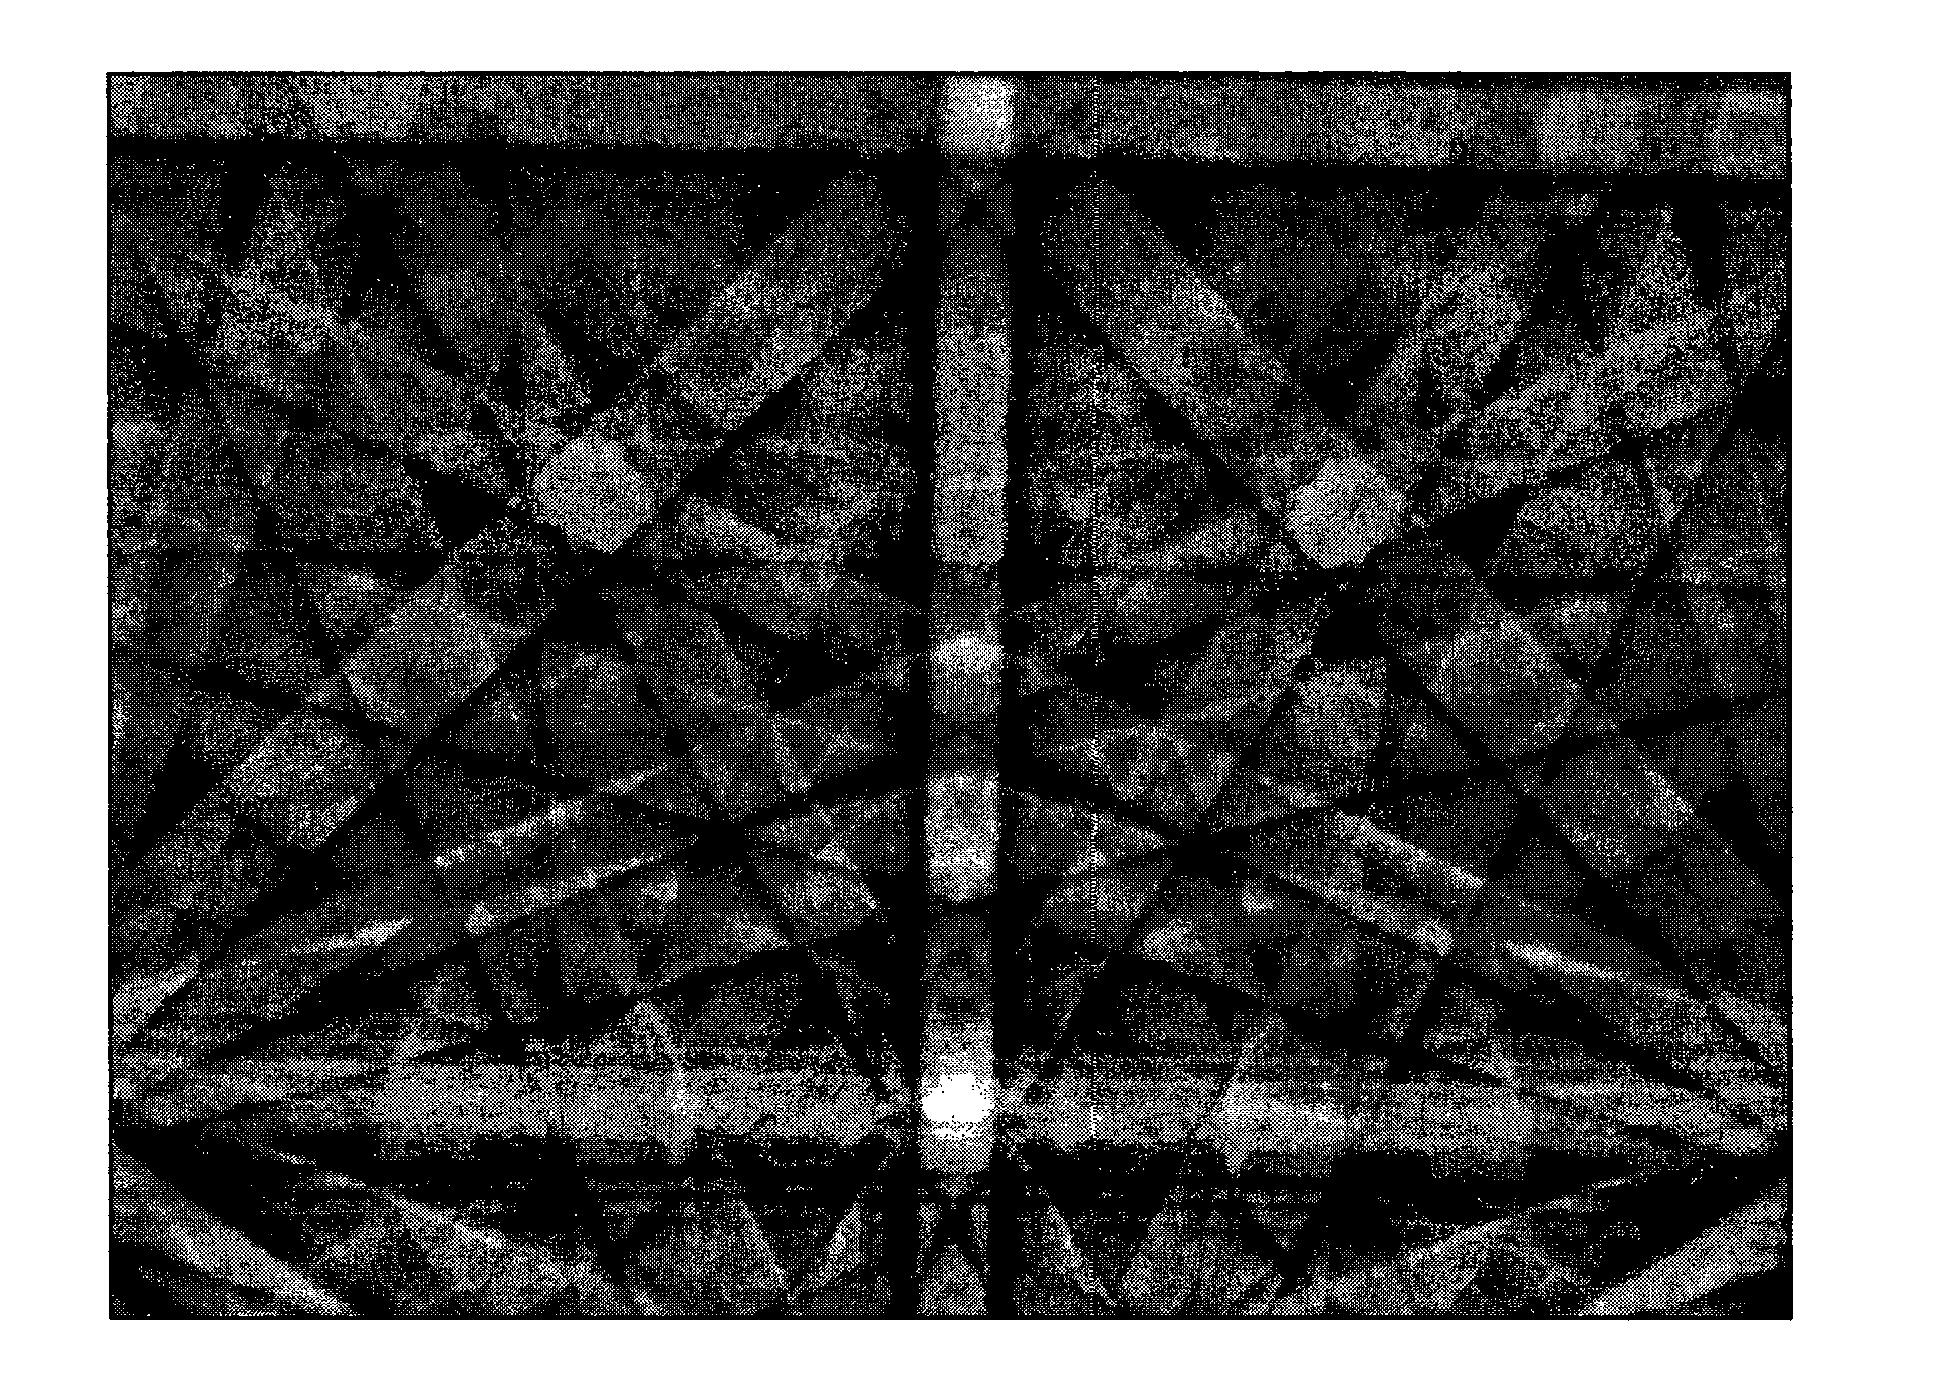
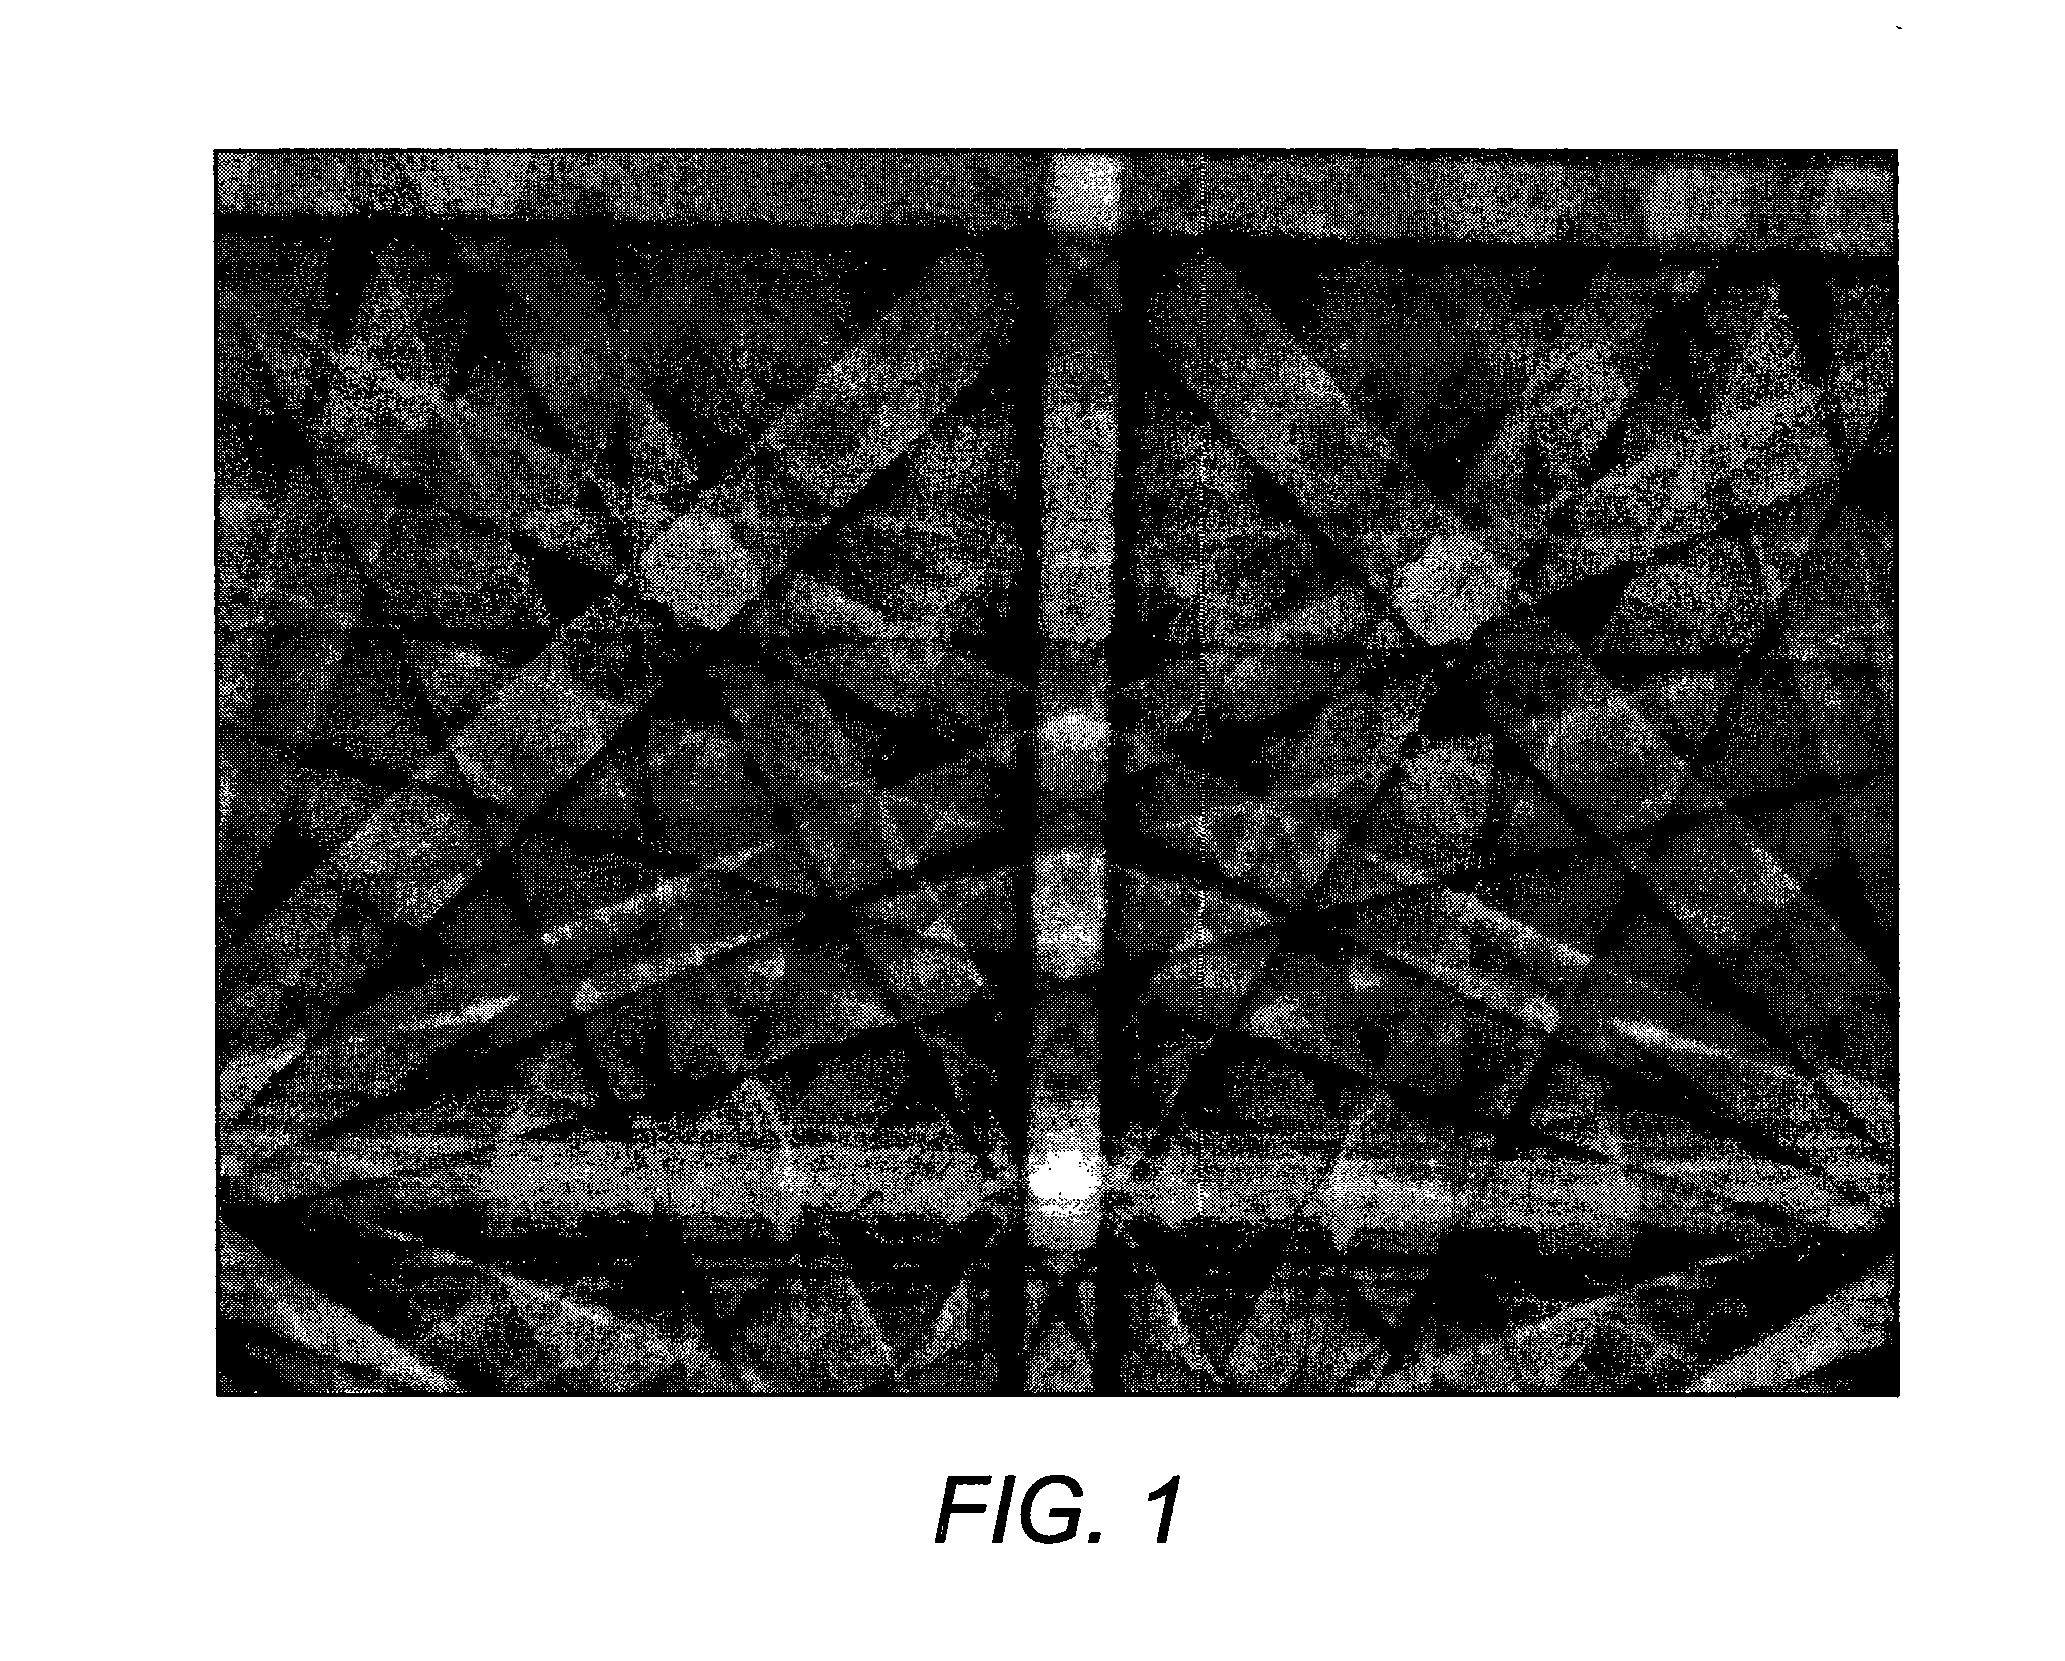
[0043]The example we now describe is a particular implementation to increase precision in orientation mapping and phase identification, and does not preclude other embodiments that may be used to calculate plastic deformation in the crystal, or to map out sub-grain structures for example.

[0044]The method may be performed using largely conventional EBSD analysis apparatus, this of course including a chamber for containing a sample to be analysed, an electron beam source and a detector for obtaining EBSD data. The apparatus should also contain or be in communication with a computer system for performing the analysis of the data. Such a computer system may contain a database of materials data allowing simulations of EBSD data to be made and specific known materials to be identified. As will be understood such a computer system may include distributed devices such as a remote database of materials accessible over a network such as the Internet.

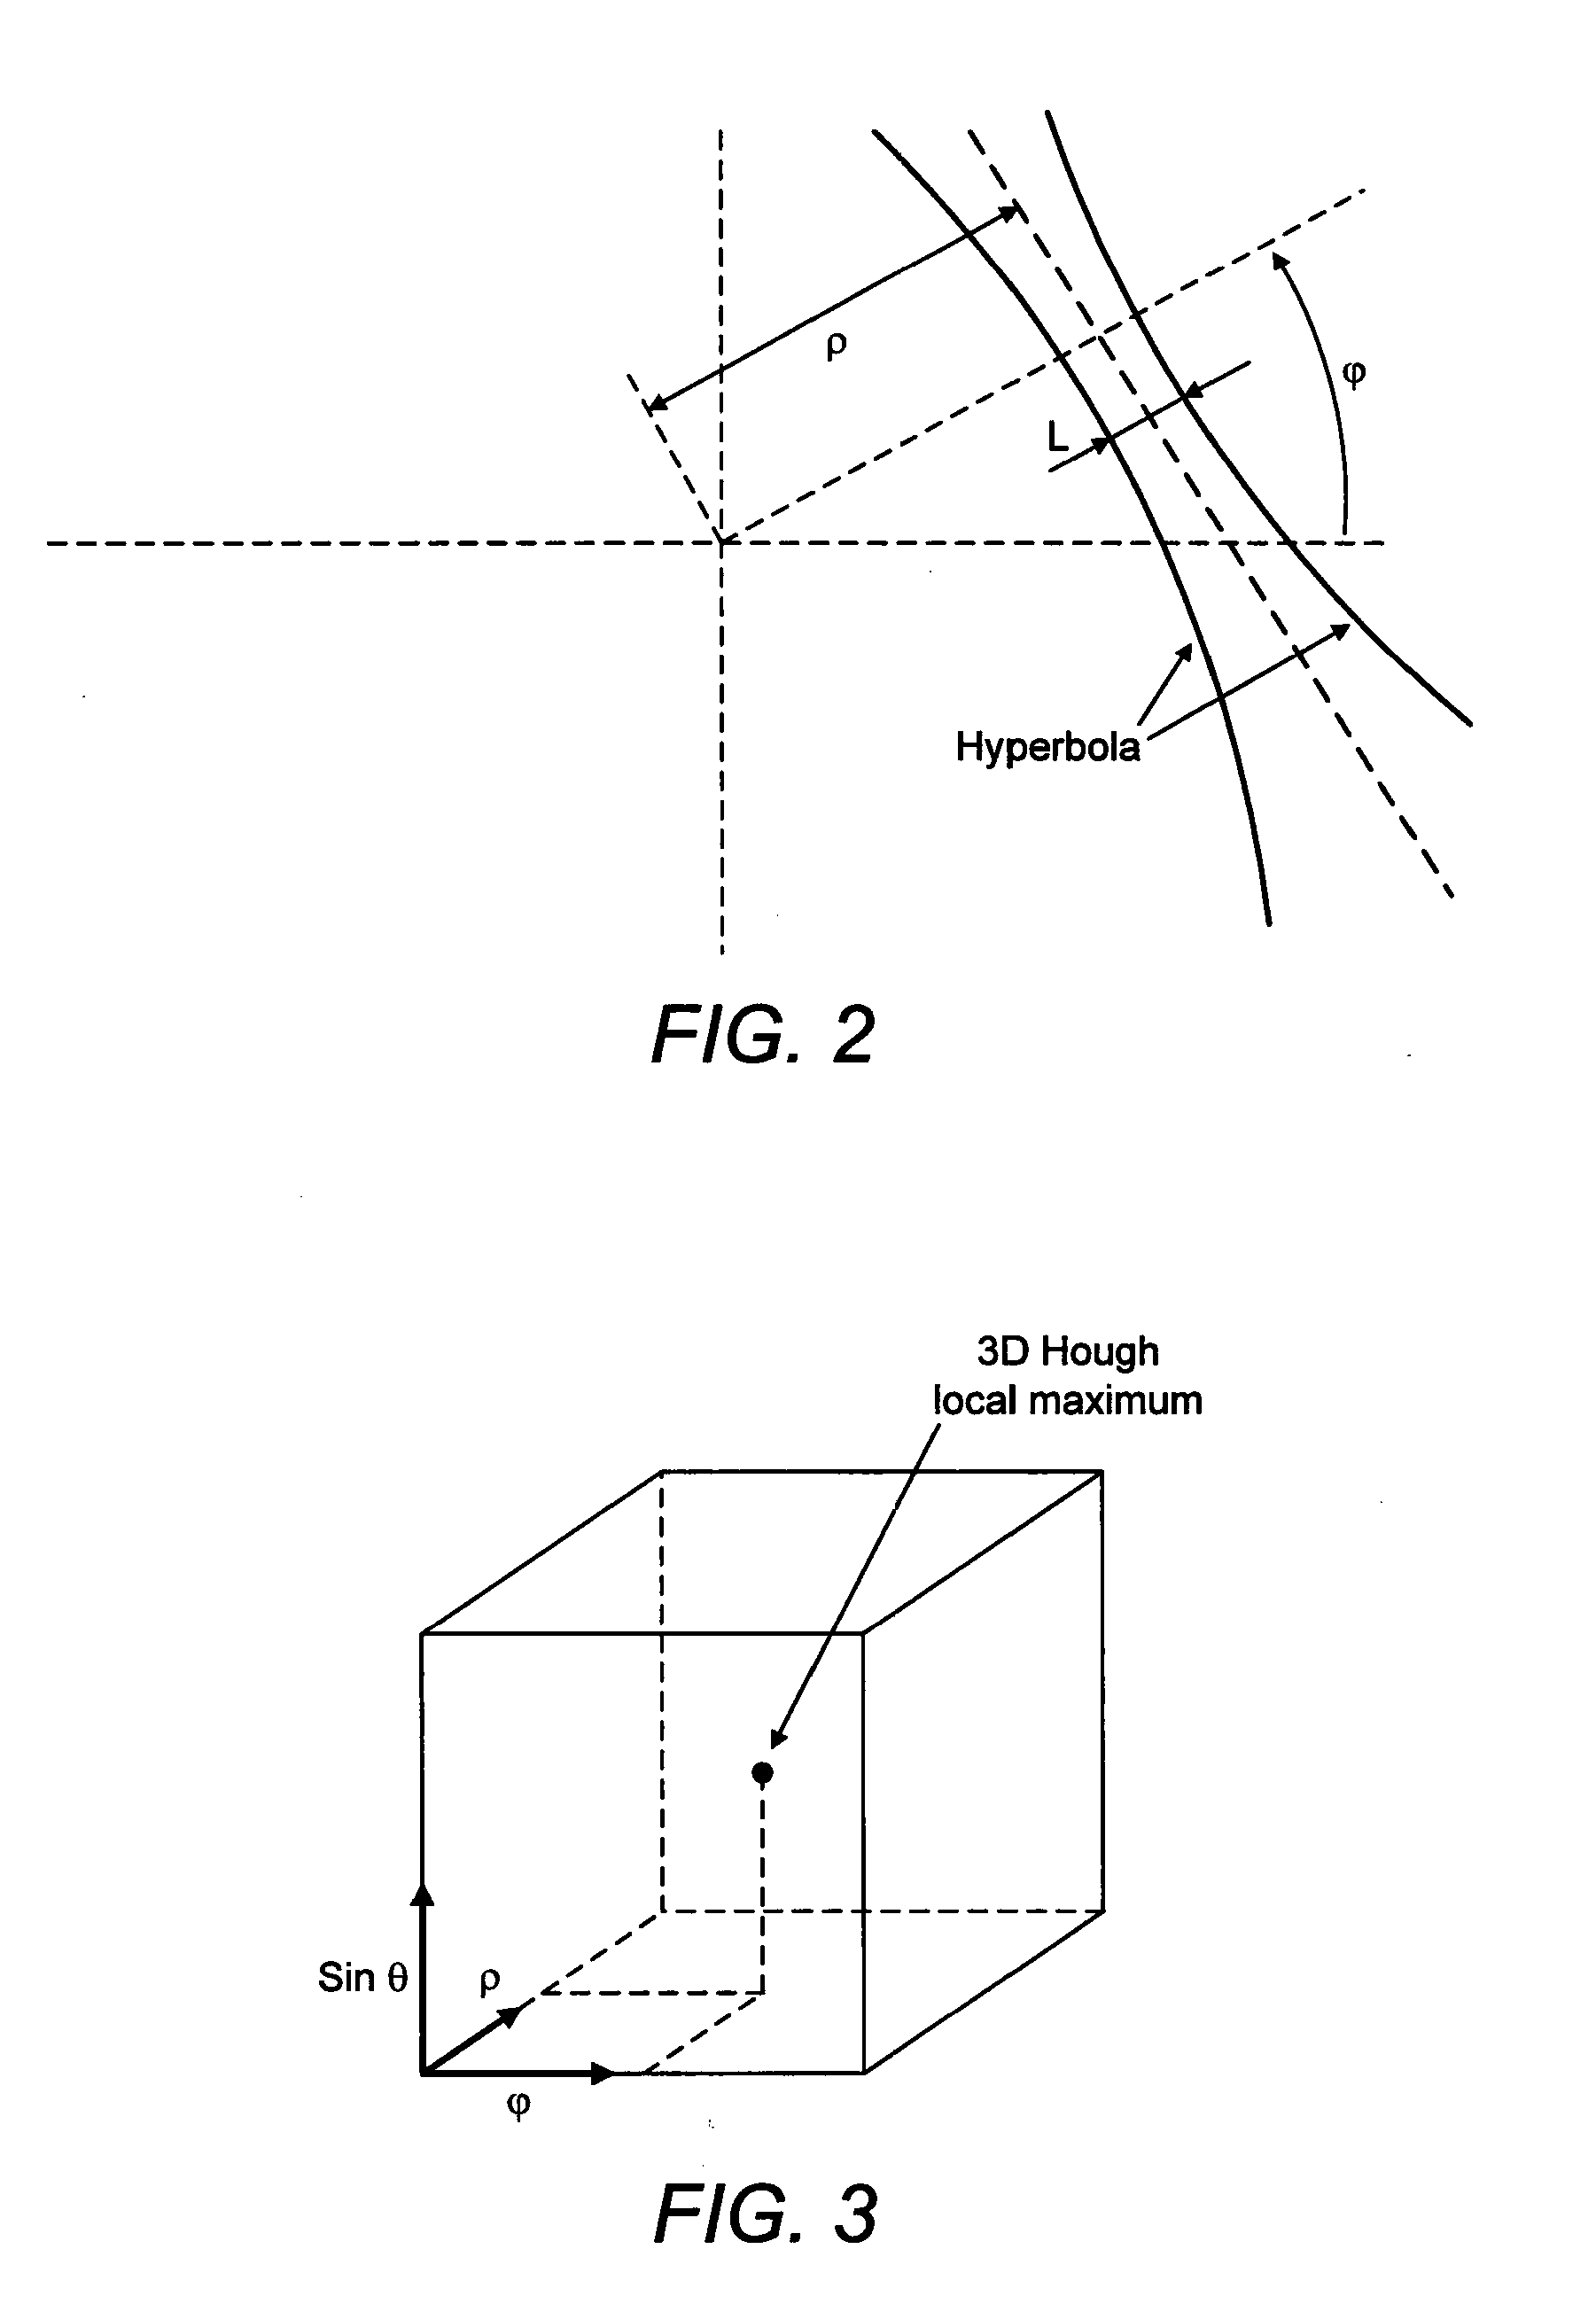
[0045]We now refer to FIG. 4 which is a flo...


PUM

PropertyMeasurementUnit
Bragg anglesaaaaaaaaaa
sizeaaaaaaaaaa
crystallographic propertiesaaaaaaaaaa

Abstract

A method is provided for analysing electron backscatter diffraction data generated from a sample material. An image data set representative of an image of electron backscatter diffraction bands is obtained from the sample material. A set of estimated first diffraction parameters is then generated, these defining individual electron backscatter diffraction bands in the image data set. A candidate phase is then selected together with a respective orientation for the material, based upon the generated set of estimated parameters thereby identifying diffraction bands in the image data set. Second diffraction parameters of the identified diffraction bands are simulated for the candidate phase according to the respective orientation. These second diffraction parameters are then adjusted for the identified simulated bands so as to fit the simulated bands to the bands in the image data. A fitted orientation for the candidate phase is then calculated together with a corresponding fitting parameter defining the quality of fit.

Description

FIELD OF THE INVENTION[0001]A method is provided for electron beam diffraction analysis in which electron backscatter diffraction (EBSD) data generated from a sample material is analysed.BACKGROUND TO THE INVENTION[0002]Electron backscatter diffraction analysis is a well established technique of materials analysis. It is a crystallographic method used to identify materials, phases, grain orientation and texture on the micro-scale, as well as to map strain and characterise defects, and relies on analysis of electron “Kikuchi” patterns obtained using a focused electron beam in a scanning electron microscope, either in a backscattered or a transmission geometry. A typical Kikuchi pattern is shown in FIG. 1.[0003]Various numerical methods have been devised to obtain such information from Kikuchi diffraction patterns of crystals, these all requiring a compromise between computational load and accuracy of measurement. Commonly, analysis methods for Kikuchi patterns rely on the “2D Hough t...

Claims


Application Information

Patent Timeline
Patent Type & Authority Applications(United States)
IPC IPC(8): G01N23/203H01J37/26
CPCH01J37/261G01N23/203
Inventor PENMAN, CHARLESSCHMIDT, NIELS-HENRIKTHOMSEN, KNUD
Owner OXFORD INSTR NANOTECH TOOLS
Why Eureka
Try Eureka