Lipoprotein particle number from measurements of lipoprotein particle phospholipid concentration in lipoprotein particle membrane bilayer
- Summary
- Abstract
- Description
- Claims
- Application Information
AI Technical Summary
Benefits of technology
Problems solved by technology
Method used
Image
Examples
example 1
Optical Apparatus for Use in CE-ITP-LIF Systems
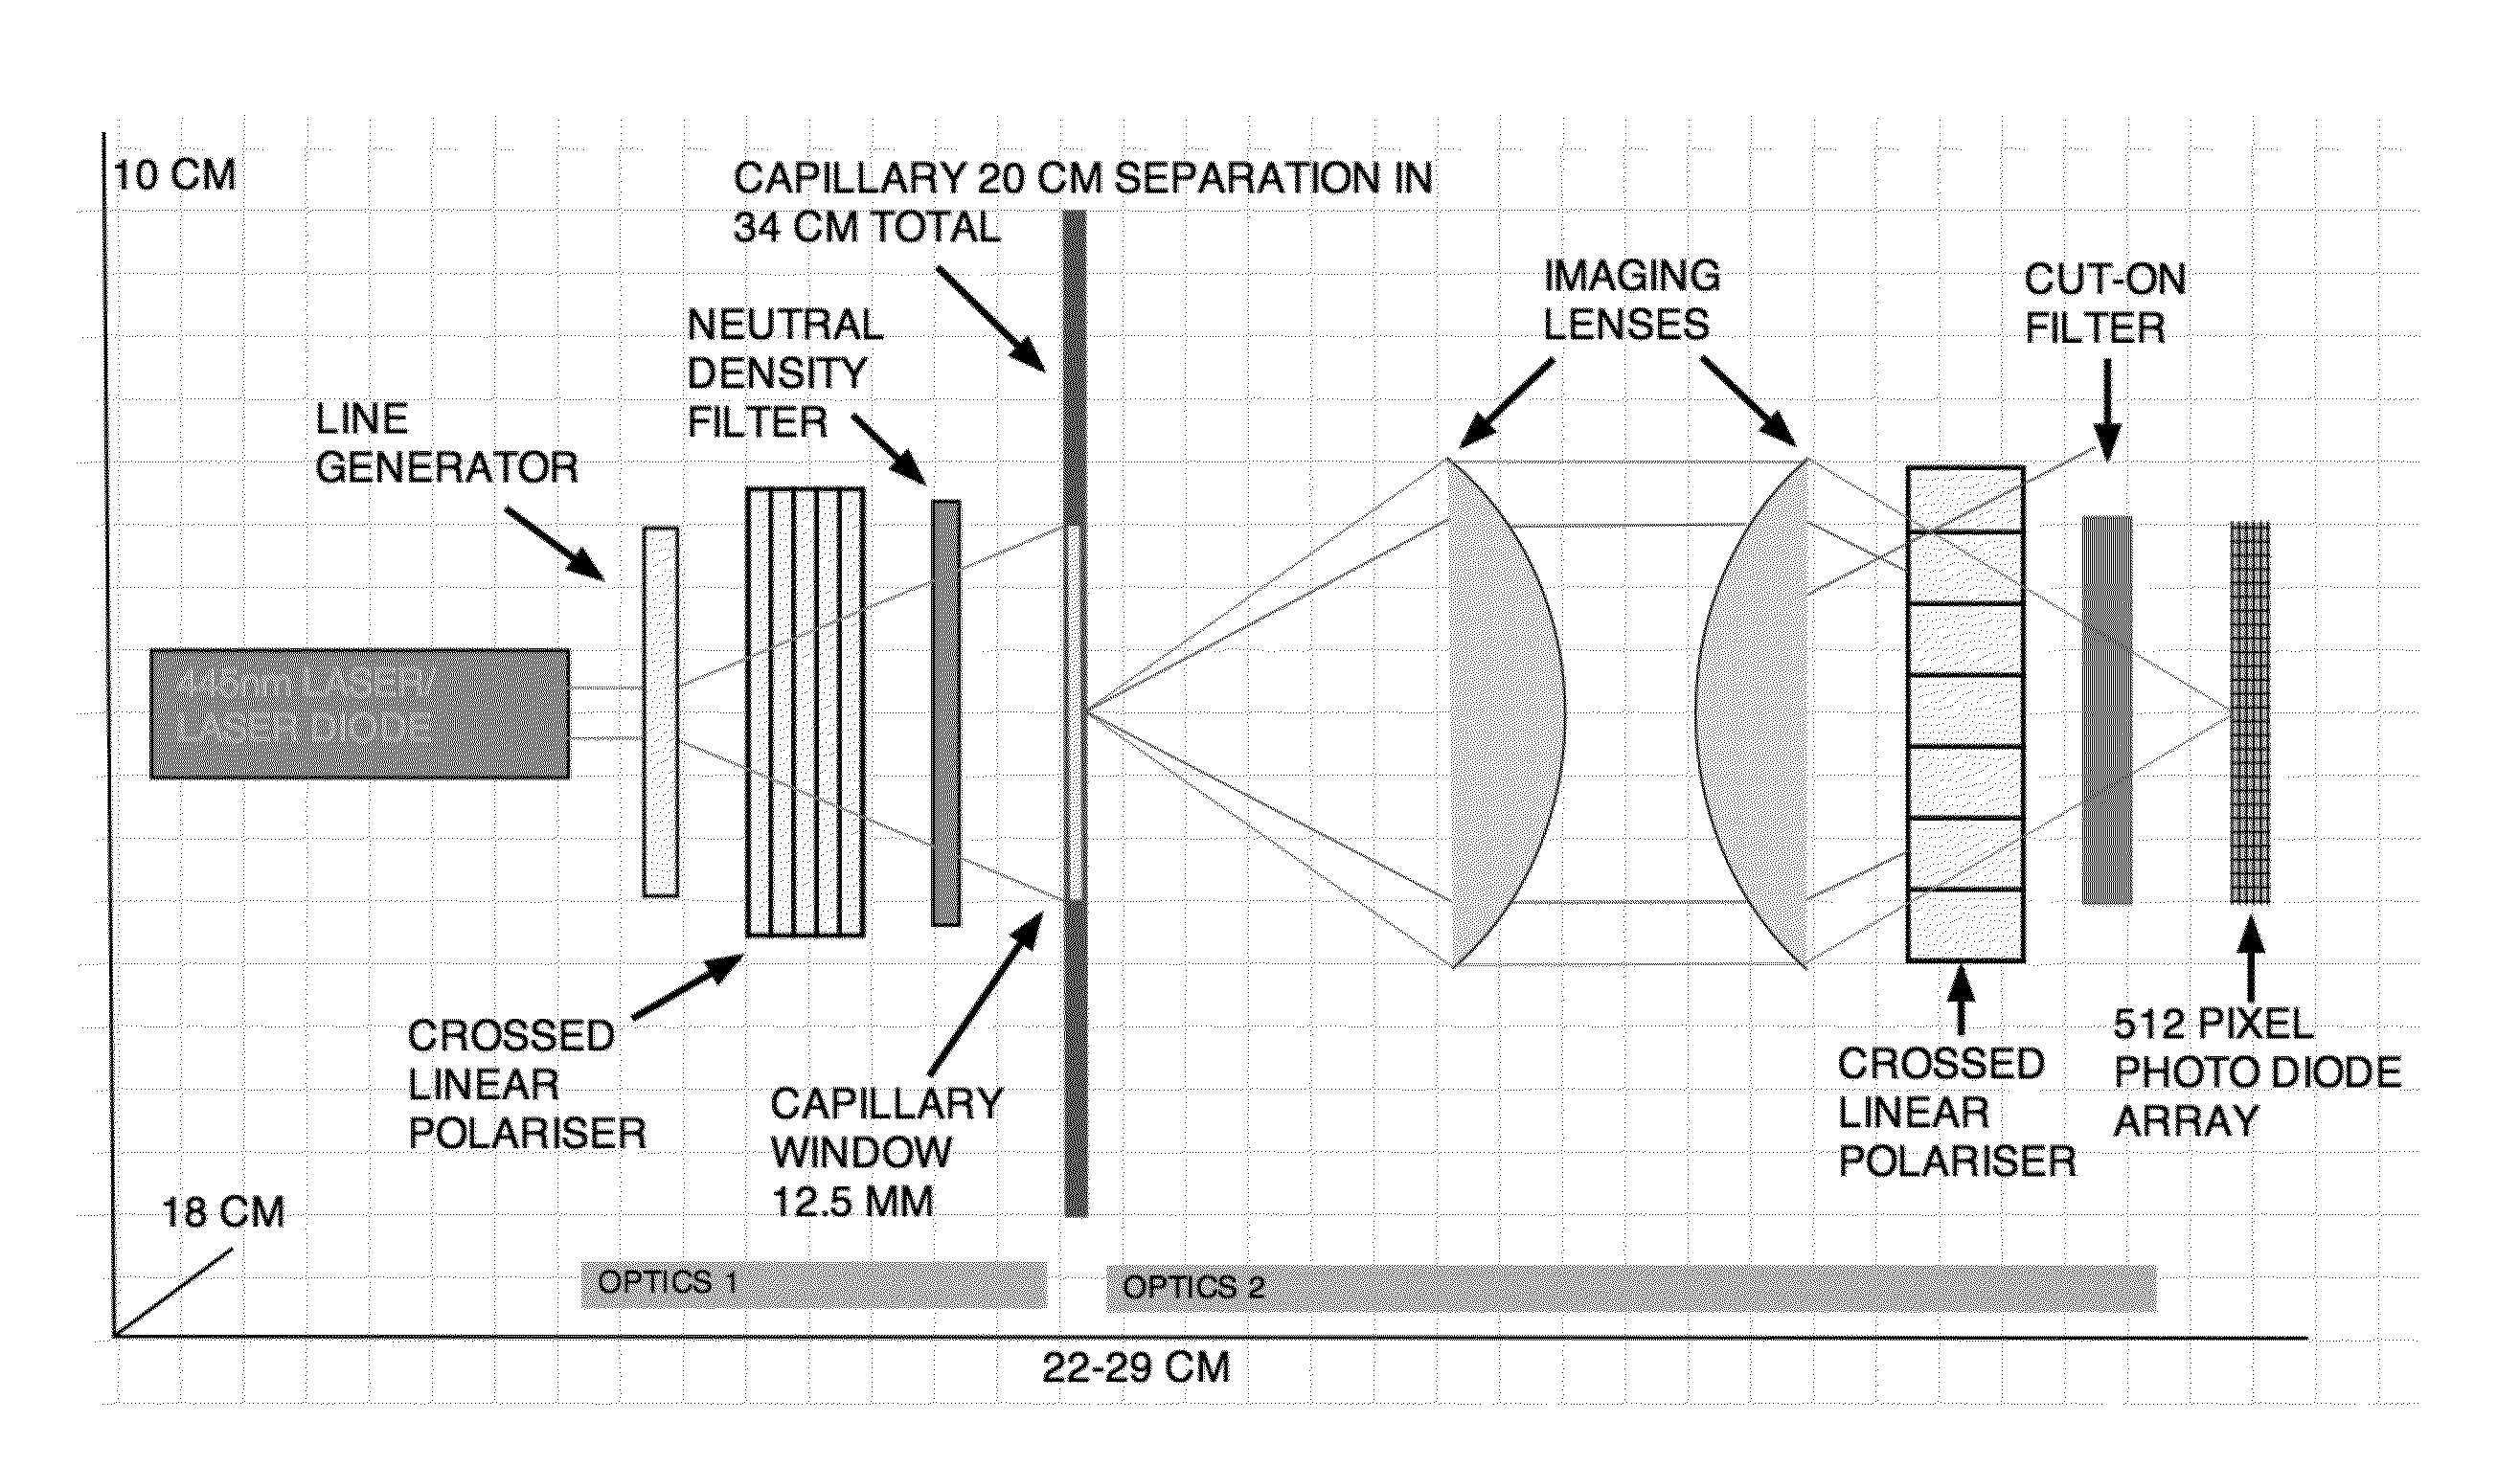
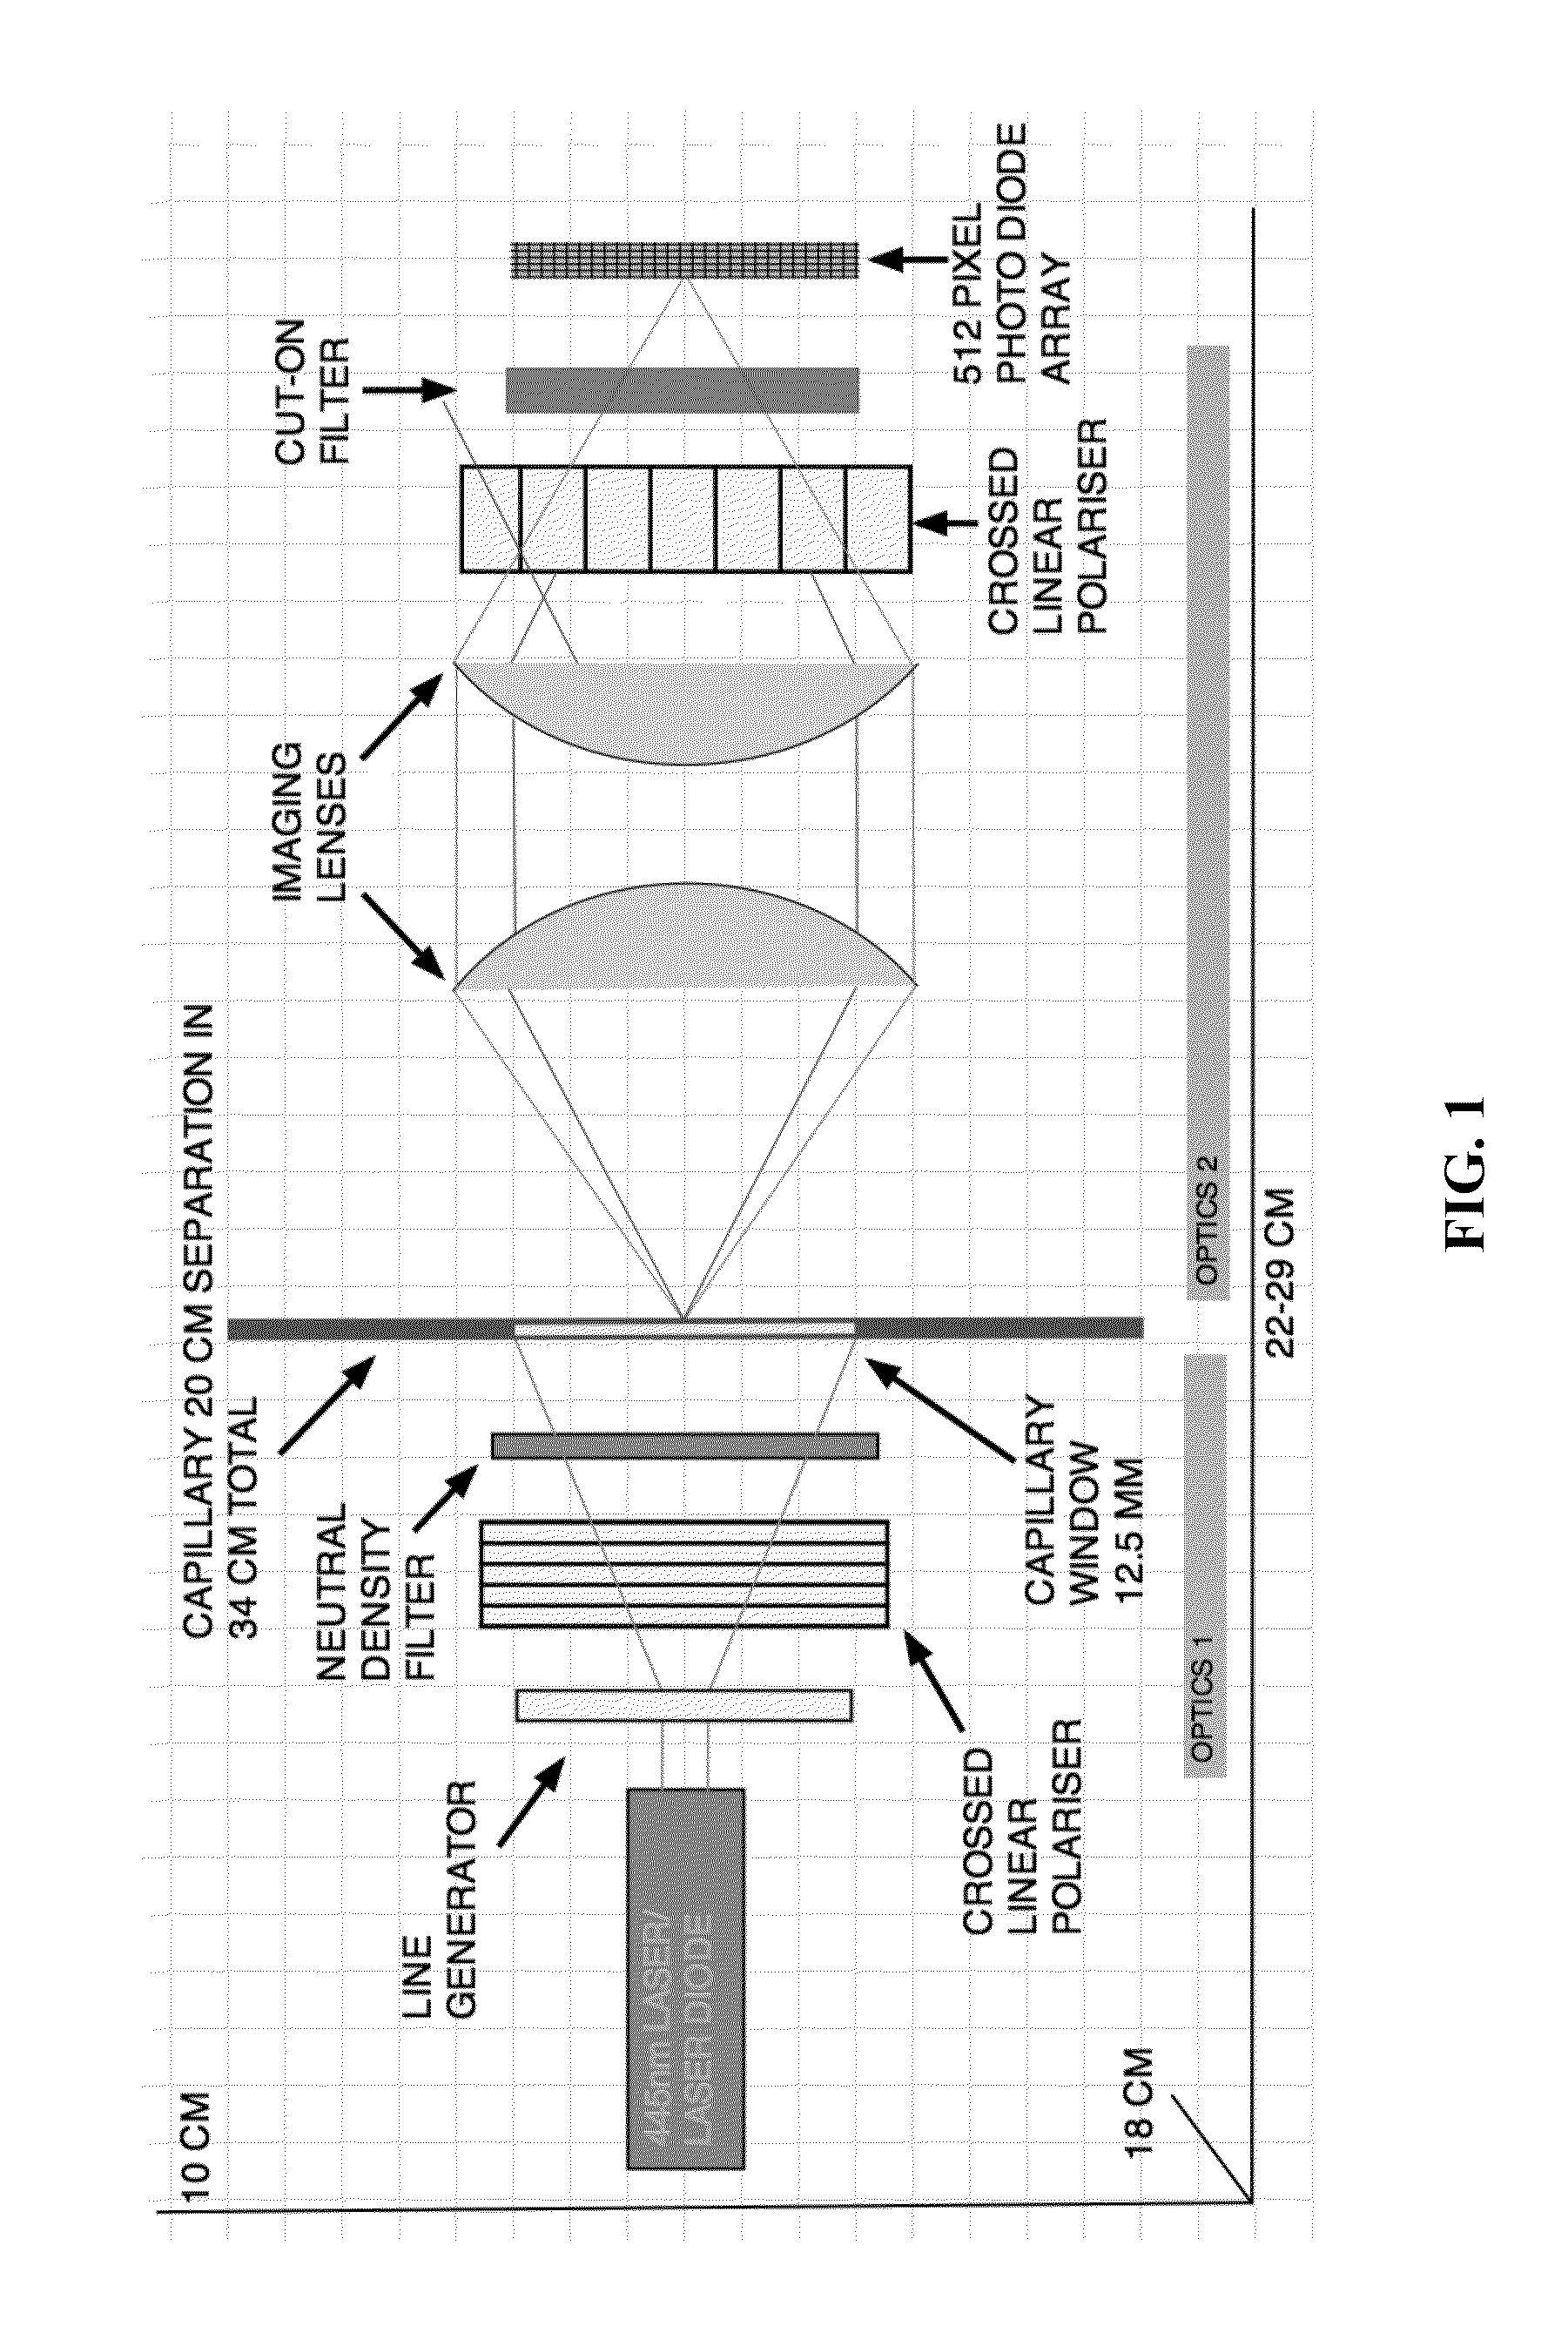
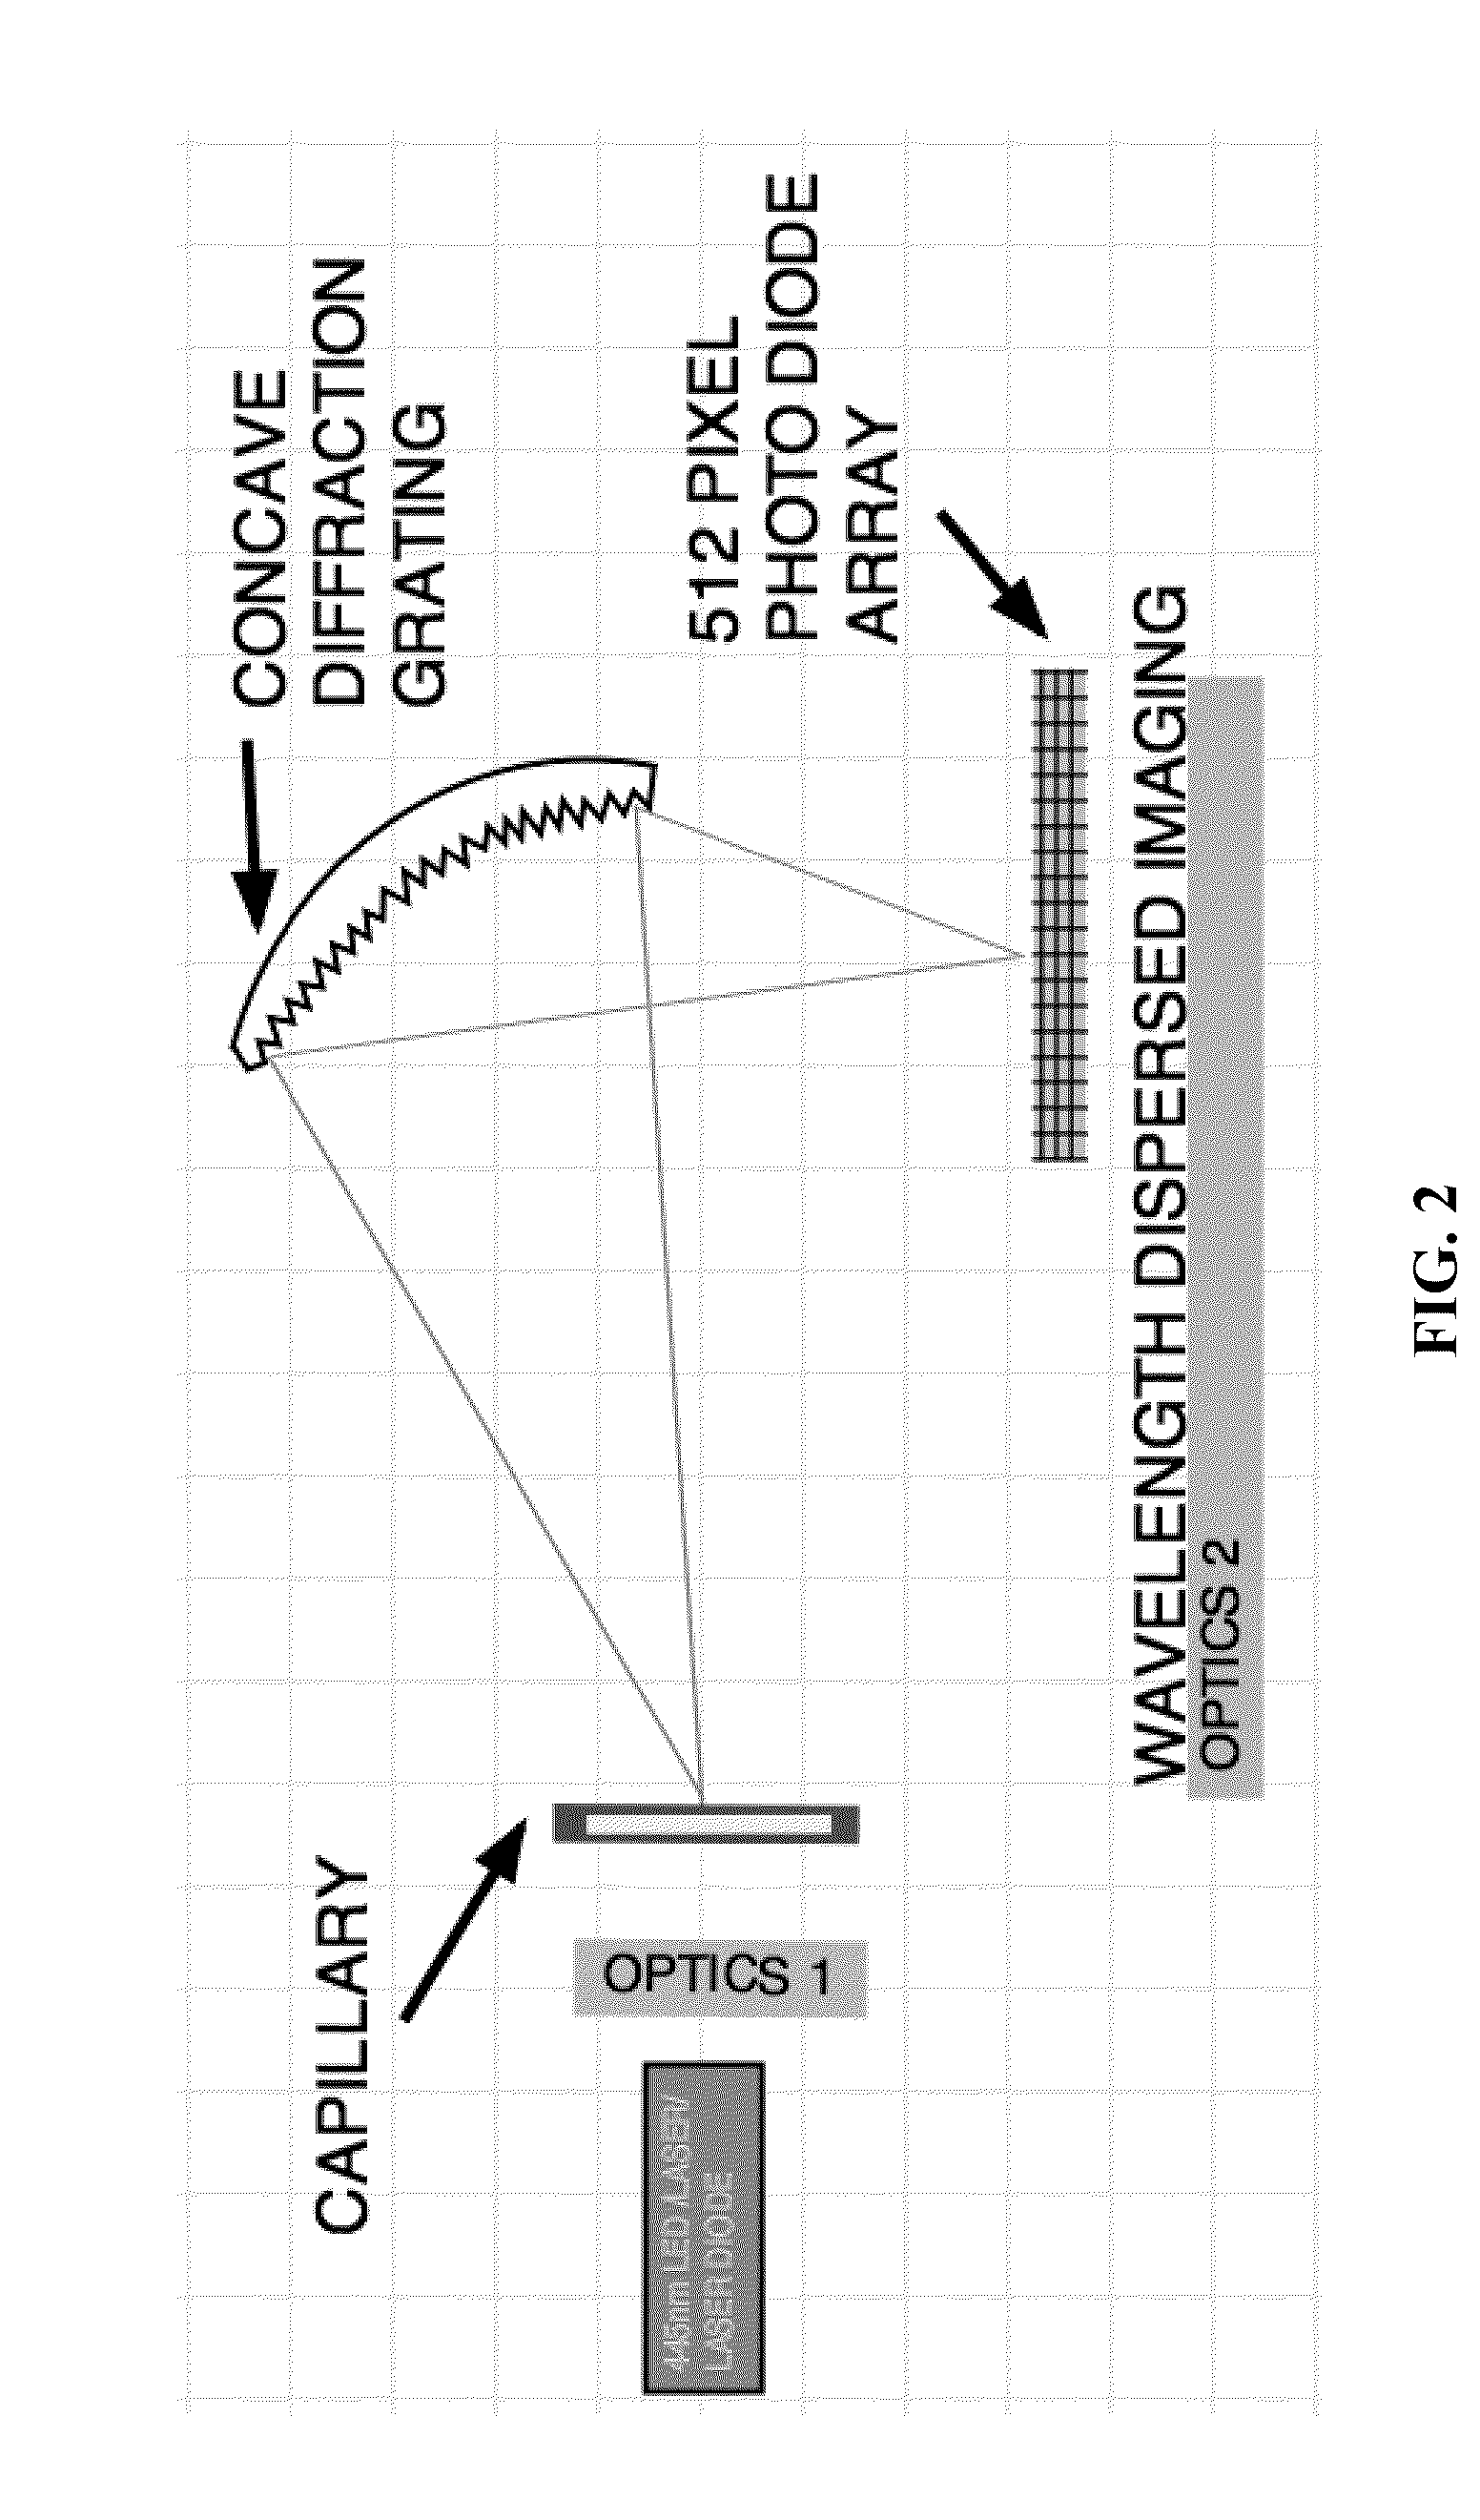
[0119]A schematic of an optical apparatus comprising two optical zones for use in a CE-ITP-LIF system is shown in FIG. 1. Optics zone 1 comprises an optical rail on which are arranged a 445 nm or other specific wavelength laser or laser diode. Light from these sources is focused through a series of optical components comprising, but not limited to, a line generator, a crossed linear polarizer, and a neutral density filter. Light from optics zone 1 is focused onto a 12.5 mm area of a 100 μM internal diameter fused silica capillary (˜365 μM o.d.) in which a 20 mm viewing window has been created by thermal removal of the polyamide sheath. The light then passes through the sample that is being separated by ITP and excites the fluorescent label attached to each analyte molecule (e.g., a lipoprotein and / or lipid particle). Emitted light energy, at a wavelength specific to the fluorescent label is then focused onto a 512 pixel photo diode arra...
example 2
Replicate Lipoprotein Profiles of a Single Biological Sample
[0135]To test the reproducibility of the CE-ITP-LIF system, several replicate biological samples from a single patient were evaluated. As a control experiment, the non-specific lipophilic dye CF was run on the ITP system in the absence of a biological sample. FIG. 6A shows an electropherogram of the control experiment with a peak corresponding to CF (migration time=0.7999), area under peak=2.345). Next, lipoprotein particles in replicate biological samples from patient 8 were labeled with CF and run with a standard CF sample. FIG. 6B is an electropherogram showing the lipoprotein profile of each replicate sample tested. The lipid profile remains constant even after CF has degraded (FIG. 6C).
example 3
Lipoprotein Particle Spiking Results in a Marked Increase in the Corresponding Detected Lipoprotein Peak Height
[0136]The lipoprotein profile of a biological sample stained with NBD-ceramide generates several peaks corresponding to individual serum lipoproteins (FIGS. 6A-6B). To validate the identity of each individual lipoprotein peak, biological samples were spiked with known amounts of purified lipoprotein. To validate peaks corresponding to HDL and LDL, native samples from patient 8 were spiked with purified HDL and LDL, respectively. The lipid profile of the HDL spiked sample (FIG. 7A, top) and the LDL spiked sample (FIG. 7B, top) were aligned with the lipid profile generated by the native sample (FIG. 7A, bottom; FIG. 7, bottom). As shown in FIG. 7A, there was a marked increase in the peak height and area under the peak in the HDL spiked sample compared to the native sample. FIG. 7B shows the same relationship between the LDL spiked sample compared to the native sample. FIG. 7C...
PUM
 Abstract
Description
Claims
Application Information
 - R&D
- Intellectual Property
- Life Sciences
- Materials
- Tech Scout
- Unparalleled Data Quality
- Higher Quality Content
- 60% Fewer Hallucinations
Browse by: Latest US Patents, China's latest patents, Technical Efficacy Thesaurus, Application Domain, Technology Topic, Popular Technical Reports.
© 2025 PatSnap. All rights reserved.Legal|Privacy policy|Modern Slavery Act Transparency Statement|Sitemap|About US| Contact US: help@patsnap.com


