Biomarker method

a biomarker and method technology, applied in the field of biomarker methods, can solve the problems of difficult for even expert clinicians and/or researchers to interpret images including a plurality of biomarkers, and the difficulty of image quantification,

Active Publication Date: 2016-08-18
UNIV OF MANCHESTER
View PDF31 Cites 4 Cited by
  • Summary
  • Abstract
  • Description
  • Claims
  • Application Information

AI Technical Summary

Problems solved by technology

It is therefore a subjective technique, completely reliant on the human eye, and as an image is easily affected by factors such as strong background staining, weak target antigen staining and auto fluorescence, decisions vary between researchers and clinicians and except in advanced research centres quantification of an imaged tissue sample is typically limited to counting cells.
Additionally even with sophisticated analysis and visualisation tools, it is difficult for even expert clinicians and / or researchers to interpret images including a plurality of biomarkers.
For example, analysis becomes particularly complex once the number of biomarkers exceeds 3 or 4, since as the number of markers increases, the ability of the human eye to distinguish between the different markers decreases.
Unfortunately, however, TMA has several limitations.
Firstly the results are averaged over the whole sample meaning that if only a subsection of cells concentrated in one section of the sample drives the disease, this can be missed; and secondly, the sample is small so in a heterogeneous cell population (such as in a tumour), important information may be missed.
Currently available methodology does not, however, allow spatial patterning to be analysed with more than a handful of biomarkers.
IHC techniques, for example, provide one image for each stain but whilst it is believed that cells with particular IHC profiles may interact, there are few quantitative methods available for investigating these hypotheses.

Method used


Image

  • Biomarker method
  • Biomarker method
  • Biomarker method

Examples


example 1

Study of Follicular Lymphoma

[0249]This example applied the method of the present application to the study of follicular lymphoma. In particular, the method was applied to data from multispectral microscopy of multiply-stained tissue sections from a sample of follicular lymphoma (FL) subjects, and used to identify subject groups that differ in survival.

Subjects and Samples

[0250]Twenty six archived human lymph nodes from subjects (16 male, 10 female, aged 36-77 years, mean 55 years) with a diagnosis of FL were collected at initial diagnosis, prior to the treatment. Written informed consent and local research ethics committee approval were obtained. The material was routinely processed by fixation in formalin and paraffin embedding. Clinical data and up to 14 years of follow-up and survival data were available for each sample (19 dead, 7 alive; median time to death 32 months; range 2-170 months; 171 months follow-up in all subjects alive at the end of the study period). Paraffin-embedd...

example 2

Alternative Study of Follicular Lymphoma

[0261]A tissue microarray comprising 40 FL samples was used in triplex immunohistochemistry for FOXP3, CD3 and CD69. Multispectral imaging was used to determine the spatial locations of FOXP3 and CD69 positive T-cells which were used in HID analysis according to the method of the present application to assess prognostic significance of cellular patterns quantified by Shannon entropy.

[0262]The method used for Example 2 corresponds to that of Example 1, except a larger number of subjects were used with different biomarkers.

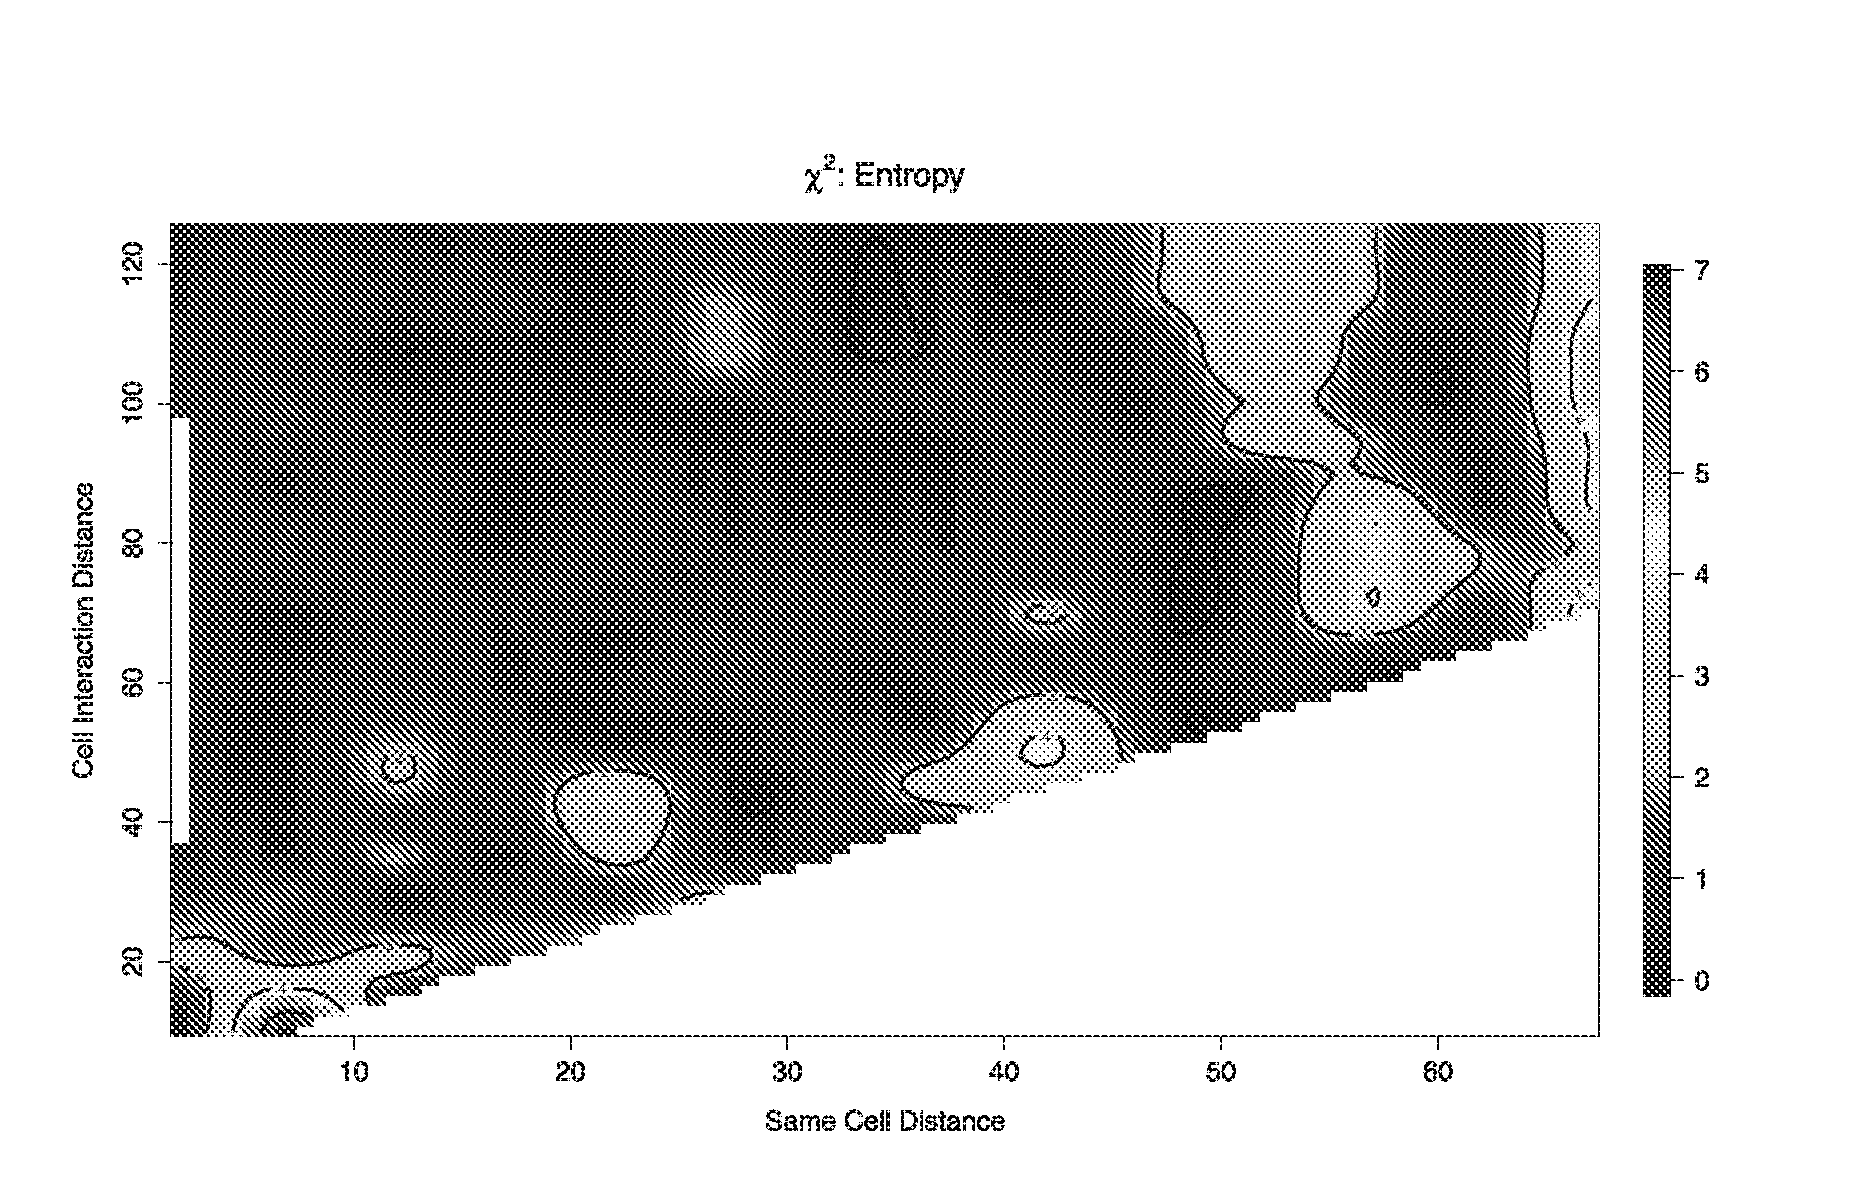
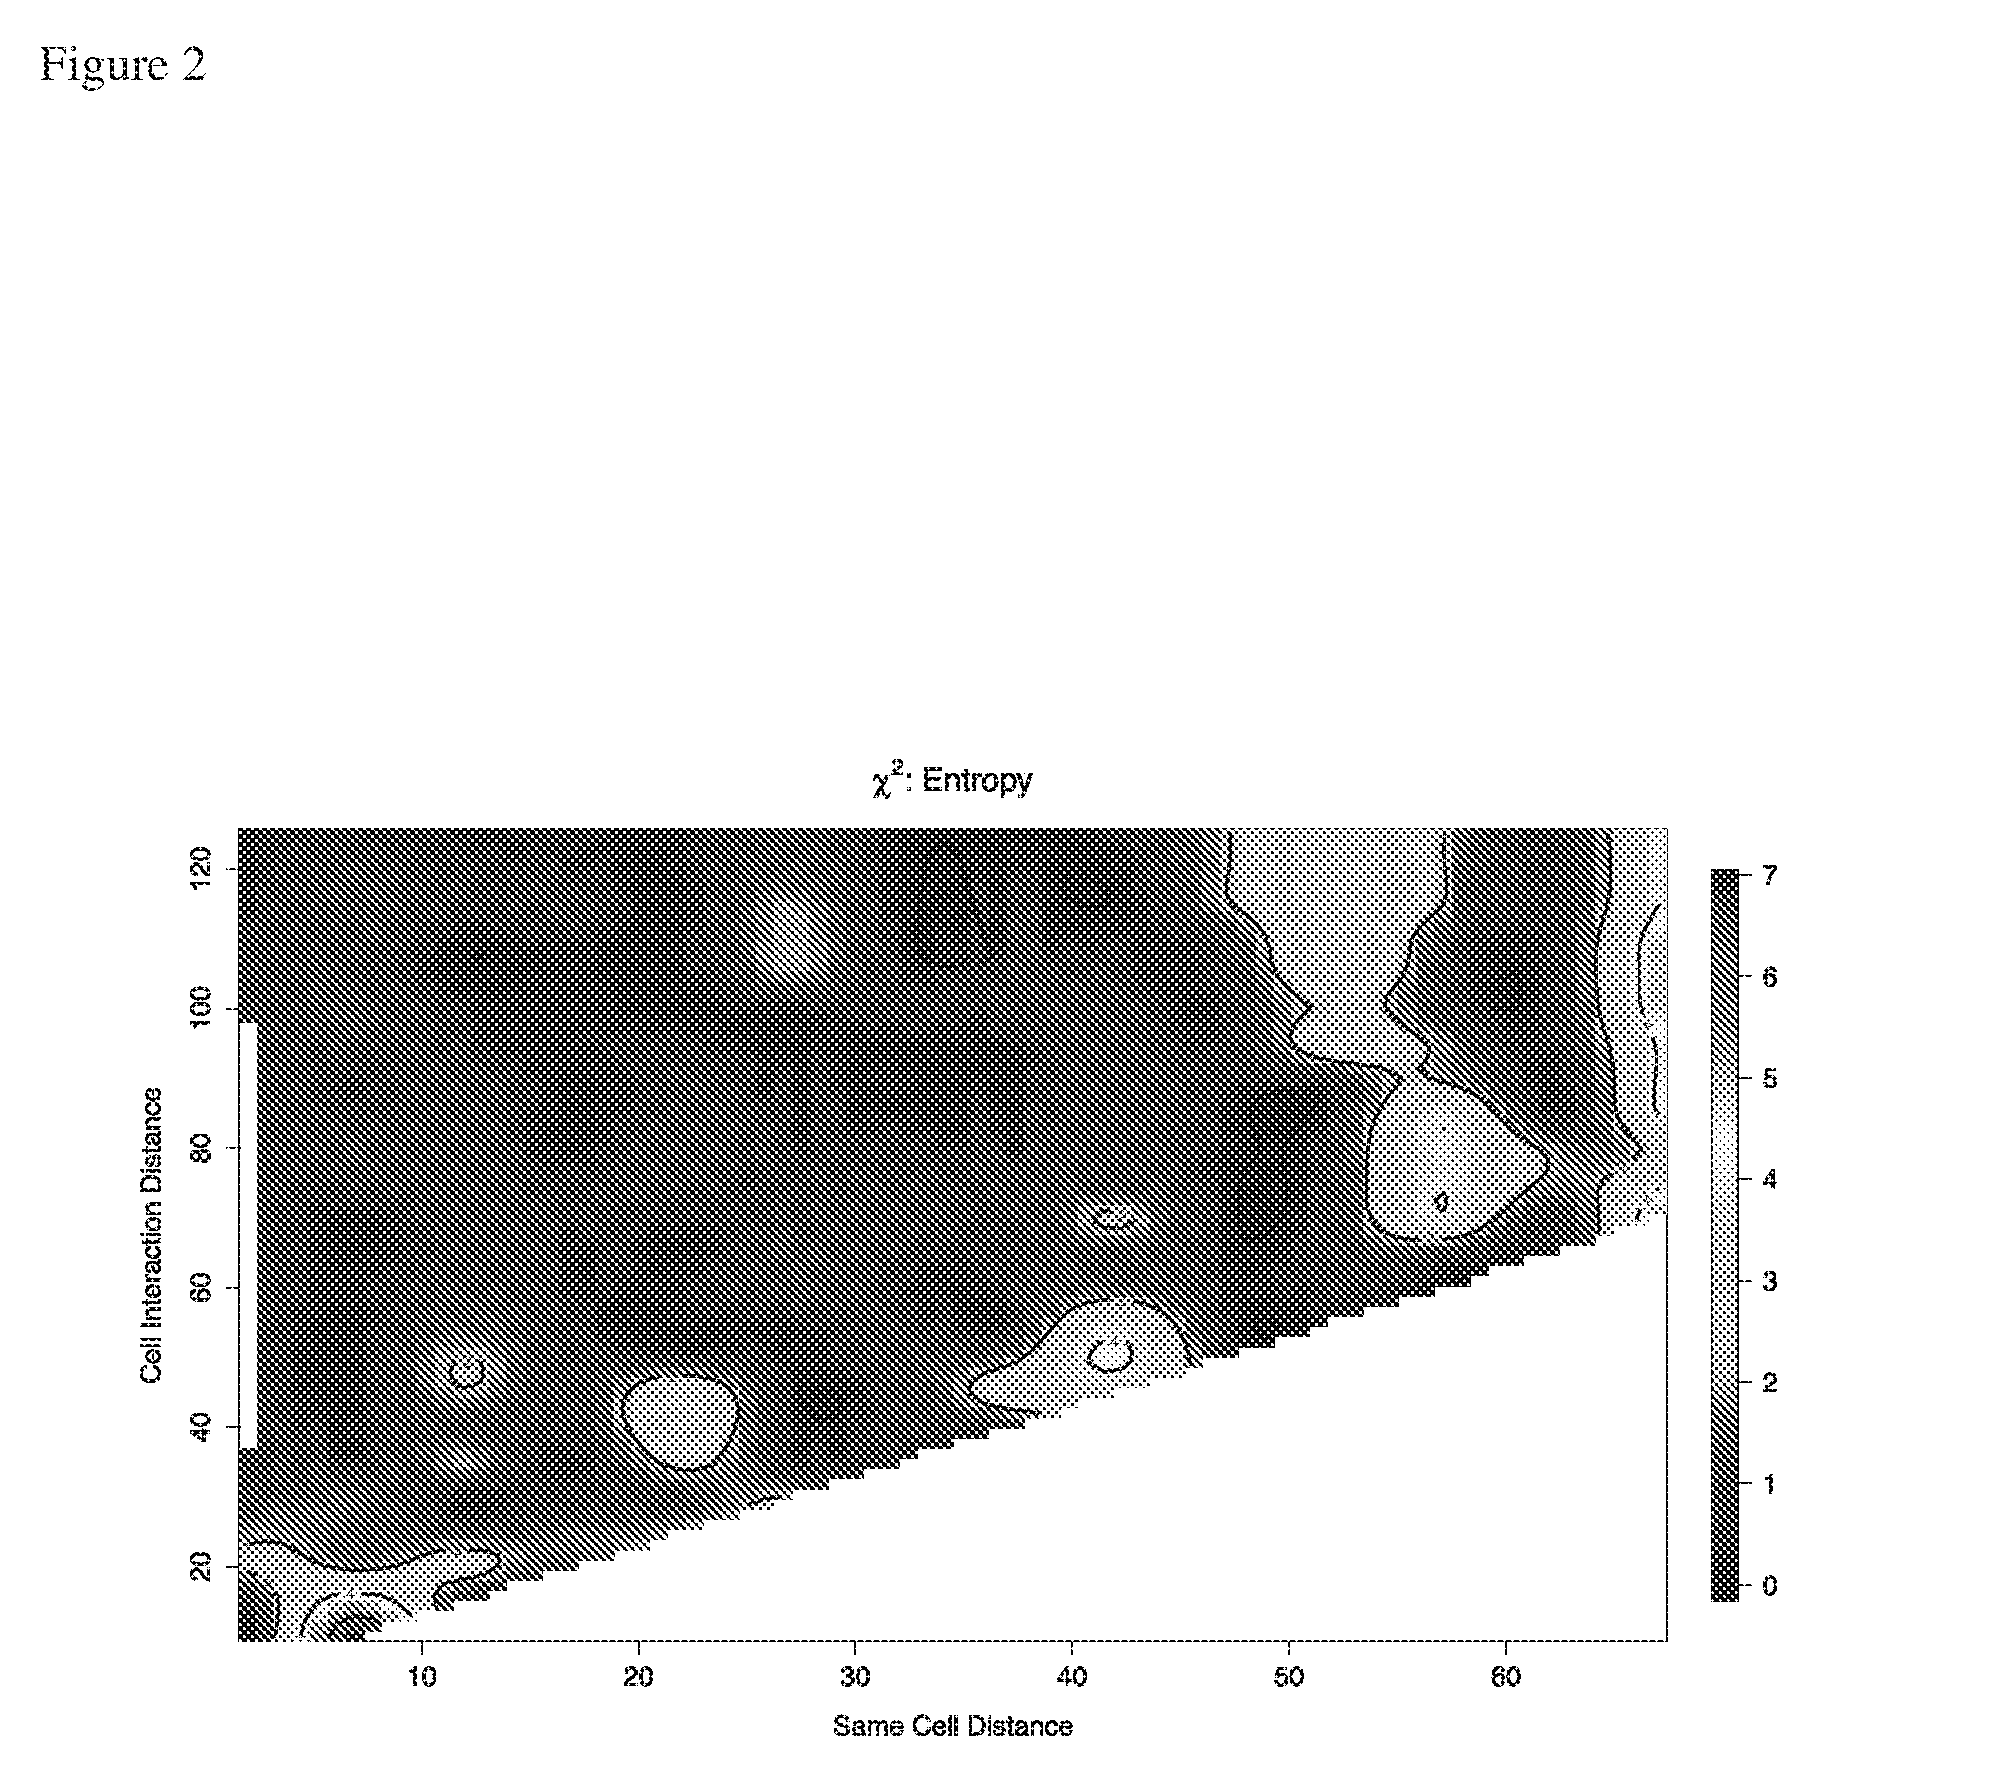
[0263]From the contour plot in FIG. 4, the optimal pairing and interaction distances of dp=13 and di=60, were determined (both measured in pixels using a ×400 magnification and a LeitzDiaplan fluorescence microscope and a Nuance spectral analyser as used in Example 1). These optimal distances can be obtained by calculating the “hottest” point of the region of the contour plot marked as “10” (i.e. towards the upper end of the k...


PUM


Abstract

Provided herein is a computer-implemented method for quantifying the spatial distribution of cells or sub-cellular structures, the method comprising the following steps performed by a computer: (a) receiving for a subject image data comprising a plurality of biomarkers, N, wherein the data represents a spatial map of the biomarkers; (b) processing the data to obtain a set of coordinates, wherein each coordinate denotes the location of a cell or sub-cellular structure represented by a biomarker or combination of biomarkers; (c) processing the set of coordinates into a two-dimensional symmetric (2N−1)×(2N−1) or 2N×2N matrix (D), wherein each element (i, j) of the matrix indicates the frequency of a cell or sub-cellular structure represented by a first biomarker or combination of biomarkers (i) being observed within an interaction distance, di, of a cell or sub-cellular structure represented by a second biomarker or combination of biomarkers (j), and wherein i and j may be the same or different; and (d) using a classifier to assign the subject to a group or category based on the two-dimensional symmetric matrix (D).

Description

FIELD OF THE INVENTION[0001]The present invention relates to a new method for quantifying the spatial distribution of cells or sub-cellular structures.BACKGROUND OF THE INVENTION[0002]It is desirable for both research and clinical reasons to monitor analyse and spatially characterise cellular and sub-cellular patterns. Such patterns may, for example, be monitored, analysed and / or characterised using histological staining and immunohistochemistry.[0003]Immunohistochemistry (IHC) refers to the process of detecting antigens (e.g. proteins) in cells of a tissue sample by exploiting the principle of antibodies binding specifically to antigens in biological tissues. Immunohistochemical staining is widely used in the diagnosis of abnormal cells such as those found in cancerous tumours, since specific molecular markers are characteristic of particular cellular events such as proliferation or cell death. IHC is also widely used in basic research to understand the distribution and localisatio...

Claims


Application Information

Patent Timeline
Patent Type & Authority Applications(United States)
IPC IPC(8): G06T7/00G06K9/66G06K9/52G06T7/60G06K9/62G06V10/422G06V10/764
CPCG06T7/0012G06T7/60G06K9/6267G06K9/52G06K9/00147G06K9/6215G06K9/66G06K9/6244G06K9/6256G06V20/695G06V20/698G06V10/422G06V10/761G06V10/764G06V10/7715G06F18/22G06F18/24G06F18/21345
Inventor BYERS, RICHARD JOHNROSE, CHRISTOPHER
Owner UNIV OF MANCHESTER
Why Eureka
Try Eureka