
Analysis device

a technology of an analysis device and a chromatograph, which is applied in the direction of measurement devices, instruments, scientific instruments, etc., can solve the problems of inability to detect the minute amount of impurities in some cases, and the impurity peak hidden in the base line raised by background noise cannot be found in the chromatogram, chromatograph mass spectrometer, etc., so as to reduce the burden on users and confirm the retention time of impurities

Active Publication Date: 2019-06-06
SHIMADZU CORP
View PDF0 Cites 3 Cited by
  • Summary
  • Abstract
  • Description
  • Claims
  • Application Information

AI Technical Summary

Benefits of technology

The present invention provides an analysis device that can detect tiny amounts of impurities in chromatogram data, which was previously difficult to detect. The device can also automatically create an analysis method for removing the influence of impurities in real-time, reducing the burden on users. Additionally, the device can confirm the mass to charge ratio of ions derived from impurities, and automatically create an analysis method based on the impurities as the target. The device can also confirm the retention time of impurities by detecting a peak on an extraction ion chromatogram at a mass to charge ratio of impurity-derived ions.

Problems solved by technology

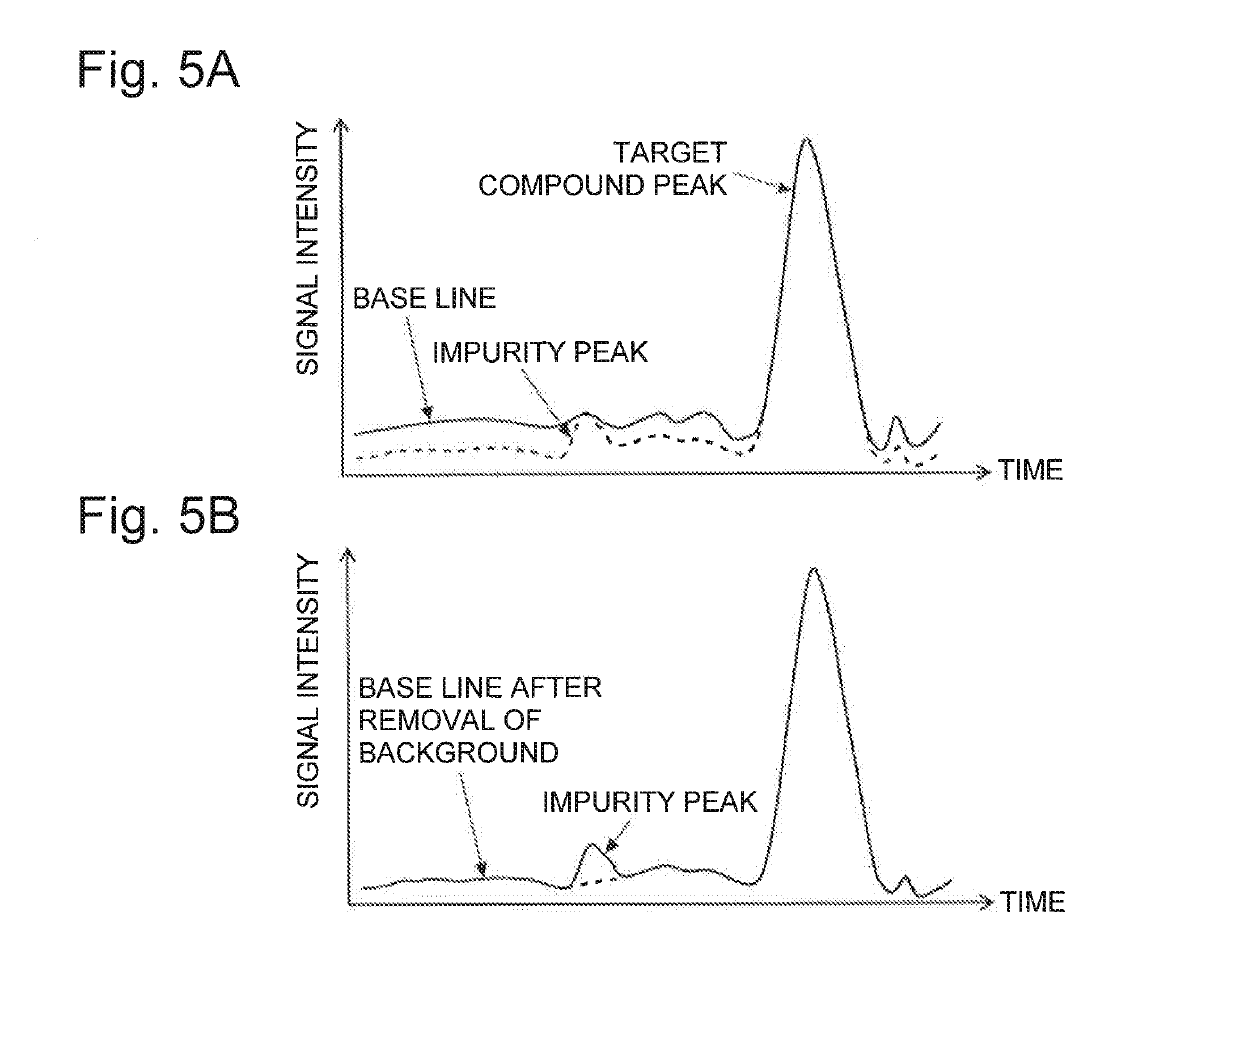
This causes the peaks of minute amounts of impurities hidden in the base line, thus making it impossible to detect the minute amounts of impurities in some cases.
However, even if such process is performed, an impurity peak hidden in the base line raised by the background noise cannot be found in the chromatogram.
Further, the gas chromatograph mass spectrometer which is a combination of a gas chromatograph and a mass spectrometer also poses a similar problem due to impurities contained in a carrier gas.

Method used


Image

  • Analysis device
  • Analysis device
  • Analysis device

Examples


first example

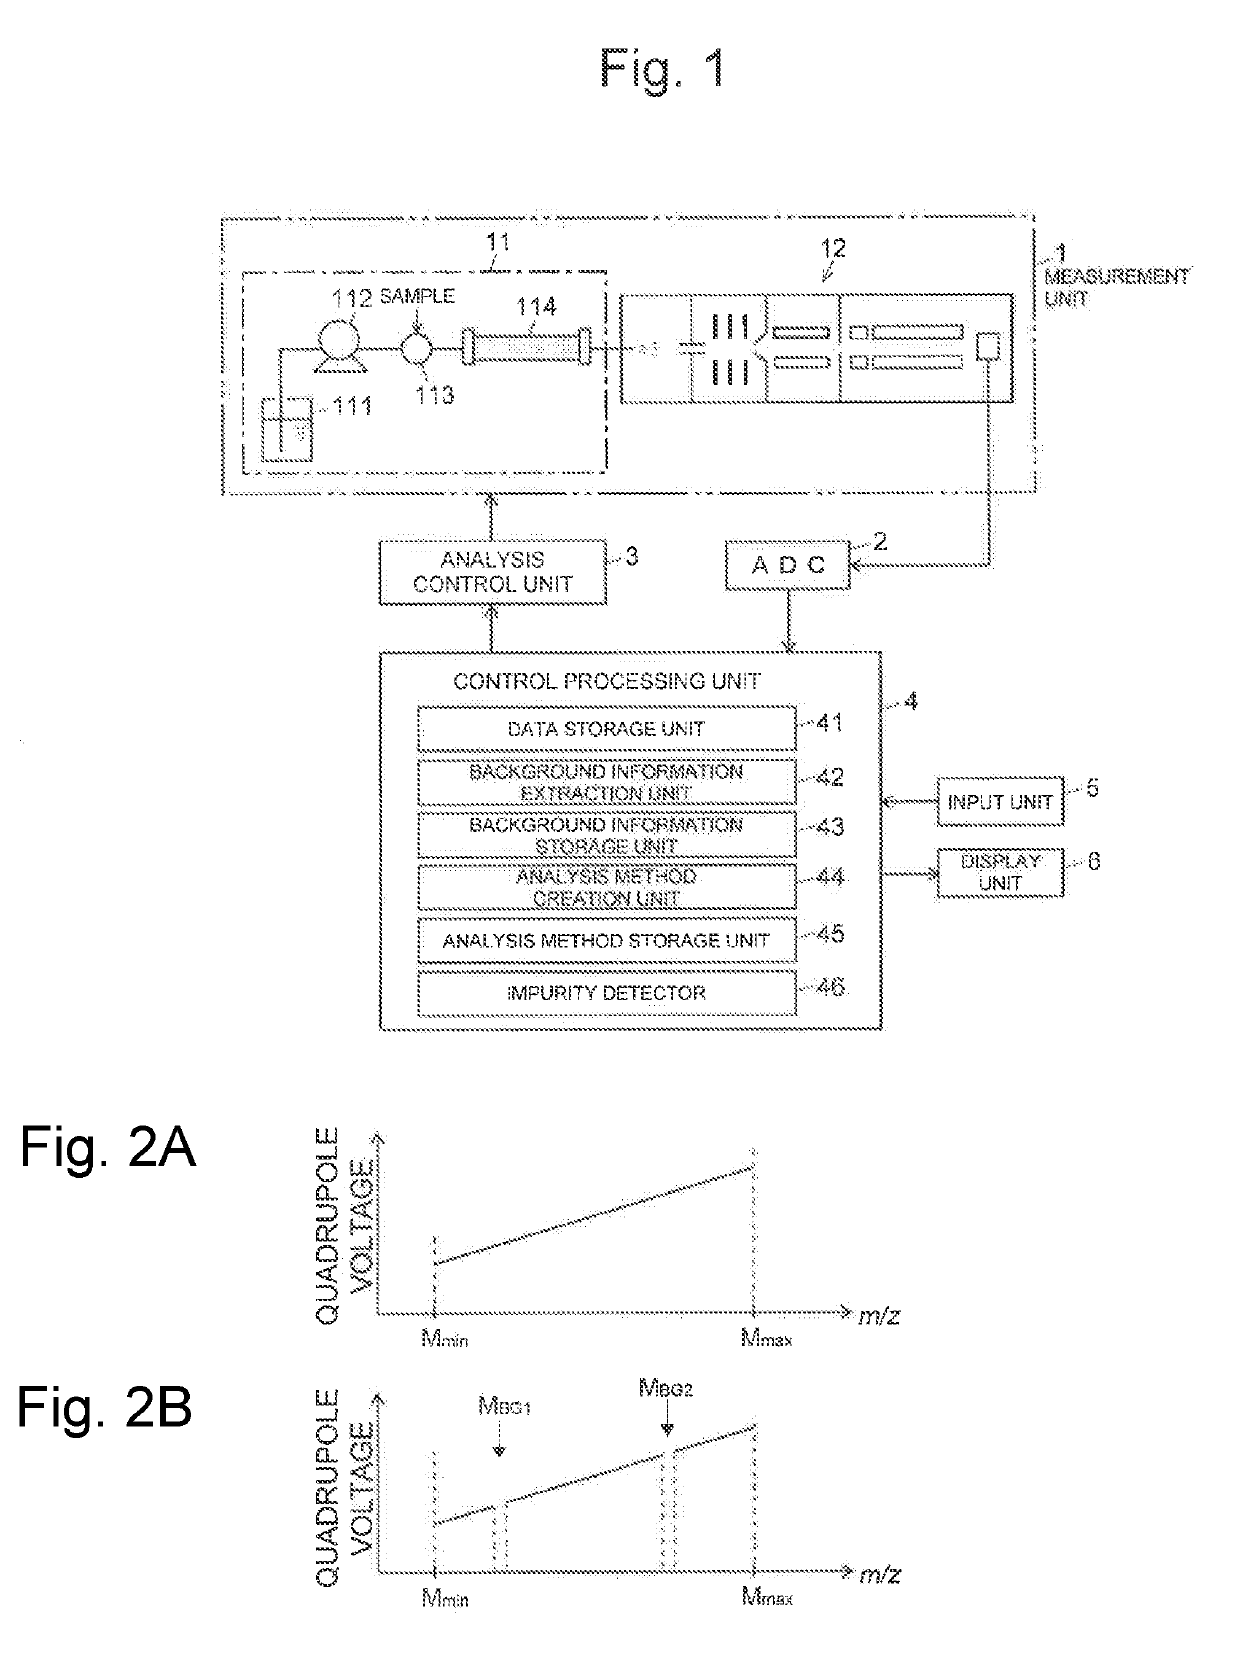
[0051]LC-MS according to a first example of the present invention will be described with reference to the accompanying drawings. FIG. 1 is a configuration diagram of a principal part of LC-MS of the first example.

[0052]A measurement unit 1 includes a liquid chromatograph (LC unit) 11 and a mass spectrometer (MS unit) 12. The liquid chromatograph 11 includes a liquid feed pump 112 that suctions a mobile phase from a mobile phase container 111 and supplies the mobile phase, an injector 113 that injects a sample into the mobile phase, and a column 114 that separates individual components in the sample. On the other hand, the mass spectrometer 12 is a quadrupole mass spectrometer provided with a quadrupole mass filter as a mass spectrograph.

[0053]The detection signal obtained in the measurement unit 1 is converted to digital data in an analog digital converter (ADC) 2 and is input into a control processing unit 4. The control processing unit 4 to which an input unit 5 and a display unit...

second example

[0070]Next, LC-MS according to a second example of the present invention will be described with reference to the accompanying drawings.

[0071]FIG. 6 is a configuration diagram of a principal part of LC-MS according to the second example of the present invention, and, in FIG. 6, the same elements as those in the LC-MS of the first example in FIG. 1 have the same reference numerals. A measurement unit 1, ADC 2, and an analysis control unit 3 are the same as those in the LC-MS in the first example. A control processing unit 4 includes, in addition to a data storage unit 41, a background information extraction unit 42, and a background information storage unit 43 that are the same as those in the LC-MS in the first example, functional blocks such as a significant peak detector 401, an automatic SIM measurement control unit 402, an EIC creation unit 403, and an analysis method creation unit 404.

[0072]Characteristic action in the LC-MS of the second example will be described with reference...


PUM

PropertyMeasurementUnit
mass to charge ratioaaaaaaaaaa
massaaaaaaaaaa
charge ratioaaaaaaaaaa

Abstract

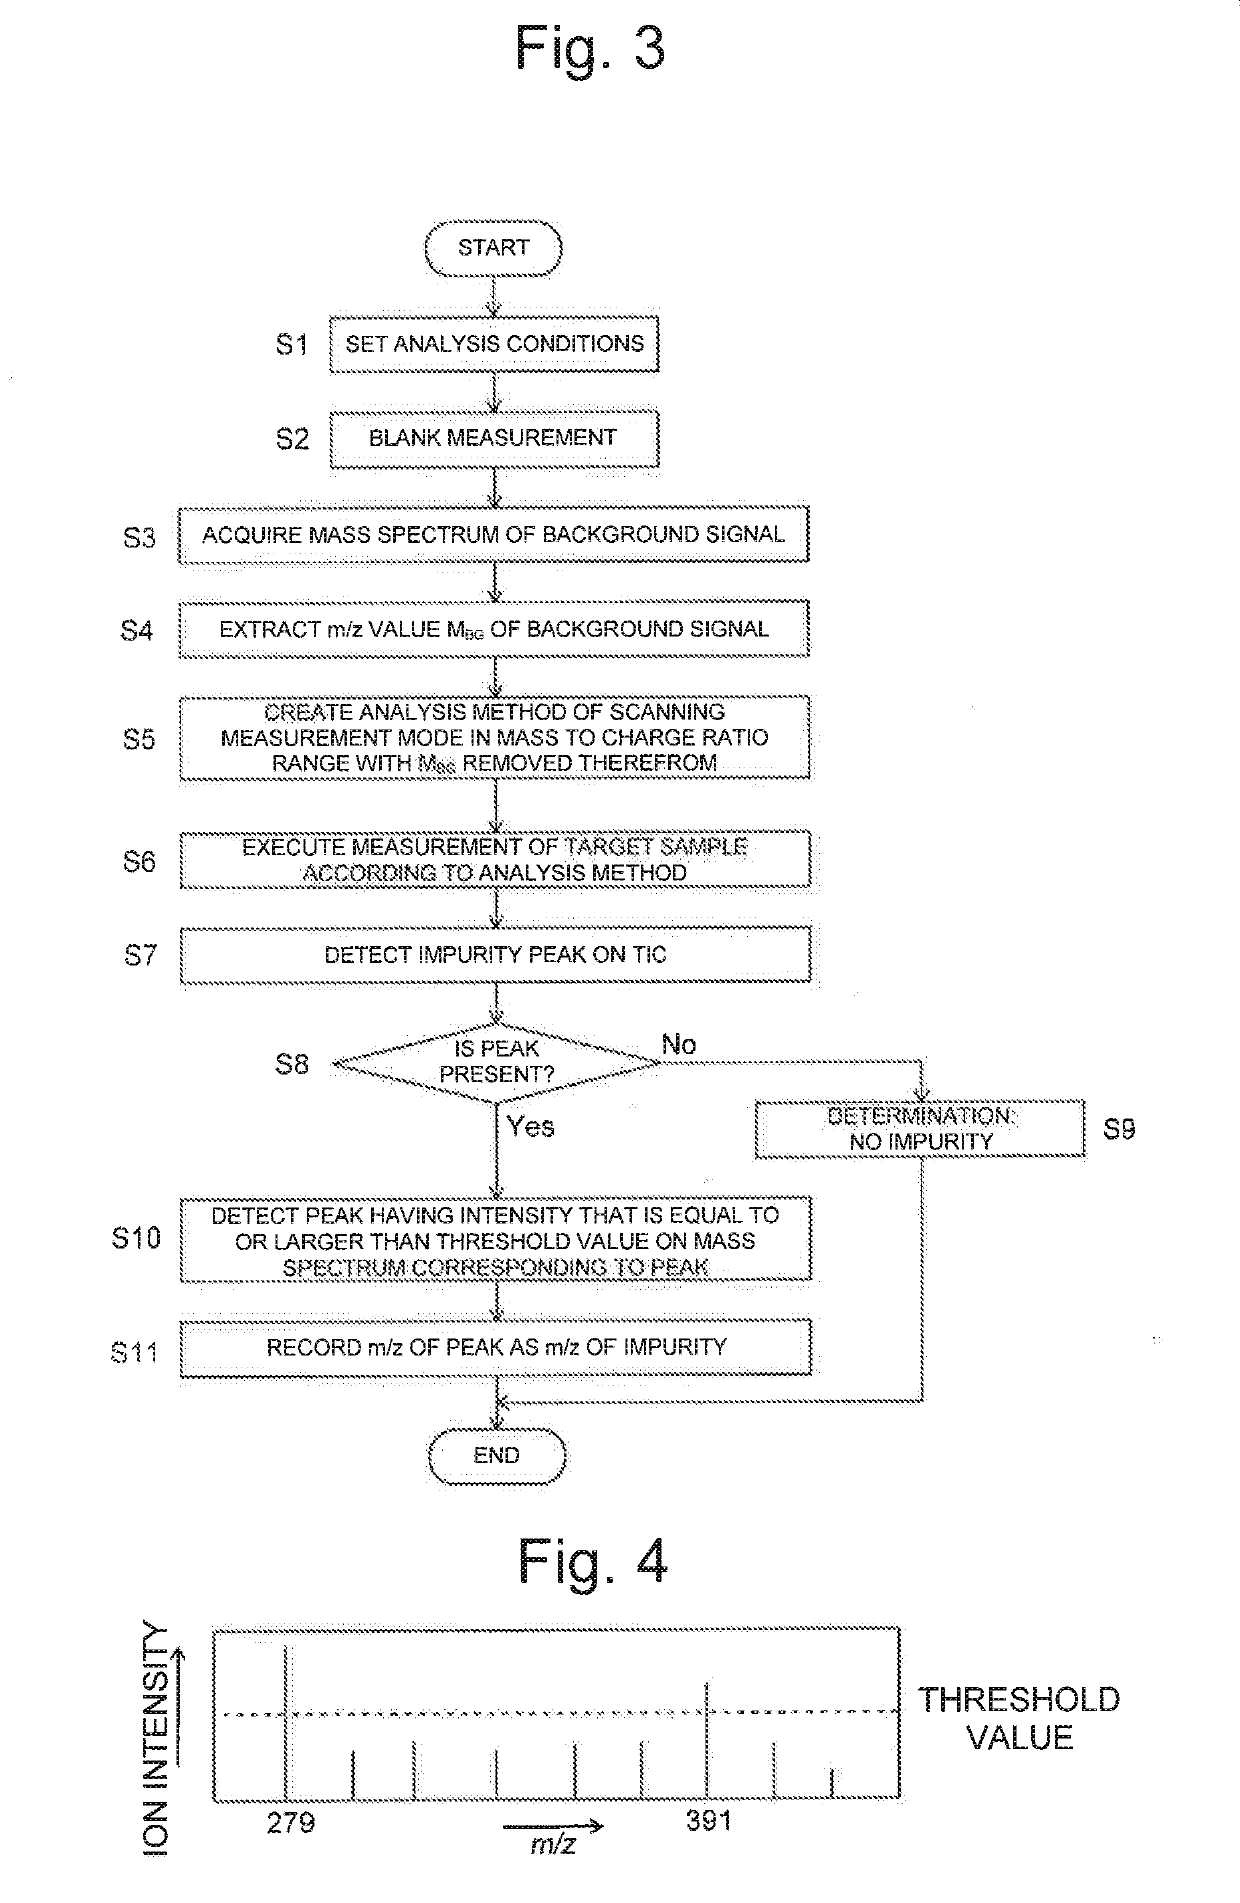
The detection of minute amounts of components that have been undetectable due to an influence of a mobile phase or reagents or the like added to the mobile phase is realized in LC-MS. At the outset, blank measurement is executed, and an m / z value MBG of a background signal derived from a mobile phase or the like is extracted on a mass spectrum obtained by the blank measurement (S2-S4). An analysis method is then created that executes scanning measurement in a plurality of divided m / z ranges in which the m / z value MBG of the background signal has been excluded from a predetermined m / z range. An LC / MS analysis of the target sample is executed according to the analysis method (S5-S6). When a total ion chromatogram (TIC) is created from data obtained by the LC / MS analysis, influence of the background signal hardly appears in the TIC, and the base line is lowered.

Description

TECHNICAL FIELD[0001]The present invention relates to an analysis device such as a chromatograph mass spectrometer which is a combination of a liquid chromatograph (LC) or a gas chromatograph (GC) and a mass spectrometer, or a spectrophotometer.BACKGROUND ART[0002]In the liquid chromatograph mass spectrometer, various compounds contained in a sample are temporally separated from each other with a liquid chromatograph, the separated compounds are detected with a mass spectrometer, and an intensity signal corresponding to the content is acquired for each compound. When the compound contained in the sample is unknown or when an unknown compound should be detected, in general, scanning measurement in a predetermined mass to charge ratio range is repeatedly performed in the mass spectrometer, so that even a compound having an unknown mass can be detected without fail.[0003]In the field of synthetic chemistry such as manufacture and development of pharmaceutical products and manufacture a...

Claims


Application Information

Patent Timeline
Patent Type & Authority Applications(United States)
IPC IPC(8): G01N30/86G01N30/72
CPCG01N30/8631G01N30/72G01N30/7206G01N30/7233G01N30/86G01N2030/8872G01N30/8641G01N30/8679G01N2030/625
Inventor UEDA, MANABUWATANABE, JUN
Owner SHIMADZU CORP
Learn More