Hyperspectral imaging system
a hyper-spectral imaging and time-lapse data technology, applied in the field of hyper-spectral imaging systems, can solve the problems of principal component analysis, linear unmixing, and inability to apply approaches, and achieve the effects of effectively analysing five-dimensional data, fast analysis time, and effective analysis of hyper-spectral time-lapse data
- Summary
- Abstract
- Description
- Claims
- Application Information
AI Technical Summary
Benefits of technology
Problems solved by technology
Method used
Image

Examples
example 1
Lines
[0184]Adult fish were raised and maintained as described in [28] and in strict accordance with the recommendations in the Guide for the Care and Use of Laboratory Animals by University of Southern California, where the protocol was approved by the Institutional Animal Care and Use Committee (IACUC) (Permit Number: 12007 USC). Transgenic FlipTrap Gt(desm-citrine)ct122a / + line was obtained from a previously described screen in the lab [23], Tg(kdrkeGFP)s843 line [24] was provided by the Stainier lab, and Tg(ubiq:membrane-Cerulean-2a-H2B-tdTomato) line was generated by injecting a construct containing tol2 transposable elements flanking the ubiquitin promoter, coding sequence for membrane localized cerulean, a short sequence encoding the ribosome-skipping peptide of Thosea asigna virus (2a) followed by H2B-tdTomato. Upon crossing appropriate adult lines, the embryos obtained were raised in Egg Water (about 60 μg / ml of Instant Ocean and about 75 μg / ml of CaSO4 in Milli-Q water) at ...
example 2
eparation and Imaging
[0185]About 5 μM fluorescein (F1300, Invitrogen, Carlsbad, Calif.) solution in ethanol was prepared. For imaging, the solution was transferred into a sealed 10 mm glass bottom dish (P35G-1.5-10-c, MatTek Corporation, Ashland, Mass., USA) and mounted in an inverted confocal microscope. Imaging was performed on a Zeiss LSM780 inverted confocal microscope with QUASAR detector (Carl Zeiss, Jena, Germany). A typical dataset consists of 32 images, each of dimensions 512×512 pixels, corresponding to different wavelengths from about 410.5 nm to about 694.9 nm with about 8.9 nm bandwidth. The measurement is repeated 10 times using C-Apochromat 40× / 1.20 W Korr Zeiss objective at any given imaging parameter. Fluorescein was imaged with about 488 nm laser at different acquisition parameters (Table 1).
[0186]For in vivo imaging 5-6 zebrafish embryos at appropriate stage were placed into about 1% agarose (Catalog No. 16500-100, Invitrogen™) moulds created in an imaging dish wi...
example 3
alysis
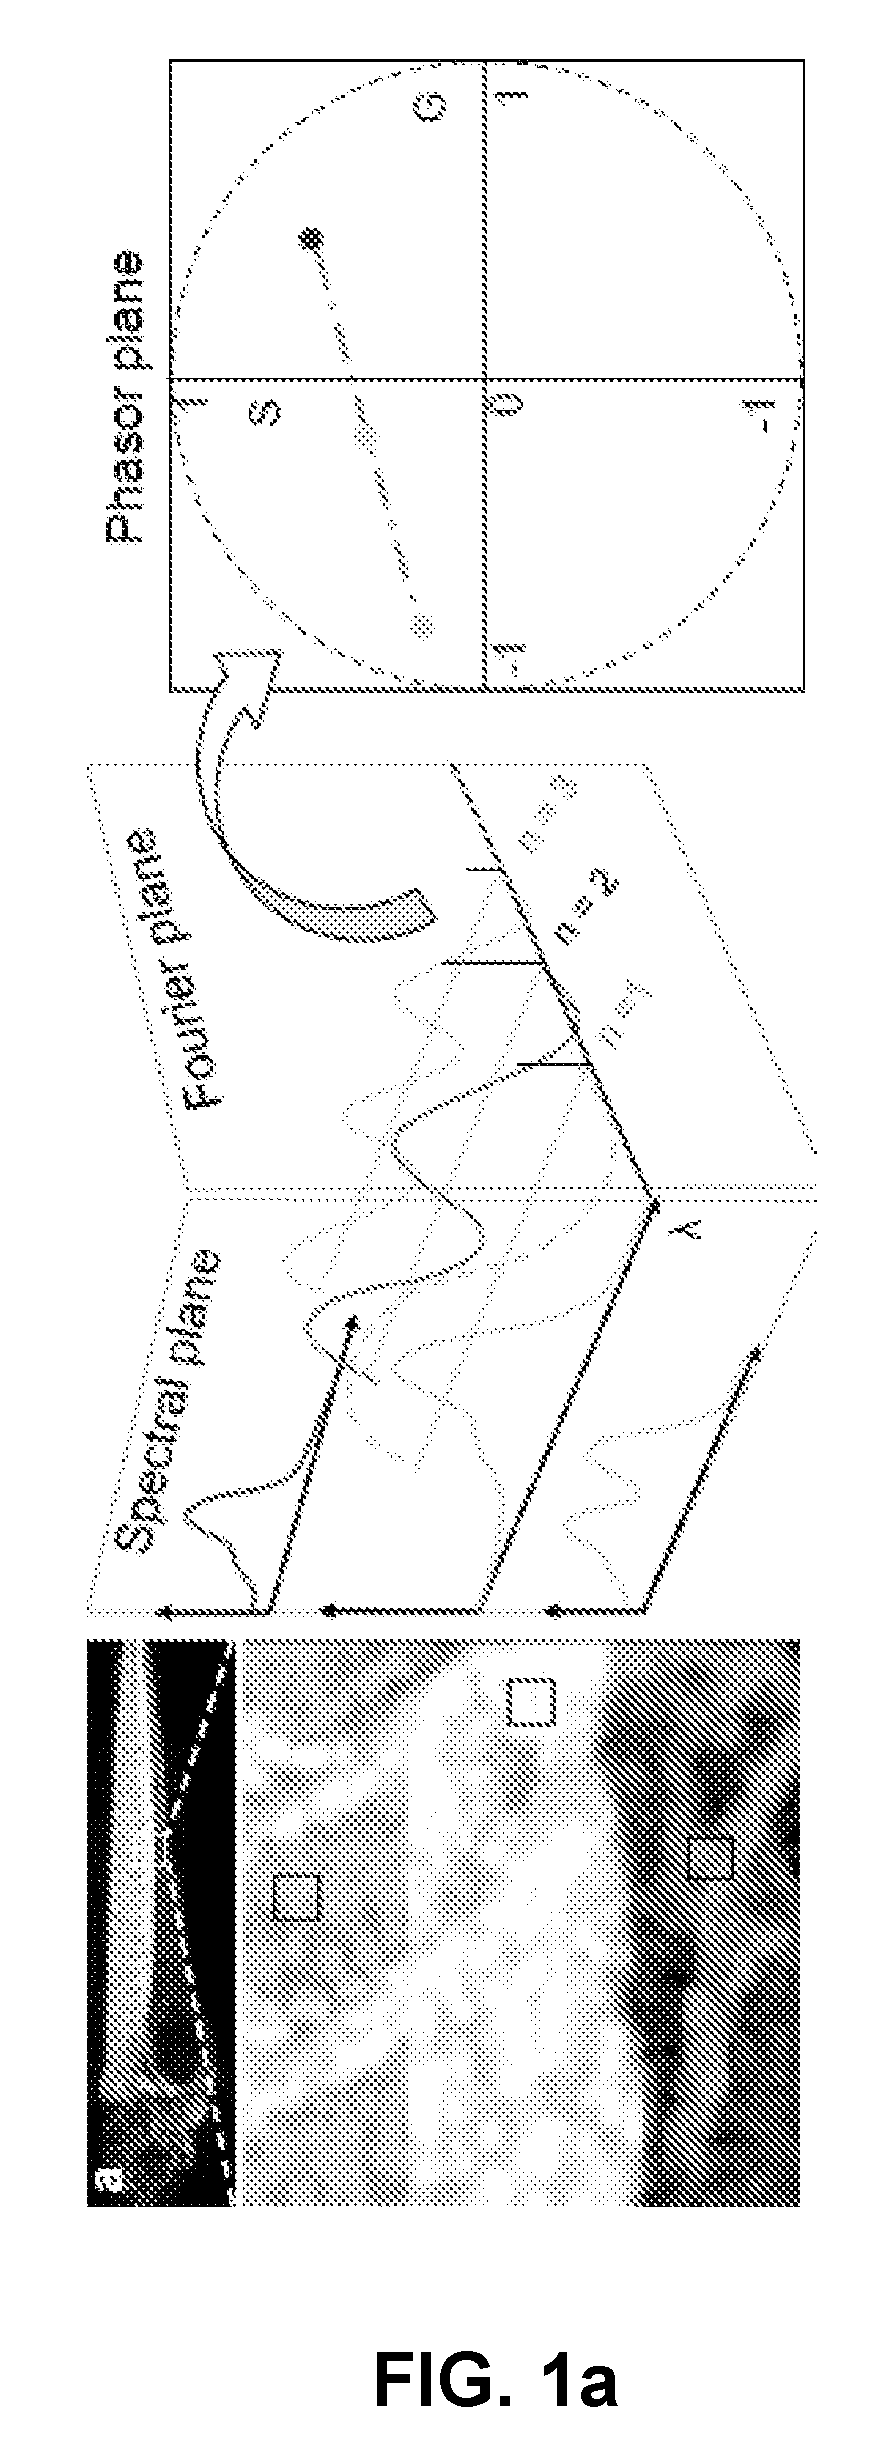
[0189]Transform:
[0190]For each pixel in a dataset, the Fourier coefficients of its normalized spectra define the coordinates of its phasor point (z(n)):
z(n)=G(n)+iS(n),whereG(n)=∑λsλfI(λ)cos(nωλ)Δλ∑λsλfI(λ)ΔλandS(n)=∑λsλfI(λ)sin(nωλ)Δλ∑λsλfI(λ)ΔλEquation(1)
[0191]where λs and λf are starting and ending wavelengths respectively; I is the intensity; ω=2π / τs with τs=number of spectral channels (e.g. 32) and n is the harmonic (e.g. 2).
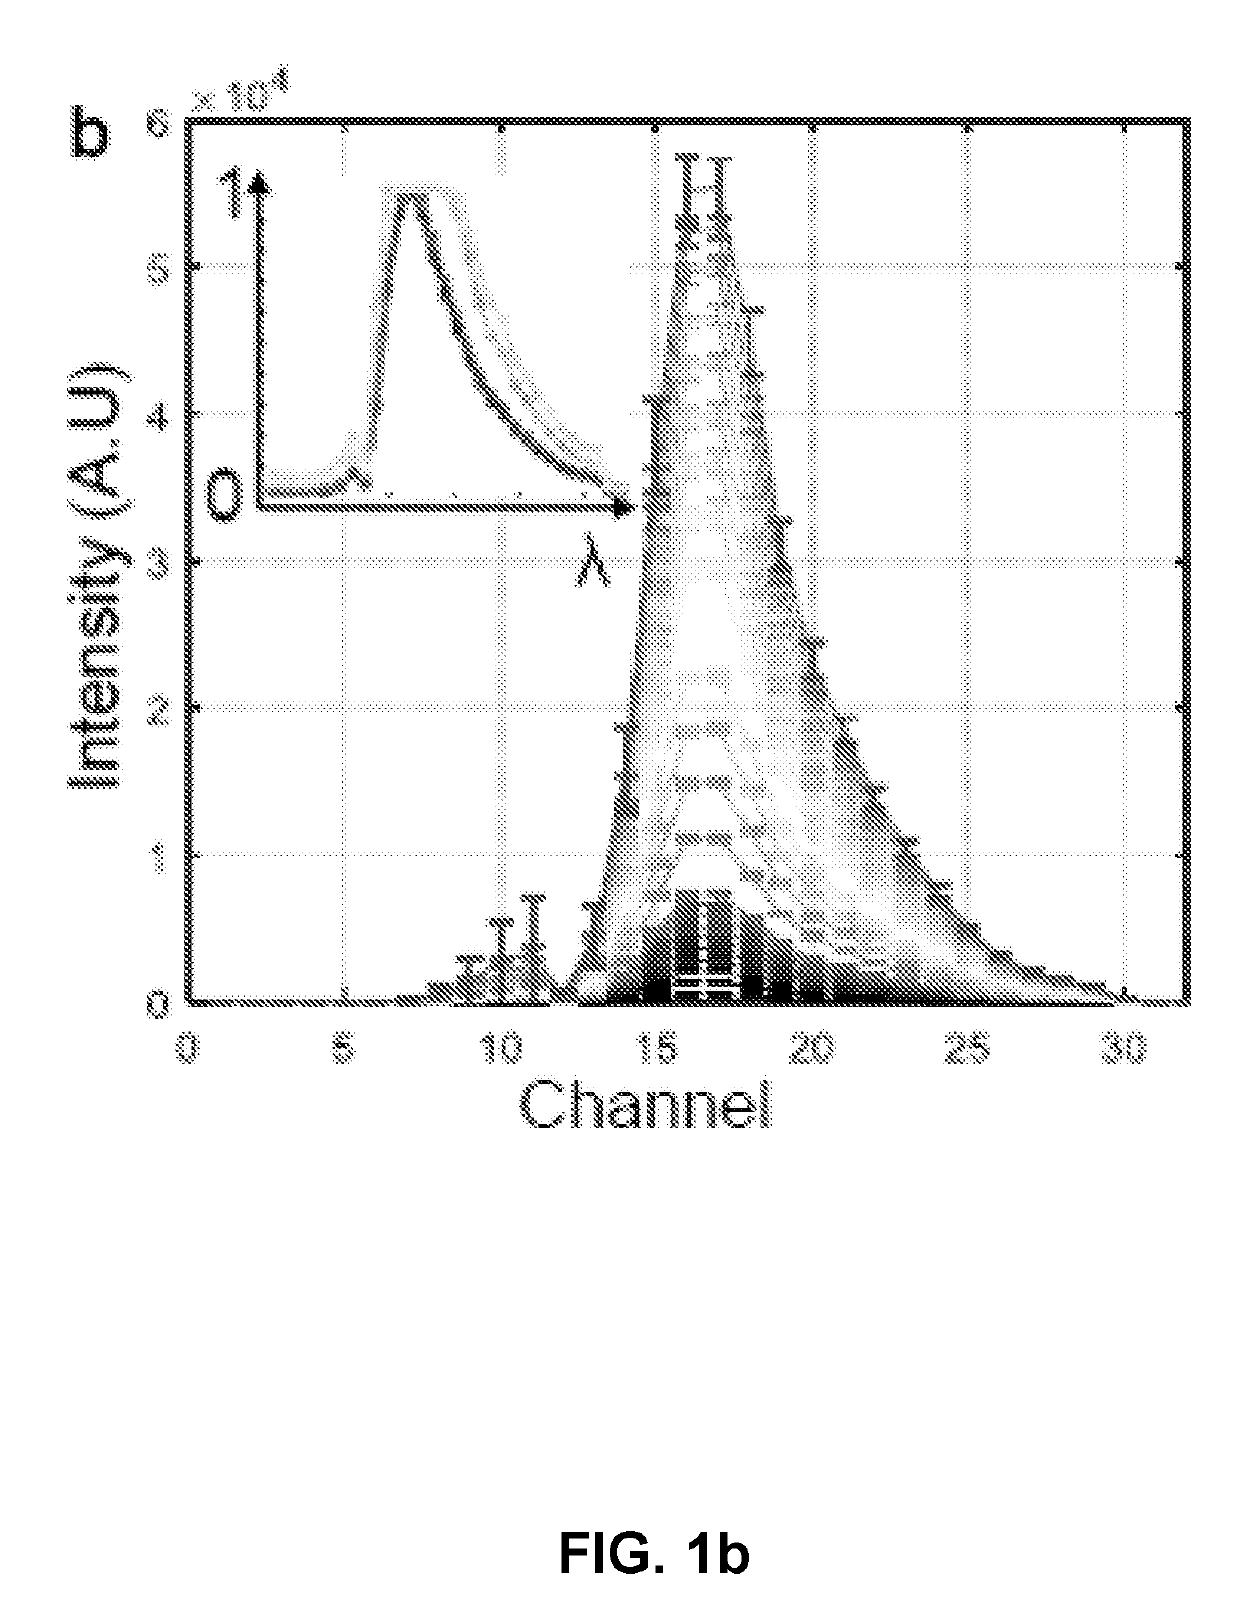
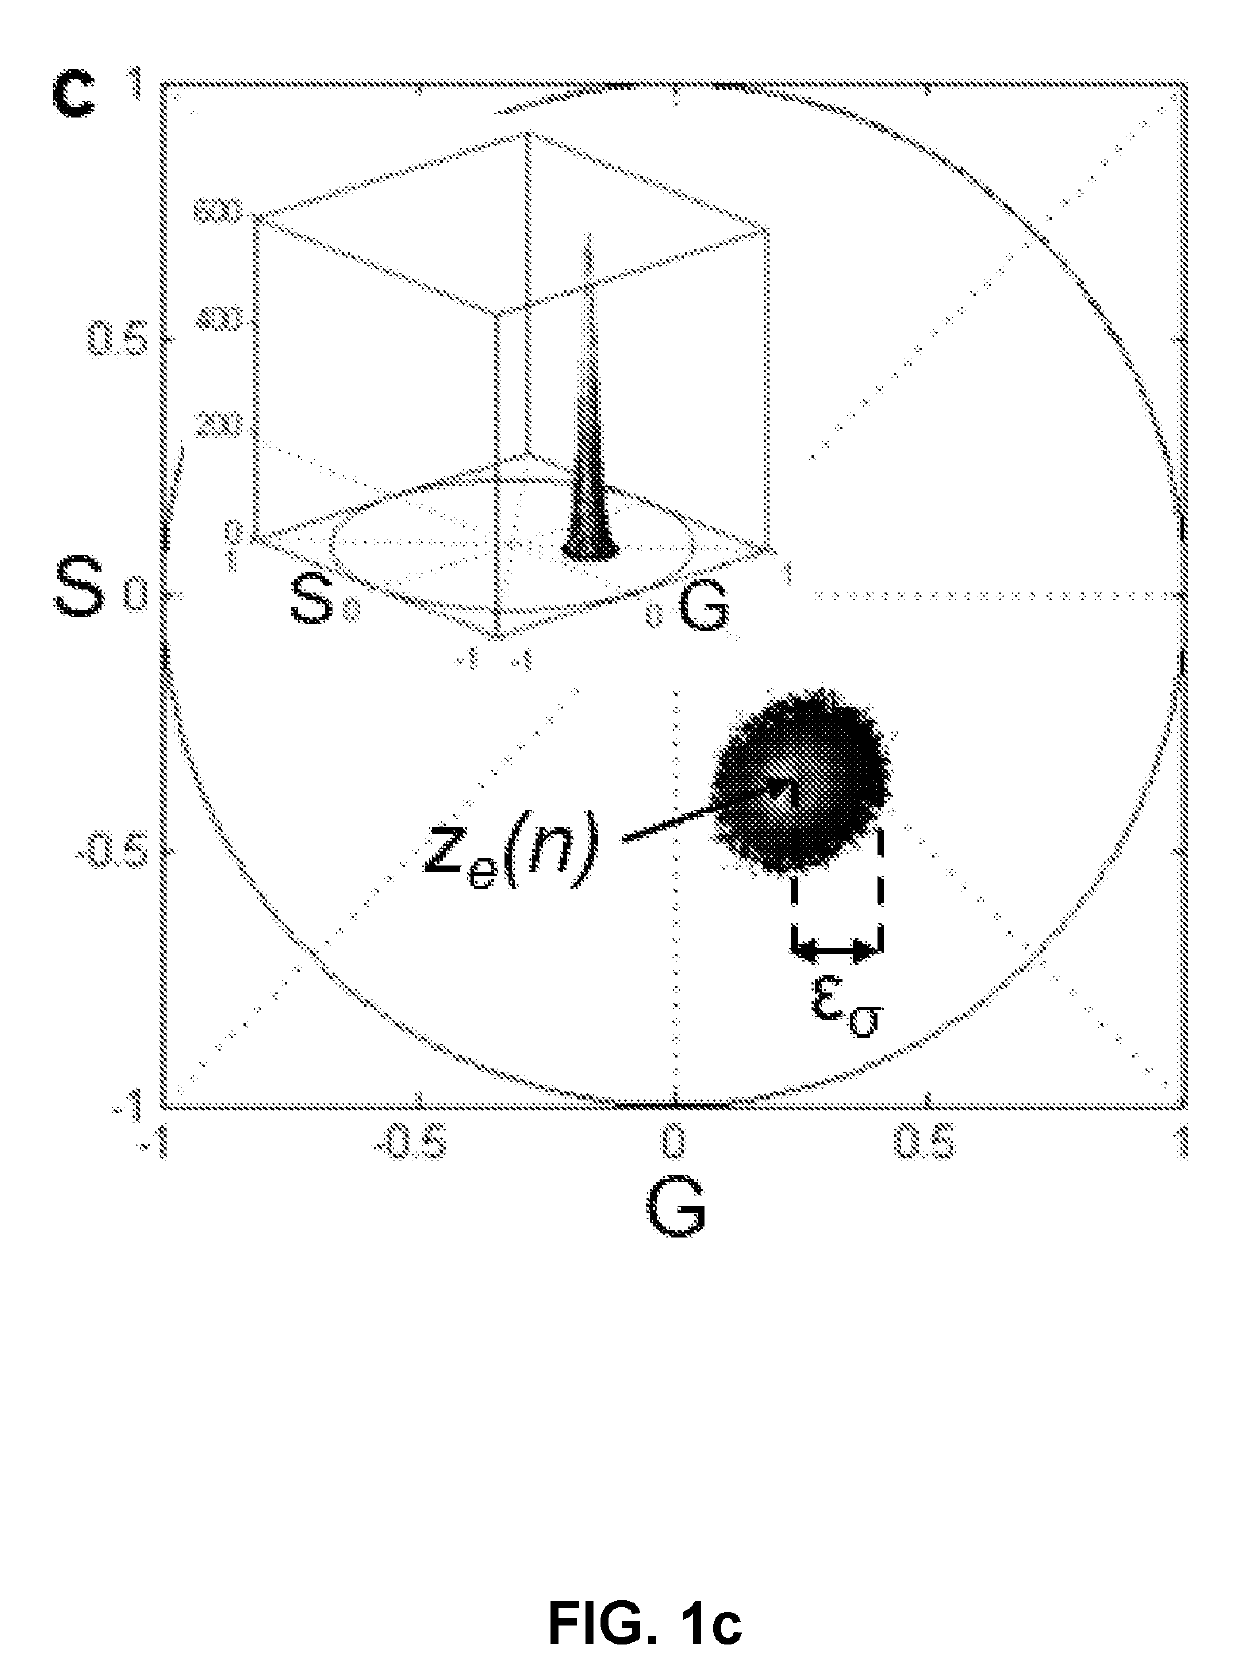
[0192]Scatter Error on Phasor Plot:
[0193]Scatter error is inversely proportional to square root of number of photons N:
std{z(n)}∝z(n)√NEquation(2)
[0194]This proportionality has been derived as follows. We define the recorded total signal intensity (digital counts, obtained by area under the spectral curve) as a measure of N with the assumption that the number of digital levels detected in confocal analog mode is proportional to the number of photons collected [20]. This implies:
EΔsλfI(λ)Δλ∝N. Equation (3)
[0195]Based on Equation 1 and by propagation o...
PUM
| Property | Measurement | Unit |
|---|---|---|
| wavelength | aaaaa | aaaaa |
| wavelength | aaaaa | aaaaa |
| wavelength | aaaaa | aaaaa |
Abstract
Description
Claims
Application Information
 - R&D
- Intellectual Property
- Life Sciences
- Materials
- Tech Scout
- Unparalleled Data Quality
- Higher Quality Content
- 60% Fewer Hallucinations
Browse by: Latest US Patents, China's latest patents, Technical Efficacy Thesaurus, Application Domain, Technology Topic, Popular Technical Reports.
© 2025 PatSnap. All rights reserved.Legal|Privacy policy|Modern Slavery Act Transparency Statement|Sitemap|About US| Contact US: help@patsnap.com