Methods of diagnosing viral infection
- Summary
- Abstract
- Description
- Claims
- Application Information
AI Technical Summary
Benefits of technology
Problems solved by technology
Method used
Image
Examples
example 1
CLEC18 Expression was Down-Regulated by HBV
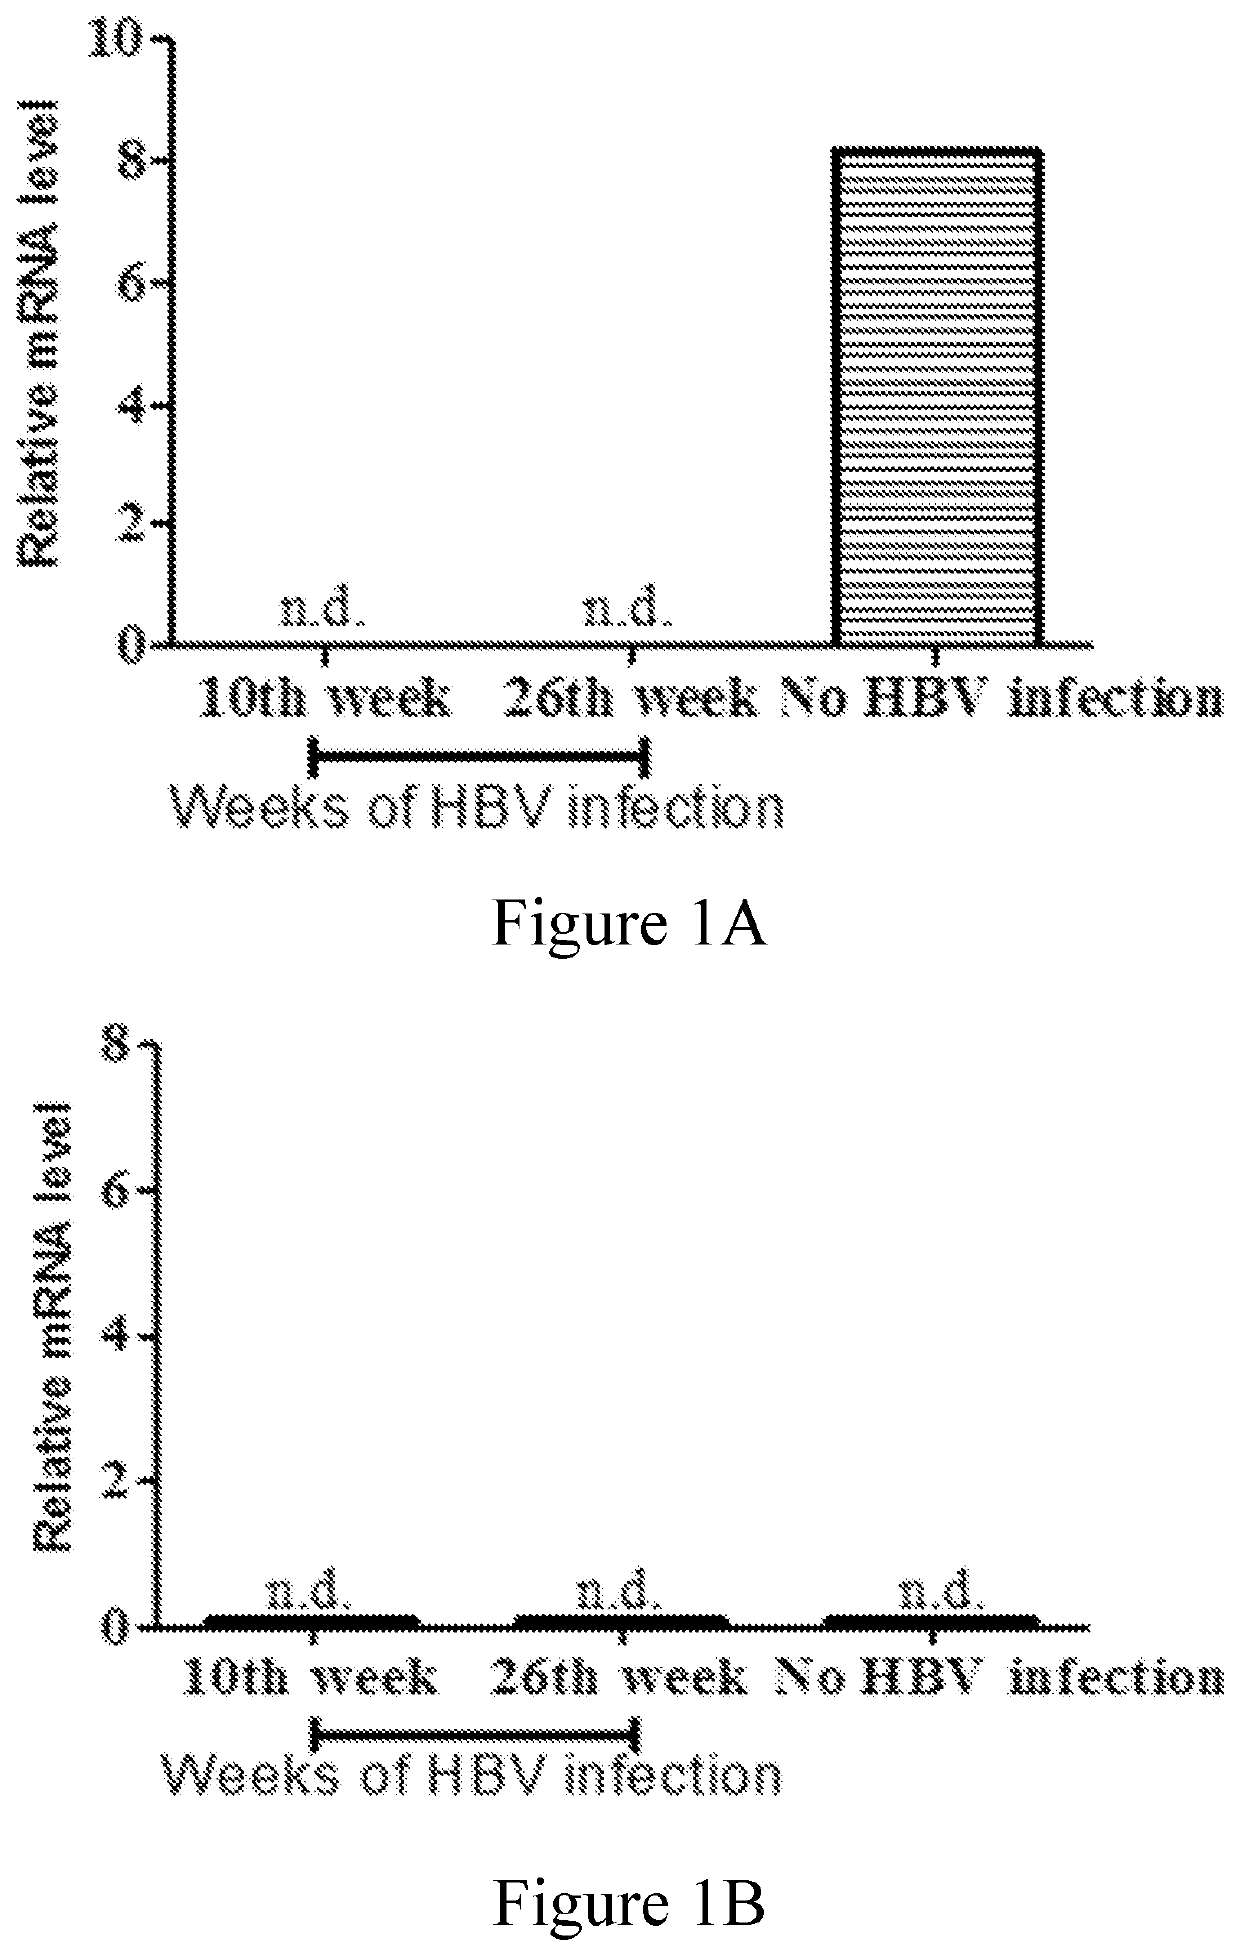
[0074]In this example, whether HBV infection would affect (e.g., increase or decrease) the expression of CLEC18 was examined by the mouse model and human patients. The results were respectively depicted in FIGS. 1A-1B and Tables 2-4.
[0075]The relative mRNA expression levels of human CLEC18 were dramatically down-regulated in the liver tissues of HBV-infected human liver chimeric mice after 10 and 26 weeks infection compared to those non-infected controls (FIG. 1A). Mouse CLEC18 was not detected, indicating that the liver tissue collected contained only human liver (FIG. 1B). This finding suggested that the expression of CLEC18 in human hepatocytes was down-regulated by HBV.
[0076]To further examine the role of CLEC18 in different stages of CHB, the patients having CHB were assigned into four groups according to the presence of HBeAg and HBV DNA levels. The baseline patient characteristics are presented in Table 2. In brief, compared with the...
example 2
Prediction of HBeAg Loss and Seroconversion by CLEC18
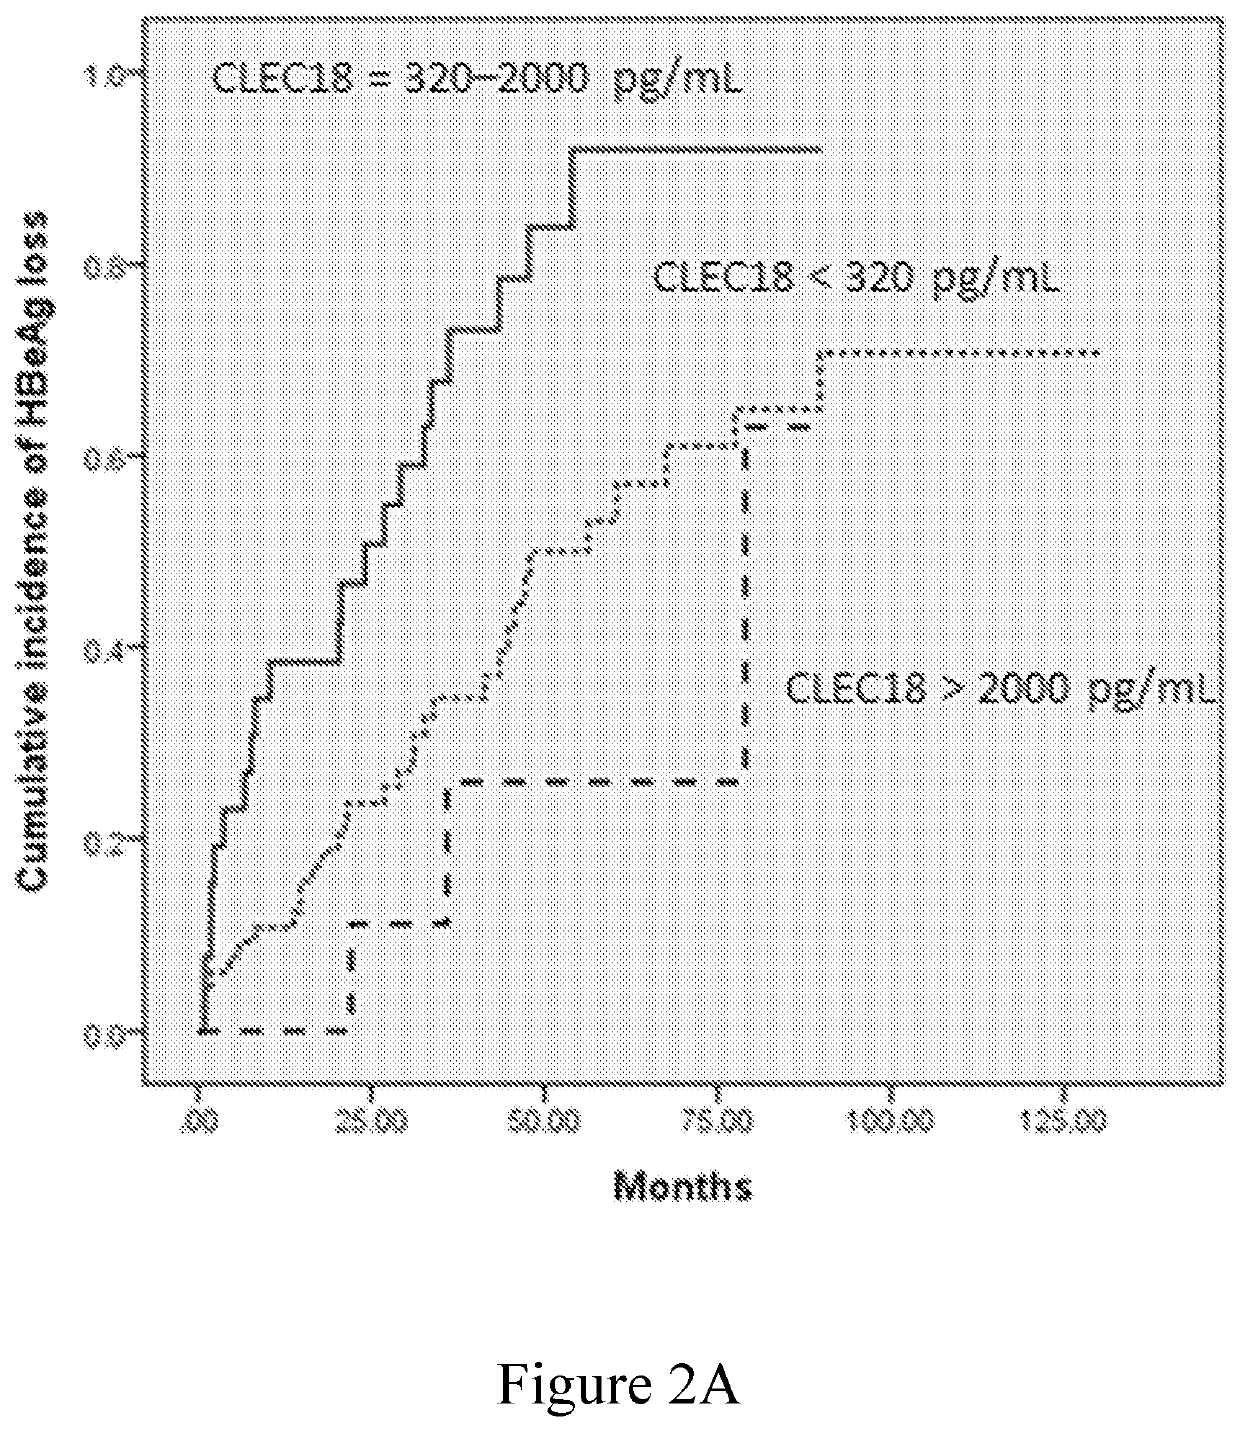
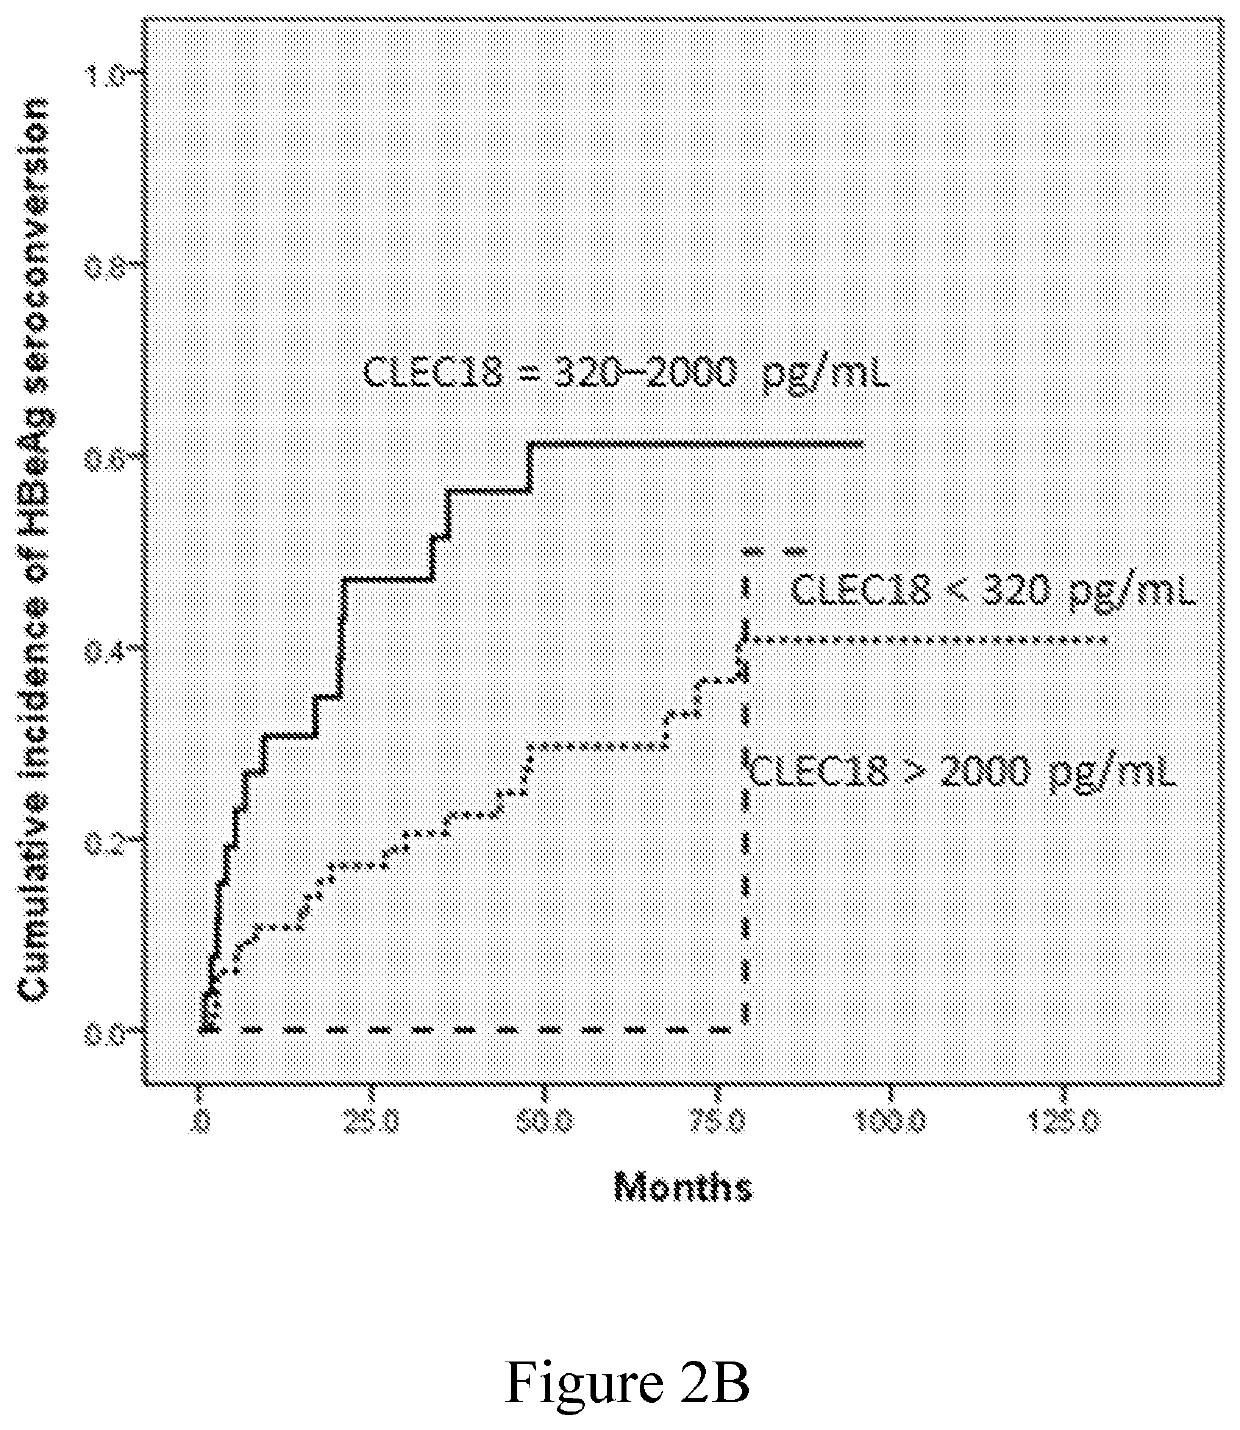
[0079]The role of plasma CLEC18 in the prediction of HBeAg loss and seroconversion in the patients who have CHB and receive NUC treatment was examined in this example. The data were respectively depicted in FIGS. 2A-2D and summarized in Tables 5-8.
[0080]The univariate analysis identified baseline ALT level >5×ULN, AFP >20 ng / mL, HBsAg level of 2,900-12,000 IU / mL, and plasma CLEC18 level of 320-2,000 pg / mL as the factors significantly associated with HBeAg loss (Table 5), and baseline ALT level >5×ULN and plasma CLEC18 level of 320-2,000 pg / mL as the factors significantly associated with HBeAg seroconversion (Table 6). The multivariate analysis identified baseline plasma CLEC18 level of 320-2,000 pg / mL as the independent predictors of HBeAg loss (odds ratio [OR]: 4.380, 95% confidence interval [CI]: 1.230-15.596, P=0.0226) and seroconversion (OR: 2.662, 95% CI: 1.002-7.071, P=0.0495) in the patients with CHB receiving NUC therapy. ...
example 3
Correlation of Plasma CLEC18 and Baseline HBsAg Level
[0082]The relationship between CLEC18 and HBsAg level was analyzed in the HBeAg-positive patients. CLEC18 and HBsAg levels had a low Spearman's correlation coefficient (data not shown). However, patients with baseline plasma CLEC18 levels of 2,000 pg / mL, the highest proportions had HBsAg levels of 12,000 IU / mL (50%), respectively (Table 9, P=0.2558). The categorized plasma CLEC18 levels tended to be correlated with the categorized HBsAg levels in the HBeAg-positive patients with CHB.
TABLE 9Correlation between HBsAg and CLEC18 levelsHBsAg level (IU / mL)TotalCLEC18 levelN = 100(pg / mL)2900-12000>12000(100%) 26 1720 63(41.27%)(26.98%)(31.75%)(100%)320-2000612927(22.22%)(44.44%)(33.33%)(100%)>20002 3510(20.00%)(30.00%)(41.27%)(100%)
PUM
| Property | Measurement | Unit |
|---|---|---|
| Volume | aaaaa | aaaaa |
| Volume | aaaaa | aaaaa |
| Volume | aaaaa | aaaaa |
Abstract
Description
Claims
Application Information
 - R&D
- Intellectual Property
- Life Sciences
- Materials
- Tech Scout
- Unparalleled Data Quality
- Higher Quality Content
- 60% Fewer Hallucinations
Browse by: Latest US Patents, China's latest patents, Technical Efficacy Thesaurus, Application Domain, Technology Topic, Popular Technical Reports.
© 2025 PatSnap. All rights reserved.Legal|Privacy policy|Modern Slavery Act Transparency Statement|Sitemap|About US| Contact US: help@patsnap.com


