Compact, all-optical spectrum analyzer for chemical and biological fiber optic sensors

Inactive Publication Date: 2000-01-18
CERAMOPTEC IND INC
View PDF2 Cites 202 Cited by
  • Summary
  • Abstract
  • Description
  • Claims
  • Application Information

AI Technical Summary

Benefits of technology

It is an object of the present invention to provide a simple spectrum analyzer which can oper

Problems solved by technology

Most of them use precision diffraction gratings and expensive precision mechanics to achieve their performance.
These spectrometers are rather large and expensive devices which can be used for detection of a signal from optical fiber sensors in laboratory, but not in field conditions.
A miniature fiber optic spectrometer S-1000 has been recently developed by Ocean Optics, Inc. for operation in UV, VIS and NIR ranges of spectrum This spectrometer, however, is not able to operate in Middle Infrared (MIR) range of spectrum which is the most importa

Method used


Image

  • Compact, all-optical spectrum analyzer for chemical and biological fiber optic sensors
  • Compact, all-optical spectrum analyzer for chemical and biological fiber optic sensors

Examples


Embodiment Construction

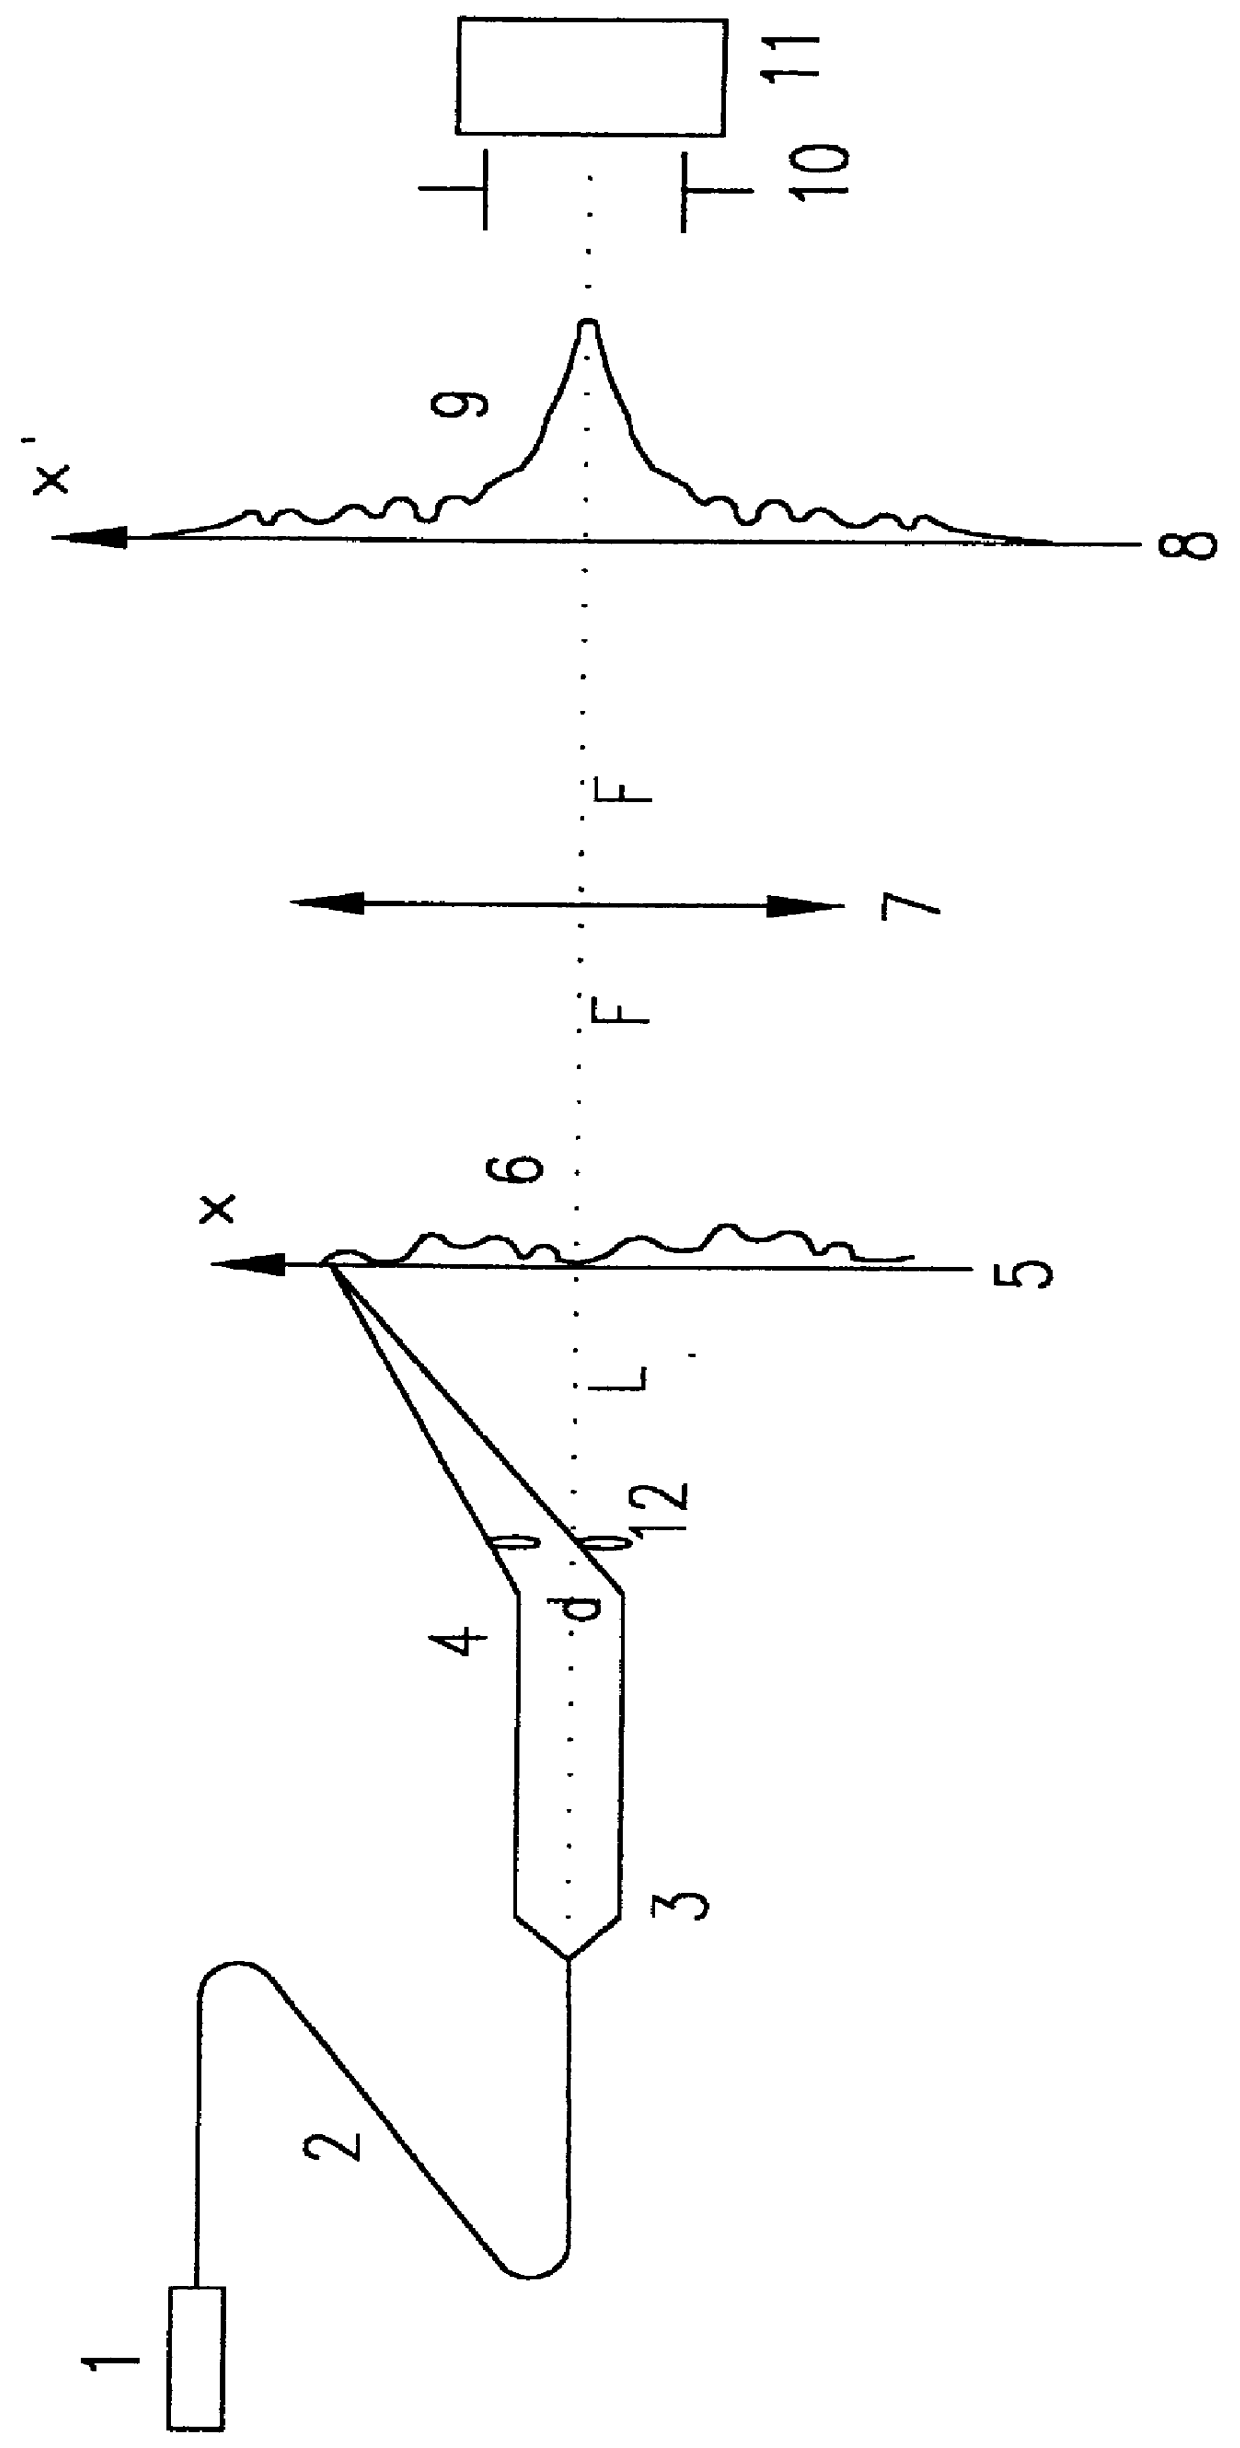
The present invention describes a new spectrum analyzer compatible with light transmitting optical fibers. FIG. 1 shows one preferred embodiment of such a spectrum analyzer.

A light signal from source or sensor 1 whose spectrum is to be analyzed is delivered by optical fiber 2. The output end of fiber 2 has Y-junction 3 which splits the delivered light beam into two parts having equal powers. End faces 4 of optical fiber Y-junction 3 are spaced apart by some distance d. Core cross section of the fibers in Y-junction 3 play a role of pinholes. Far field interference pattern 6 in plane 5 at distance L from the ends of Y-junction 3 is a direct measure of the autocorrelation function of light signal 1: C(x).congruent., with .tau..congruent.x(d / Lc), where E is an electric field component, x is transverse coordinate, c is the velocity of light, T.tau. is time delay and t is the time variable. The optical power spectrum P(.omega.) is the Fourier transform of the autocorrelation function and...


PUM


Abstract

An optical spectrum analyzer based on optical processing of the far field interference pattern from two beams irradiated by light transmitting waveguides is described. The spectrum analyzer can operate in UV, VIS, NIR and MIR ranges of spectrum and it can be based on either optical fibers (multimode or single-mode) or integrated optical waveguides. It has many important applications, for example, as a simple, compact and inexpensive spectrum analyzer used with fiber optic chemical and biological sensors.

Description

1. Field of the InventionThe present invention relates to optical spectrometers and in particular to a new class of flexible fiber optic or integrated optical spectrum analyzers for UV, VIS, NIR and MIR ranges of spectrum which do not require dispersion gratings, expensive mechanical parts or additional optical sources. The spectrum analyzer can be used with or in fiber optic chemical and biological sensors to monitor samples in situ instead of testing them in the laboratory.2. Information Disclosure StatementOptical spectrum analyzers have many important applications for monitoring the spectra of optical signals. They can be used, for example, in various fiber optic chemical and biological sensor systems designed to detect concentrations of different species. Each specific species to be detected has a certain characteristic absorption line, a so called fingerprint, which can be selected with the help of spectrum analyzers. Intensity of this selected spectrum line is proportional to...

Claims


Application Information

Patent Timeline
IPC IPC(8): G01J3/45G01J3/453G01J3/00G01J3/02G01N21/77
CPCG01J3/02G01J3/0218G01J3/0256G01J3/453G01N21/7703G01N2021/7779
Inventor KRIVOSHLYKOV, SERGEJ G.
Owner CERAMOPTEC IND INC
Why Eureka
Try Eureka