Method of measurement of nucleated red blood cells
a measurement method technology, applied in the field of nucleated red blood cell measurement, can solve the problems of complex fluorescence measurement, high detection cost, and difficult to differentiate nucleated red blood cell only based on electronic or optical properties
- Summary
- Abstract
- Description
- Claims
- Application Information
AI Technical Summary
Benefits of technology
Problems solved by technology
Method used
Image
Examples
example 1
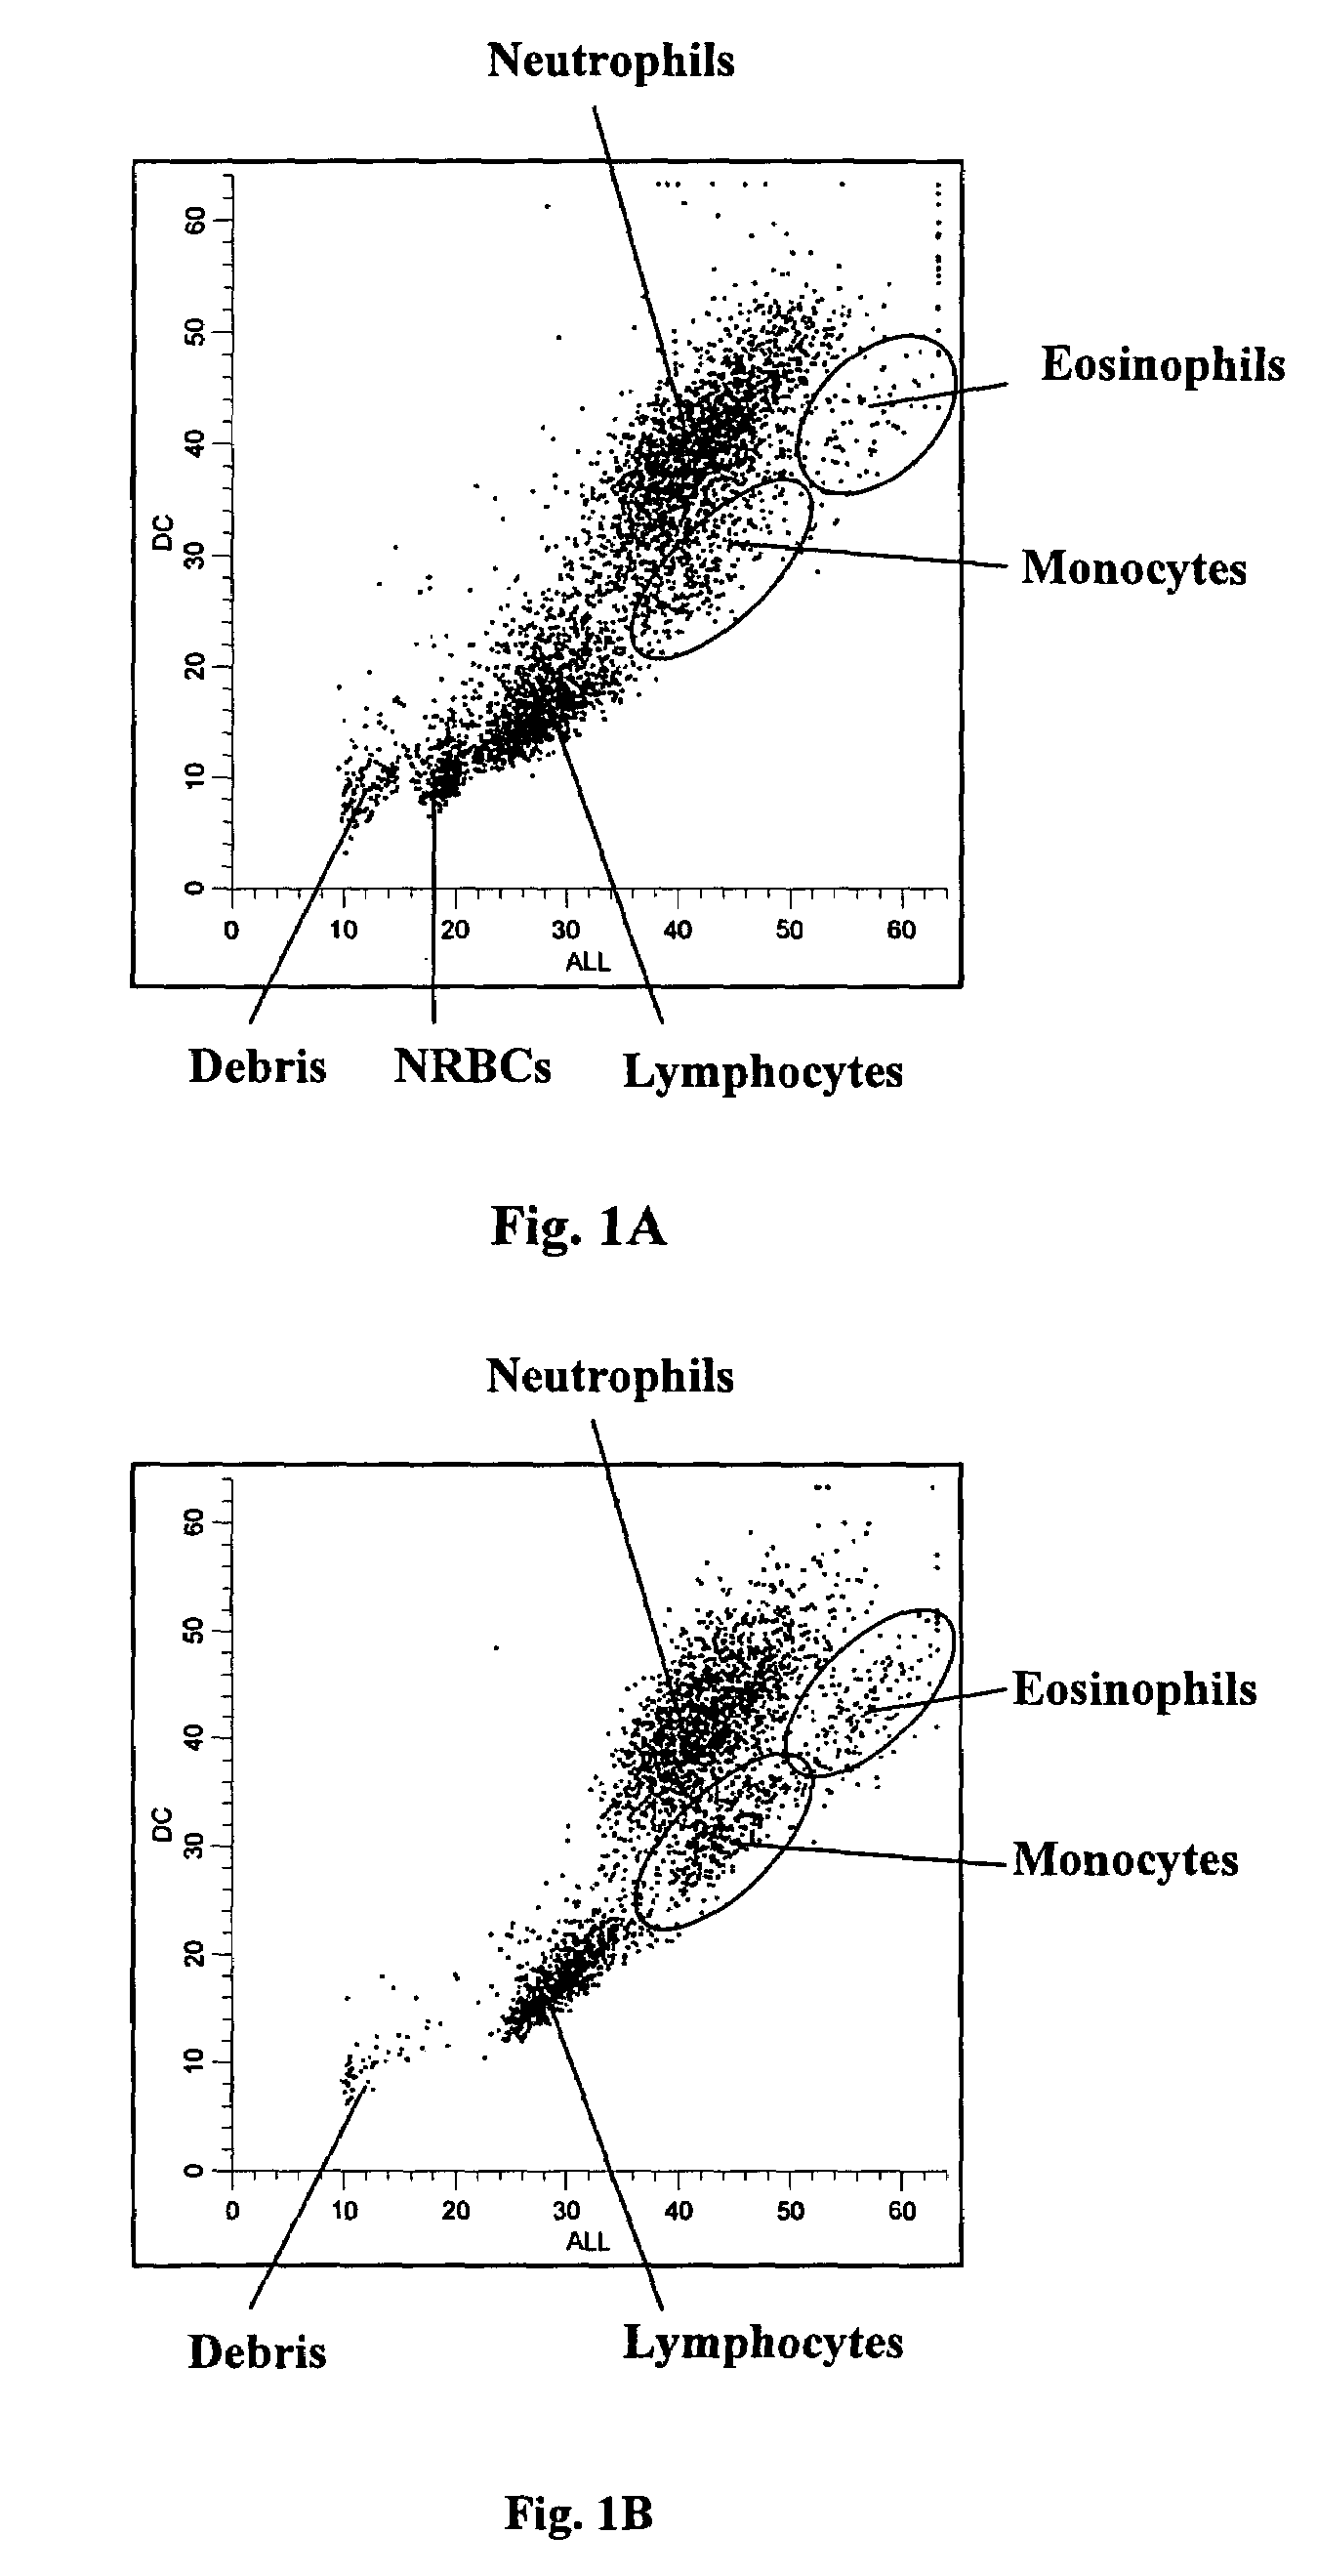
[0069]14 μL of an anticoagulated whole blood sample, also referred to as peripheral blood, was diluted by 614 μL of an isotonic blood diluent, Isoton® 3E (product of Beckman Coulter, Inc. Miami, Fla.), and mixed with 125 μL of a lytic reagent in a mixing chamber on an experimental hematology analyzer. About nine seconds after the addition of the lytic reagent the sample mixture was delivered to a flow cell with a sheath fluid, Isoton® 3E, for differential analysis of nucleated red blood cells. The lytic reagent was an aqueous solution containing active components for lysing red blood cells and analysis of nucleated red blood cells: 36 g / L dodecyltrimethylammonium chloride (50% solution), 3.6 g / L tetradecyl-trimethylammonium bromide, and has a pH about 4.
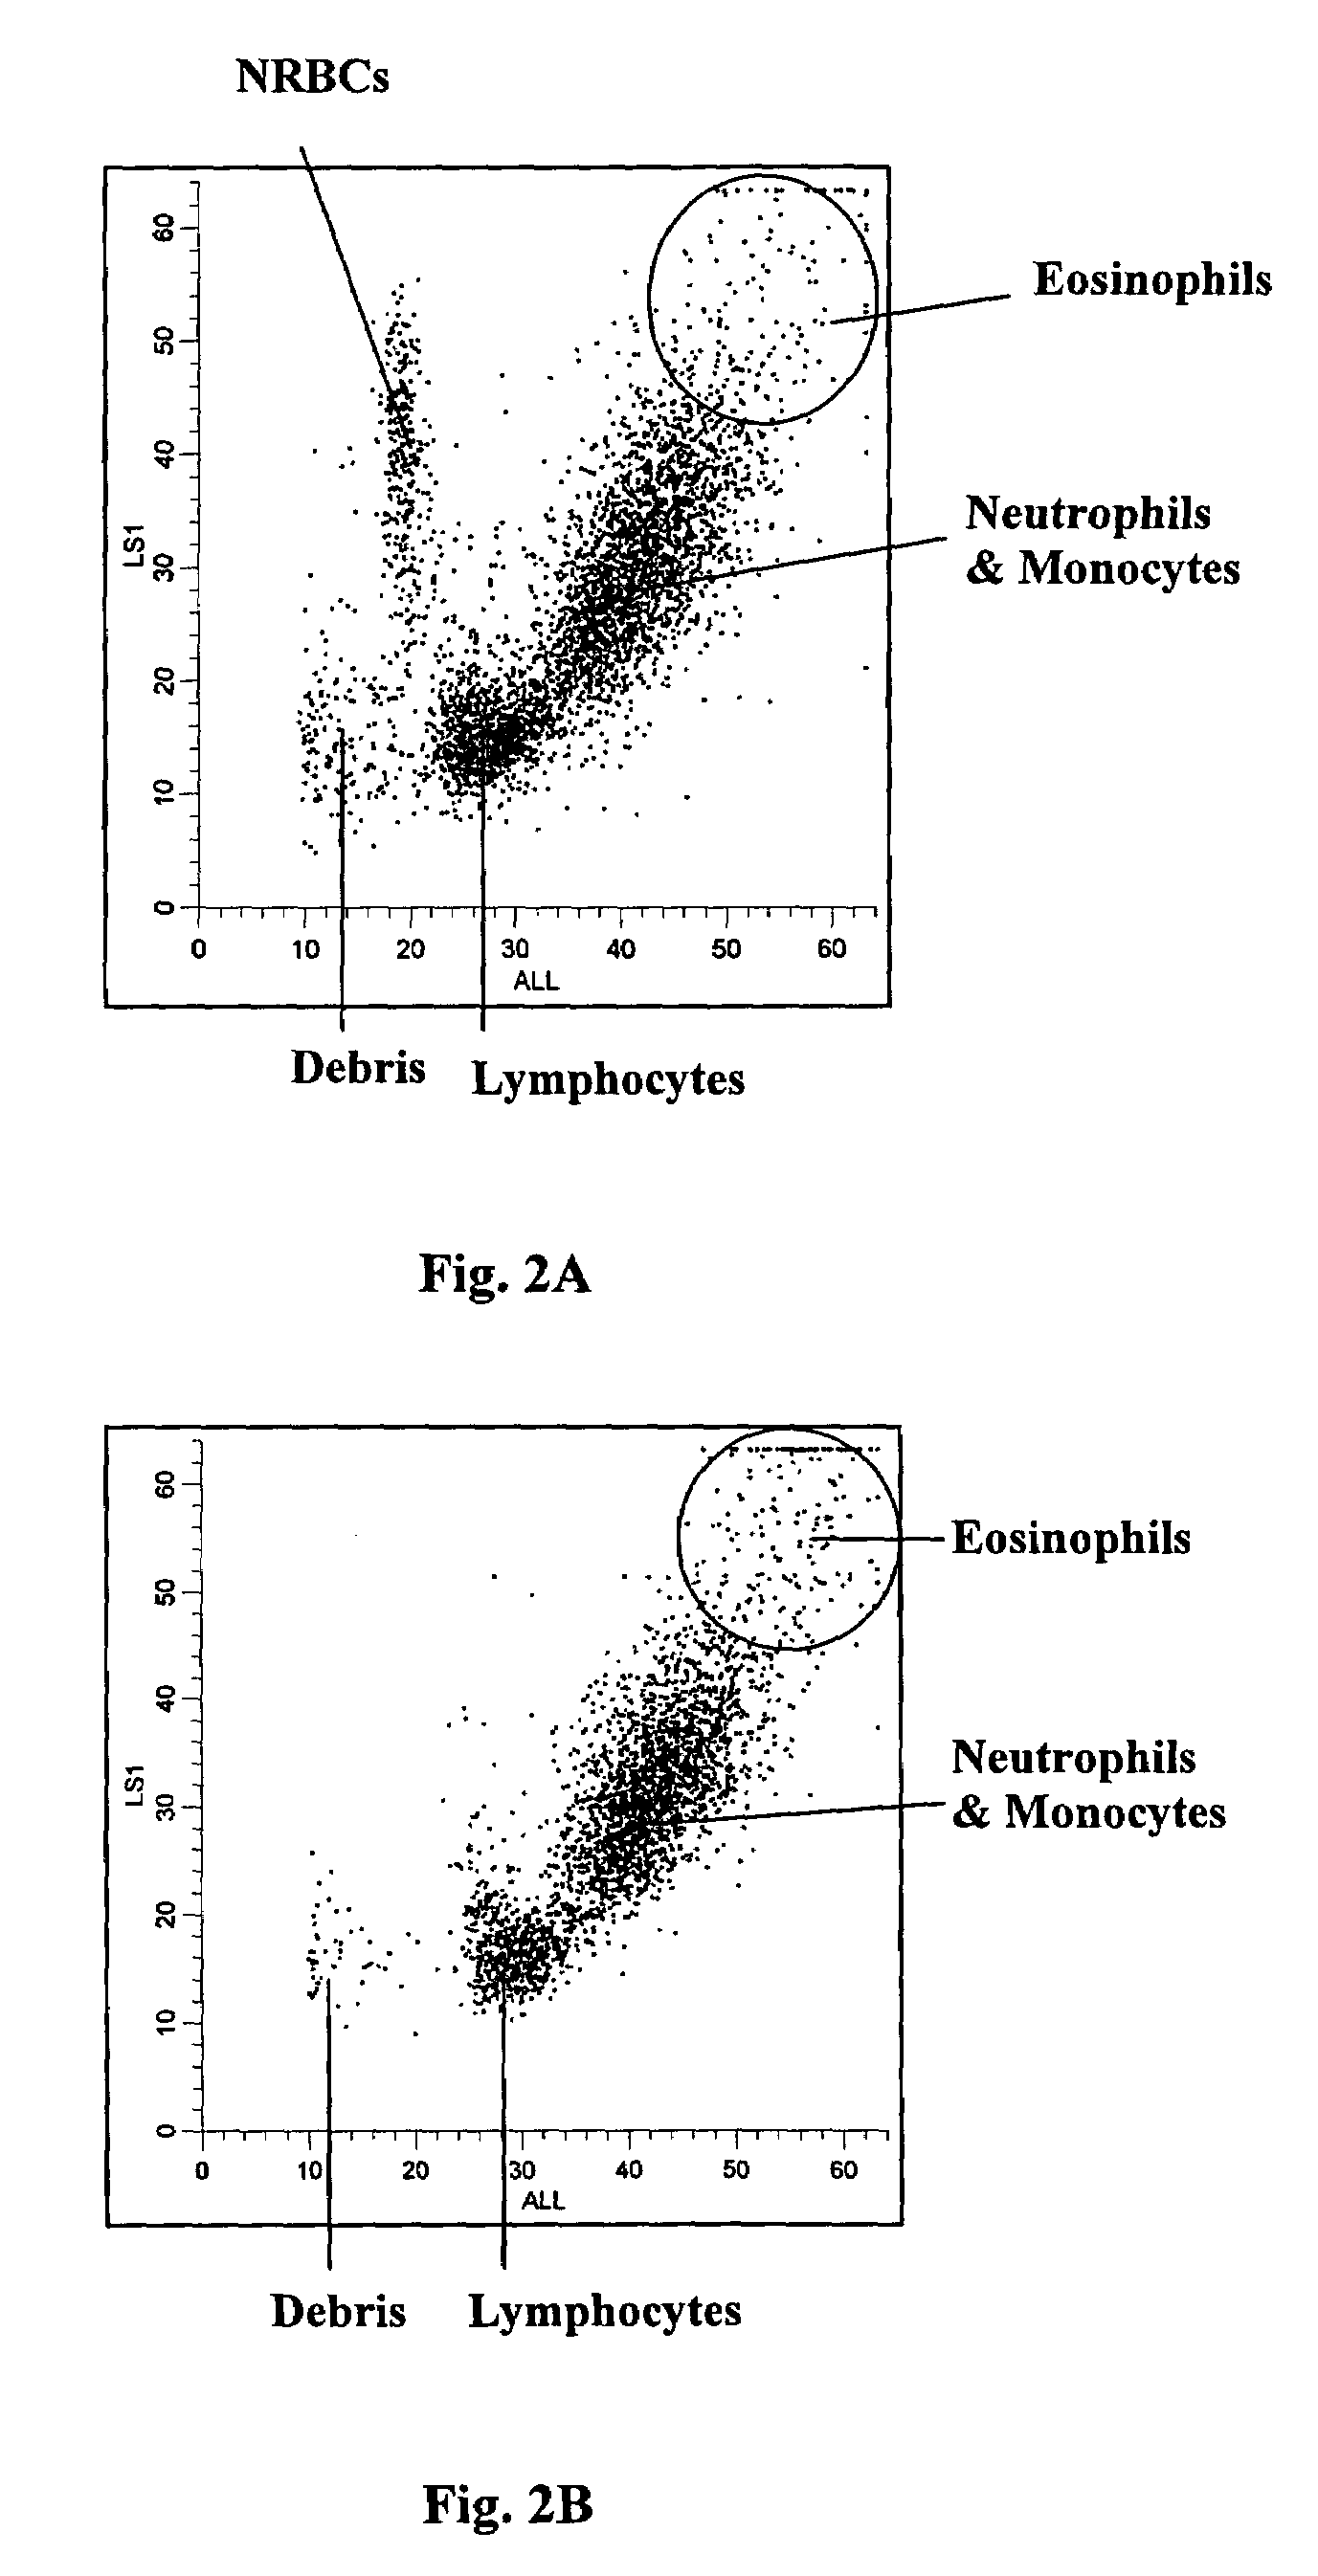
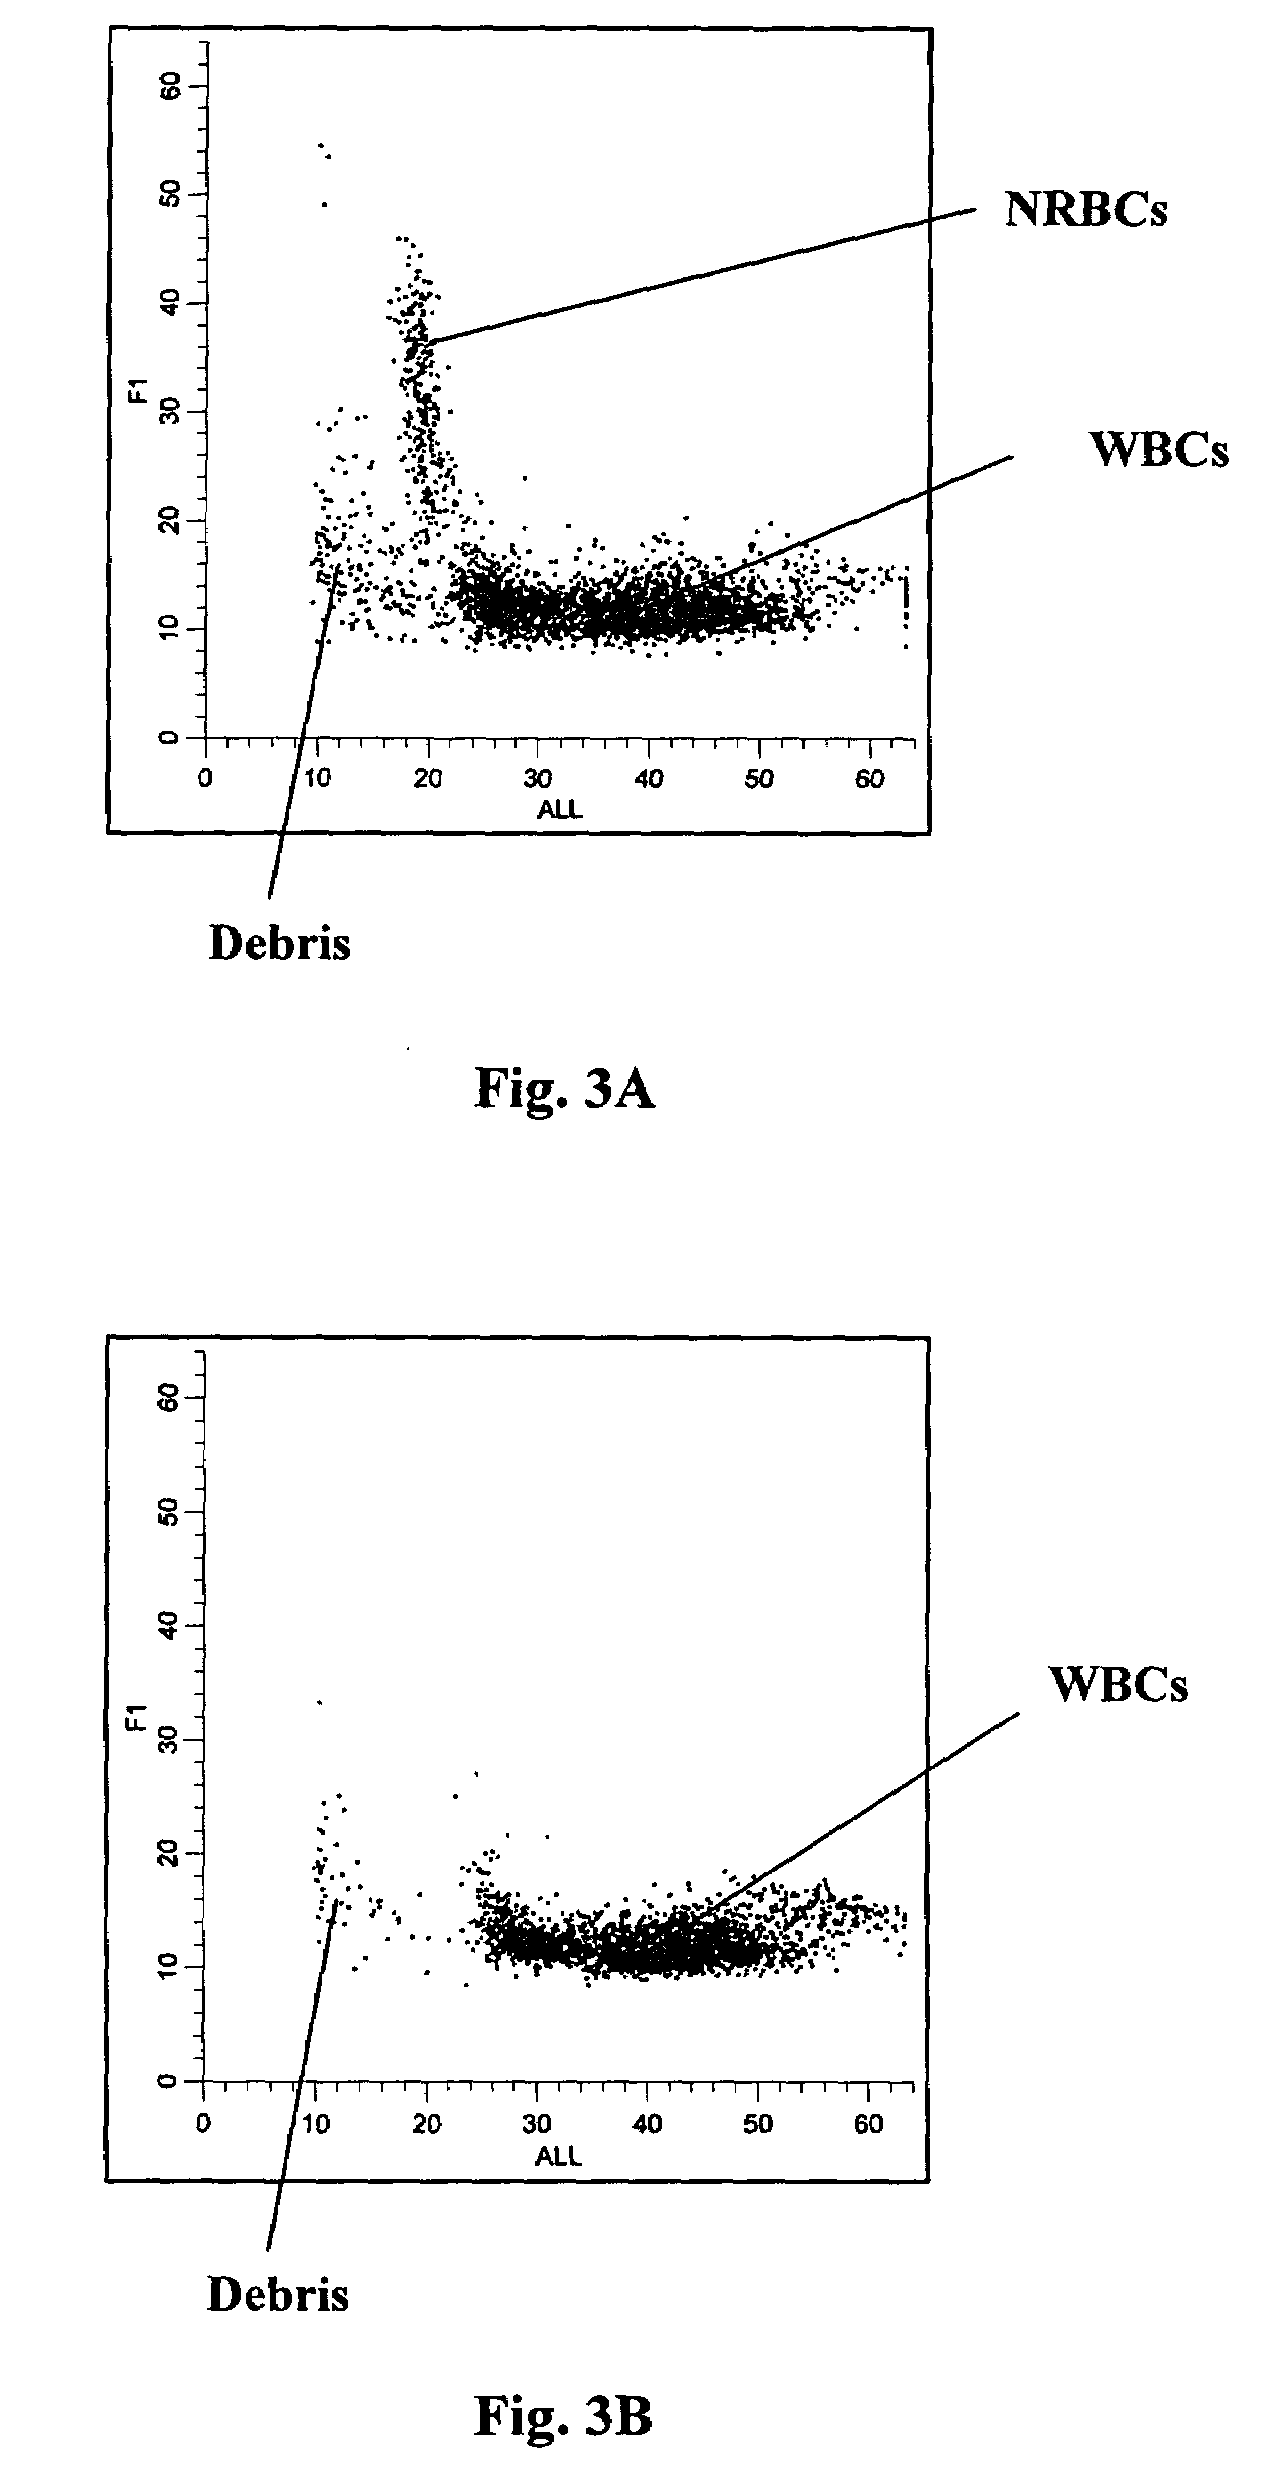
[0070]An experimental hematology analyzer was equipped with a detection system for detecting DC impedance, low angle light scatter and axial light loss signals generated when a cell in the sample mixture passed through the flow cell....
example 2
[0073]A fresh normal whole blood sample was analyzed using the same reagents and procedure described in Example 1. FIG. 1B shows an obtained DC vs. ALL scattergram of a normal blood sample. As shown, no cell population was present in the region where nucleated red blood cells reside.
[0074]Furthermore, as shown in FIGS. 1A and 1B the white blood cells were further differentiated into four subpopulations, i.e., lymphocytes, monocytes, neutrophils and eosinophils.
[0075]FIG. 2B shows an obtained LS1 vs. ALL scattergram of the same normal whole blood sample shown in FIG. 1B. Again, no cluster was present in the region where nucleated red blood cells reside.
[0076]Also, as shown in FIGS. 2A and 2B the white blood cells were further differentiated into three subpopulations, i.e., lymphocytes, a sum of monocytes and neutrophils, and eosinophils.
example 3
[0077]A clinical whole blood sample containing nucleated red blood cells and a fresh normal whole blood sample were analyzed using the process described in Example 1 on another experimental hematology analyzer which was equipped with a detection system equivalent to that described in Example 1, but the data was acquired with a 14-bit ADC resolution. The lytic reagent and the diluent used were Lyse S® 4 and Isoton® 4 (products of Beckman Coulter, Inc. Miami, Fla.).
[0078]FIGS. 5A thru 8B show the obtained scattergrams. As shown in FIGS. 5A, 6A, 7A and 8A, the nucleated red blood cells in the clinical sample clearly separate from white blood cells and from cell debris in DC vs. ALL, LS1 vs. ALL, F1 vs. ALL and F2 vs. ALL scattergrams, respectively. As shown in FIGS. 5B, 6B, 7B and 8B obtained from the normal blood sample, no cell population was present in the region where nucleated red blood cells reside. It is noted that the axis scales of the scattergrams in FIGS. 5A thru 8B are diff...
PUM
| Property | Measurement | Unit |
|---|---|---|
| angle | aaaaa | aaaaa |
| angle | aaaaa | aaaaa |
| angles | aaaaa | aaaaa |
Abstract
Description
Claims
Application Information
 - R&D
- Intellectual Property
- Life Sciences
- Materials
- Tech Scout
- Unparalleled Data Quality
- Higher Quality Content
- 60% Fewer Hallucinations
Browse by: Latest US Patents, China's latest patents, Technical Efficacy Thesaurus, Application Domain, Technology Topic, Popular Technical Reports.
© 2025 PatSnap. All rights reserved.Legal|Privacy policy|Modern Slavery Act Transparency Statement|Sitemap|About US| Contact US: help@patsnap.com


