Analysis of multi-dimensional data presents various problems.
For example, when using
visualization to analyze such data, the viewing of multi-dimensional data as combinations of lower dimensional views (e.g., histograms and bivariate displays) results in the loss of information in an uncontrollable manner.
Such loss of information frequently leads to loss of the pertinent information necessary to accomplish desired goals, e.g., isolation of
cell subpopulations when analyzing
flow cytometry data, loss of resolution in imaging applications, etc.
For example, valuable information is lost when bivariate displays are reduced to a pair of uncorrelated histograms (e.g., representing data whose correlations between parameters are unknown).
For example, when a 3D object (or data object) is projected down as a projection “shadow” onto a 2D plane, the shape of this projection shadow depends on the
projection angle and may grossly distort the actual shape of the 3D object (or data object).
While less immediately evident, the reduction of higher dimensional
data space to 3D views, as is performed with various 3D renderings, is subject to the same problem, namely loss of information about the shape of the
data objects in higher dimensional
data space.
Hence, while some reduction of dimensionality may be required to produce human visualizable 2-D and 3-D displays, the conventional process of displaying all possible combinations of bivariate displays only provides one human visualizable viewpoint and is subject to distortions which range from slight to major distortions, depending on how the data is projected down onto a lower dimensional surface (e.g., plane).
However, such
data analysis frequently requires human
visualization of multi-dimensional data in order to determine the appropriate number and / or location of clusters which can be difficult even with the aid of a
multivariate statistical methods such as DFA and PCA.
Such procedures when dealing with multi-dimensional data are very computationally intensive.
For example, it is computationally challenging to cluster multi-parameter flow cytometric data including more than about 50,000 cells.
As such, this makes
cluster analysis difficult or even impossible to perform on
rare cell subpopulations (i.e., as used herein rare subpopulations are present at a percentage in the range of about 1.0% to 0.0001%) which require data sets containing many millions of cells (e.g., data points) to obtain enough
rare cell data.
For example, the general problem of
cell sorting is to identify
cell subpopulations of interest and to isolate them.
However, the method suffers from various shortcomings.
Higher dimensional data is projected down onto these 2-D displays, losing valuable information about the
cell subpopulations that was available, but not readily visualizable in the original multi-dimensional
data space.
Second, the choice of regions and sort gates is usually arbitrary and subject to individual experimenter expertise and prejudices.
Although cluster analysis methods have been developed over the years to perform this grouping of cells into
cell subpopulations, a more complex problem of comparing clusters between different data files is evident.
Since cluster positions can vary slightly, which is a common problem encountered in this situation, measures of similarity or dissimilarity need to take such variation into account.
Due to the scarcity of data points in multi-dimensional data space, a much more complex analysis than a simple difference spectrum is required for comparison of the multi-dimensional data sets.
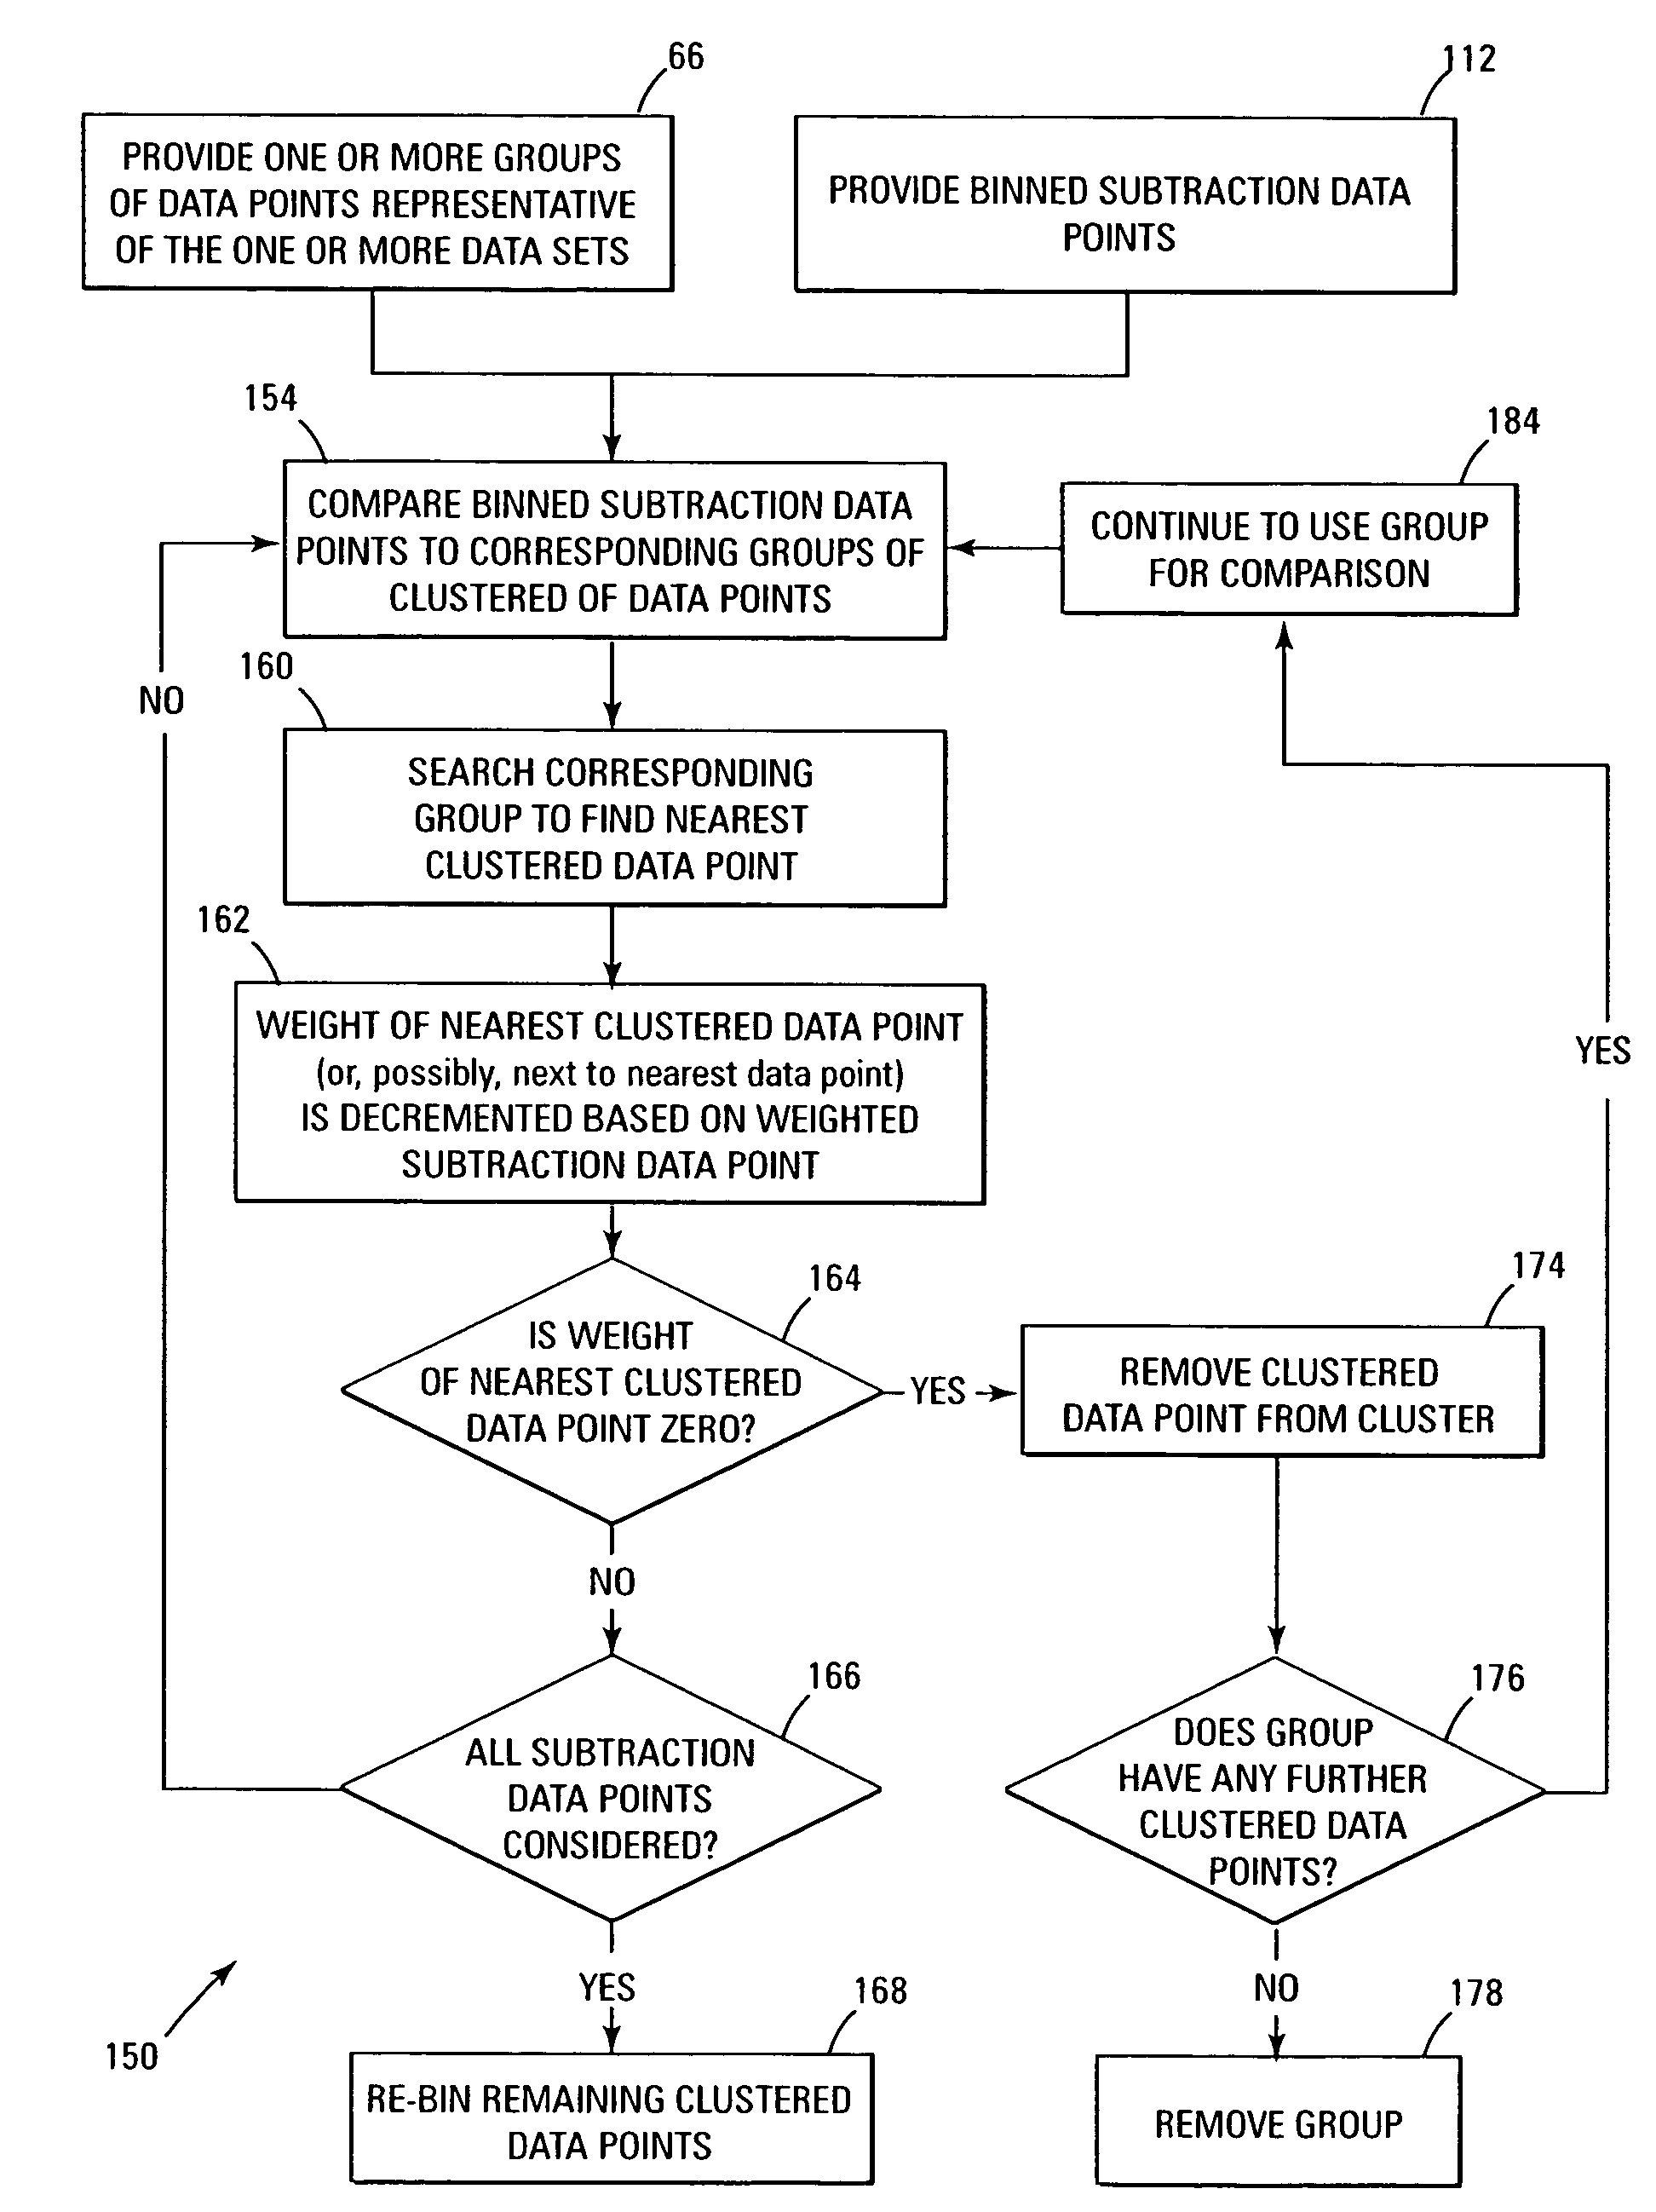
In other words, in general, an illustrative problem when dealing with flow cytometric data is to take two data sets, the first with cell
population “A” and the second with the populations “A and B,” analyze such data sets, and then produce the
data set with
population “B” only.
However, extension of this method from
single parameter histogram data to multi-dimensional data is complicated for various reasons.
Such complications arise because the data is both multi-dimensional and
high resolution.
Attempting to deal with the data as a multi-dimensional array leads to severe storage and computational problems.
Typically, when dealing with flow cytometric data, this tyranny of dimensionality has been addressed by reducing the resolution of the data.
However, for higher dimensional
data display / analysis, a continued reduction in dimensionality will start squashing the data into such large channel bins that all resolution of different subpopulations is lost; effectively merging all of the data into a few meaningless clusters of data.
Thus,
array element subtraction of the multi-dimensional data sets becomes problematic in terms of data storage and
data processing cycle times.
In summary, although the subtraction problem has been addressed in simple bin to identical bin subtraction of
histogram data, applying similar subtraction techniques to multi-dimensional data quickly becomes daunting due to both the exponential scaling of multi-dimensional data by the number of dimensions, and also due to the tyranny of dimensionality as described above whereby the data points become sparse and unique in multi-dimensional data space, such that no two points in similar clusters in two or more data sets are numerically identical.
As described above, although the subtraction problem has been addressed in some multi-dimensional applications by reducing the resolution of each
data set, reduction of the data array to a computationally manageable size sacrifices resolution to the point where in a multi-dimensional data experiment, the data is merged into few and meaningless clusters and the ability to detect a subpopulation of cells is lost.
Further, conventional clustering algorithms are computationally intensive and thus do not solve the problem of retaining resolution while reducing computational intensity, e.g., a problem readily apparent in analysis of multi-dimensional flow cytometric data.
In addition, because the current methods are computationally intensive, they are prevented from being employed on lower performance computer platforms.
Conventional clustering algorithms find it difficult to compute distances with mixed data types with different scaling factors.

