Retrospective correction of inhomogeneities in radiographs

a radiograph and inhomogeneity technology, applied in image data processing, duplicating/marking methods, printing, etc., can solve the problems of collimation areas unsuitable for estimation of correction values, and the dynamic range of irradiation has been reduced

Inactive Publication Date: 2006-09-19
AGFA HEALTHCARE NV
View PDF9 Cites 6 Cited by
  • Summary
  • Abstract
  • Description
  • Claims
  • Application Information

AI Technical Summary

Benefits of technology

[0028]In a third embodiment of the method of the present invention an information theoretic model of the image comprising at least direct exposure areas and diagnostic areas is generated. The model is based on Shannon-Wiener entropy increasing when additional intensity value entries are added to the image intensity distribution. The digital image representation is subjected to image segmentation in order to extract data representing an estimation of the direct exposure areas and the entropy in said model is extracted based on of data pertaining to these areas. Next, a bias field is generated and the entire image is corrected by means of the bias field. The result of the previous step is evaluated relative to a stopping criterion and the method is repeated until said stopping criterion is met. A stopping criterion is e.g. met when the entropy is minimal and no significant changes occur in it.
[0029]The fourth embodiment is a more general case of the second embodiment. In this fourth embodiment the method steps of the second embodiment are applied separately to each of a number of image region classes jointly constituting the intensity histogram of the radiation image.
[0030]In all of the aforementioned embodiments, the number of iterations may be restricted to one when less precision is needed and hence the stopping criterion need not be evaluated.

Problems solved by technology

Because of substantial attenuation of the X-ray beam when passing through the collimator blades, the dynamic range of the irradiation has been reduced to an extent so as to make these collimation areas unsuitable for estimation of the correction values.

Method used


Image

  • Retrospective correction of inhomogeneities in radiographs
  • Retrospective correction of inhomogeneities in radiographs
  • Retrospective correction of inhomogeneities in radiographs

Examples


first embodiment

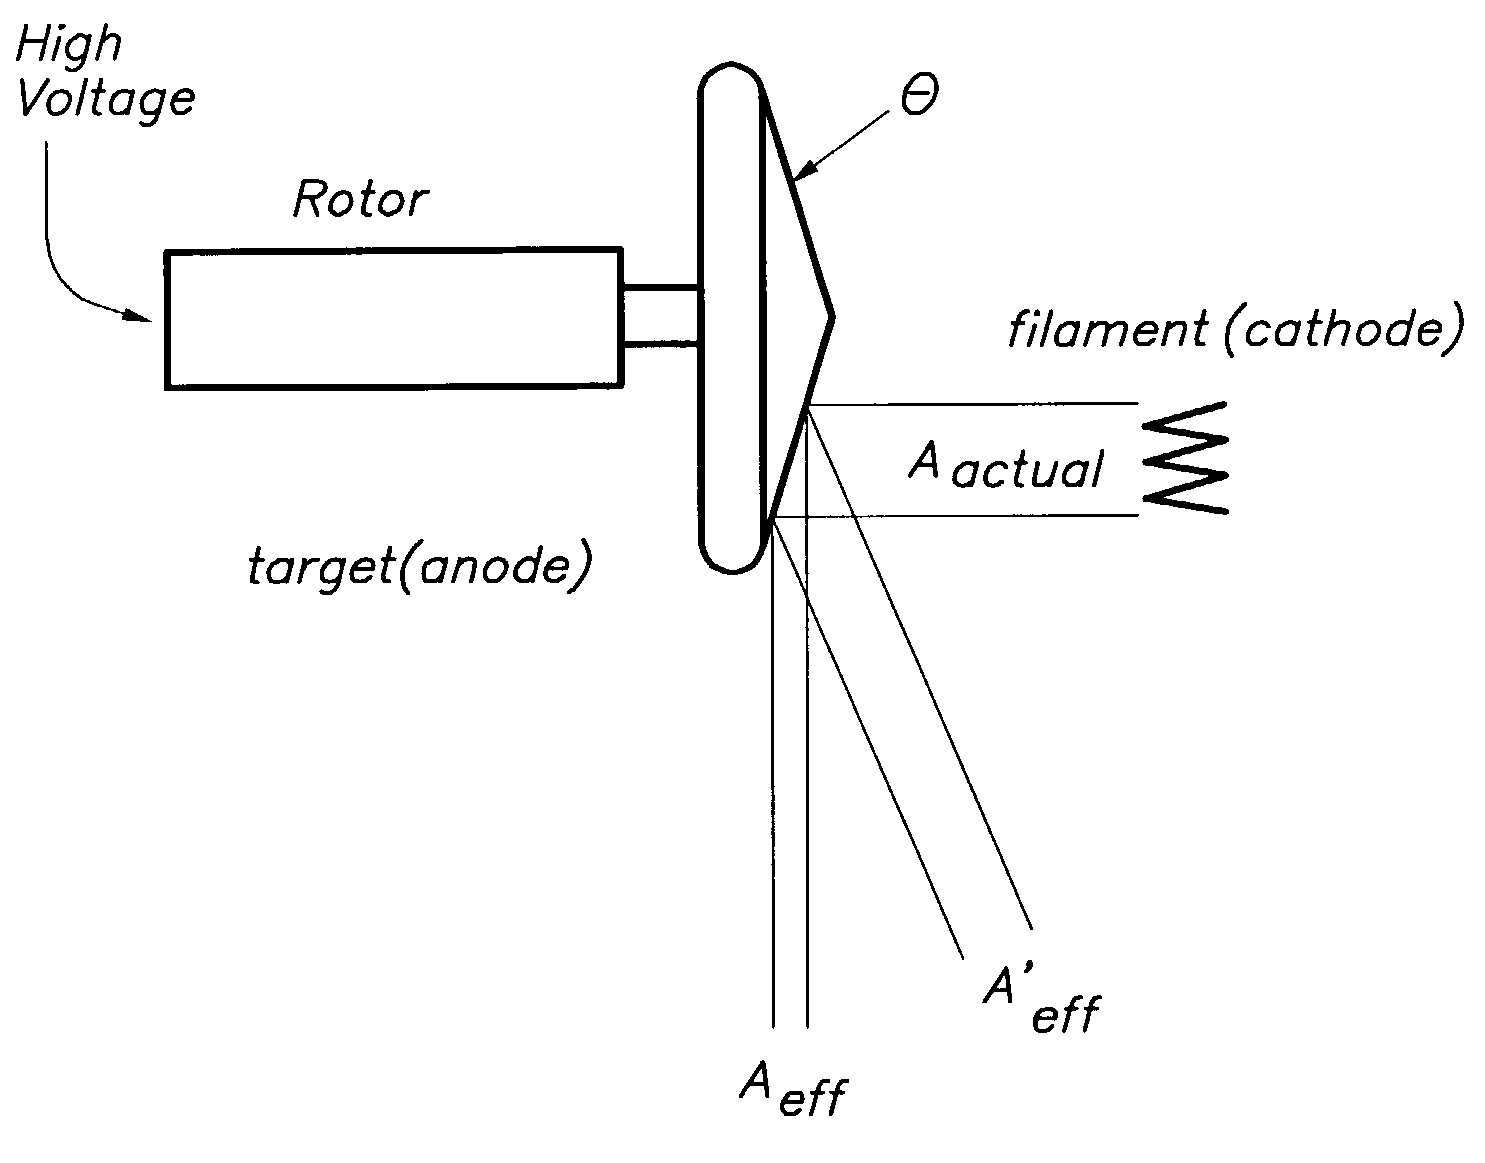
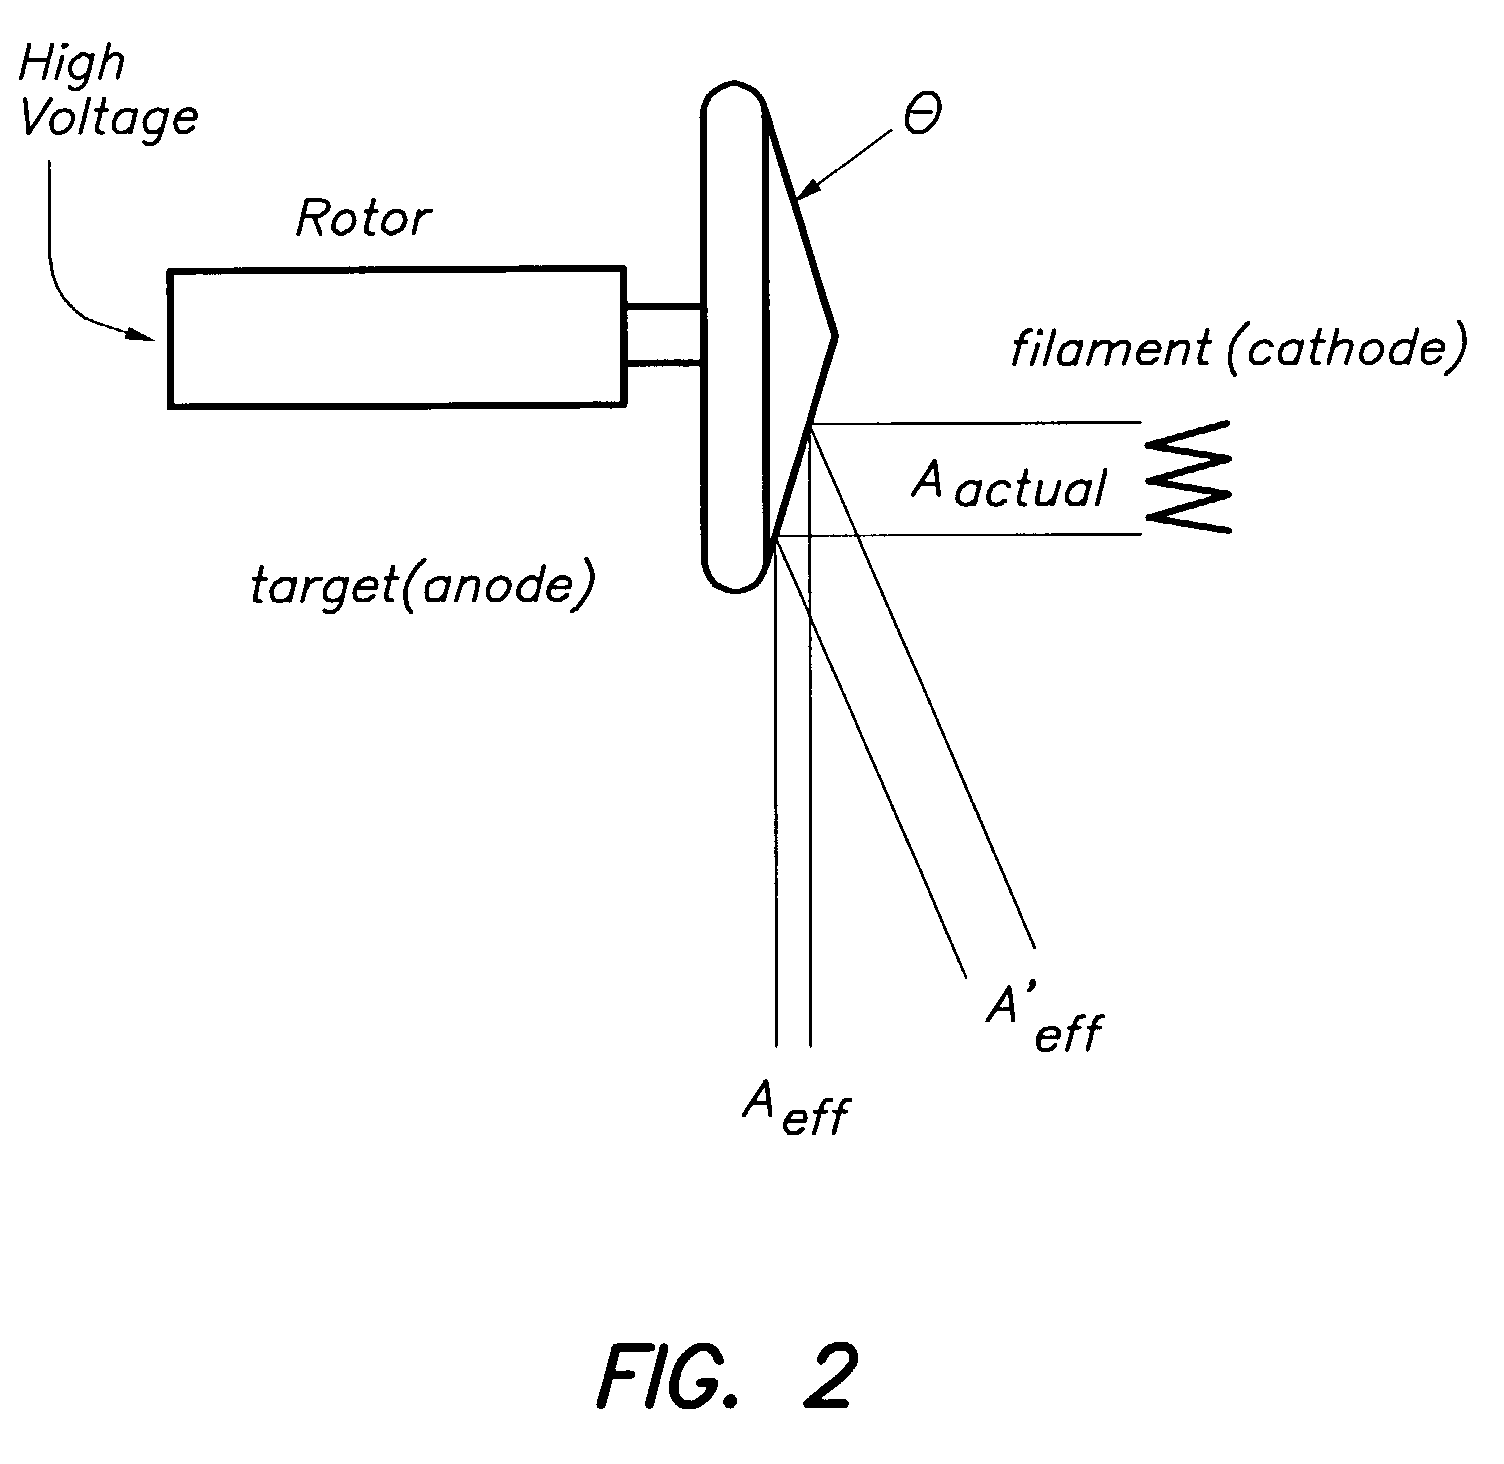
[0035]A mathematical model for the Heel effect can be derived from the simplified one-dimensional model of the anode and beam geometry depicted in FIG. 4. In the coordinate system (p,z), with p along the anode-cathode axis and z along the vertical direction, the X-rays can be taught off to originate within the anode at point ω(0,0), at a distance Dave from the anode surface S. Consider the ray R at an angle φ from the vertical within the plane (ω,S) that hits the recording device at point (p,Dis) with Dis the distance between the X-ray source and the recording device and

[0036]tan⁢⁢ϕ=pDi⁢⁢s.

The distance r traveled by R through the anode is given by

r=|ξ−ω|=√{square root over (pR2+zR2)}  (1)

[0037]with ξ(pR,zR) the intersection of R with S which can be found by solving the system of equations:

S: pR=Dave−tan θ.zR

R: pP=tan φ.zR  (2)

[0038]Hence,

[0039]r⁡(p)=Da⁢⁢v⁢⁢e⁢cos⁢⁢θsin⁡(ϕ+θ)=Da⁢⁢v⁢⁢e⁢1+(pDi⁢⁢s)2tan⁢⁢θ+pDi⁢⁢s(3)

[0040]The radiation received on the recording device is

M(p)=Io.e−μ.r(p)  (...

second and third embodiment

[0059]Image Formation

[0060]In ideal circumstances, the image formation process of diagnostic digital X-ray images is usually well described by a multiplicative model yielding an intensity-uniform image U(x,y):

U(x,y)=I.O(x,y)[0061]where O(x,y) represents the object in the image. In diagnostic X-ray images, the most important contributing process of the object is the linear attenuation of the X-rays by the bone and soft tissue

[0062]O⁡(x,y)=ⅇ-∫∞ζ⁢μ⁡(r)⁢ⅆr

[0063]μ is the linear attenuation coefficient along the path between the origination X-ray at position a and the recording device ζ. However, nonuniform illumination I=I(x,y), uneven sensitivity of the recording device and inhomogeneous sensitivity of the phosphors for readout, introduce unwanted intensity modulations in the acquired image N(x,y) described by function f

N(x,y)=fx,y,U(U(x,y))  (10)

[0064]In the second and third embodiment the Heel effect is again examined as a very important source of nonuniform illumination. Reference is...

fourth embodiment

[0127]In a fourth embodiment according to the present invention, a statistical mixture model of the image is generated based on a plurality of K image regions.

[0128]Each of these regions or classes may physically correspond to e.g. bone, soft tissue and direct exposure area.

[0129]In the assumption of a normal mixture model, each class is represented by three unknown parameters: the proportion πk of image pixels, the mean value μk and the variance σk2.

[0130]The set ψ collectively comprising all unknown parameters becomes:

ψ={π1, . . . ,πK,μ1, . . . ,μK,σ12, . . . ,σK2}

[0131]The subset of parameters pertaining to class k is denoted as

ψk={πk,μk,σk2}

[0132]The image intensity histogram, denoting the probability distribution that a pixel i has intensity yi is therefore a Gaussian mixture model

[0133]f⁡(yi❘ψ)=∑k=1K⁢πk⁢fk⁡(yi❘ψk)⁢⁢=∑k=1⁢K⁢⁢πk⁢12⁢πσk2⁢exp(-(yi-μk)22⁢σk2)⁢⁢i=1,…⁢,N

The Basic EM Algorithm

[0134]The classical analytical method to estimate the parameter ψ is to maximise the log-like...


PUM

PropertyMeasurementUnit
inner anglesaaaaaaaaaa
direct exposure areasaaaaaaaaaa

Abstract

Several methods for retrospective correction of intensity inhomogeneites in digital diagnostic radiation images are presented. The methods are based on the correction of a digital image representation by means of a bias field. The bias field is deduced from the digital image representation of the diagnostic radiation image.

Description

FIELD OF THE INVENTION[0001]The present invention relates to a method for correcting inhomogeneities in a digital radiation image which are inherent to the use of a radiation source, a radiation detector or a radiation image read-out apparatus or the like.BACKGROUND OF THE INVENTION[0002]Digital radiography offers the possibility for computer aided diagnosis and quantitative analysis using image processing techniques such as segmentation, classification and contrast enhancement. However, computer-based image interpretation may be hindered by the presence of the non-uniformities in radiation exposure that are inherent to the image formation.[0003]In the field of X-ray exposure these non-uniformities can be largely attributed to the Heel effect, nevertheless other sources of inhomogeneities exist such as recording member non-uniformities or read-out inhomogeneities.[0004]Although the intensity inhomogeneities induced by all these factors are smoothly varying as a function of location ...

Claims


Application Information

Patent Timeline
Patent Type & Authority Patents(United States)
IPC IPC(8): G06K9/00G06T5/00G06T5/40
CPCG06T5/40G06T7/0083G06T5/007G06T2207/10116G06T2207/20144G06T2207/20156G06T2207/30004G06T2207/20061G06T7/12G06T7/194
Inventor DEWAELE, PIETBEHIELS, GERT
Owner AGFA HEALTHCARE NV
Why Eureka
Try Eureka