Method for identifying components of a mixture via spectral analysis
a technology of spectral analysis and components, applied in chemical methods analysis, instruments, food testing, etc., can solve the problems of large number of possible mixtures even of a limited multi-component system, large number of possible mixtures, and general inability to identify the components of any given mixture. , to achieve the effect of superior detection, identification, reproducibility and reliability
- Summary
- Abstract
- Description
- Claims
- Application Information
AI Technical Summary
Benefits of technology
Problems solved by technology
Method used
Image
Examples
example 1
Calculations
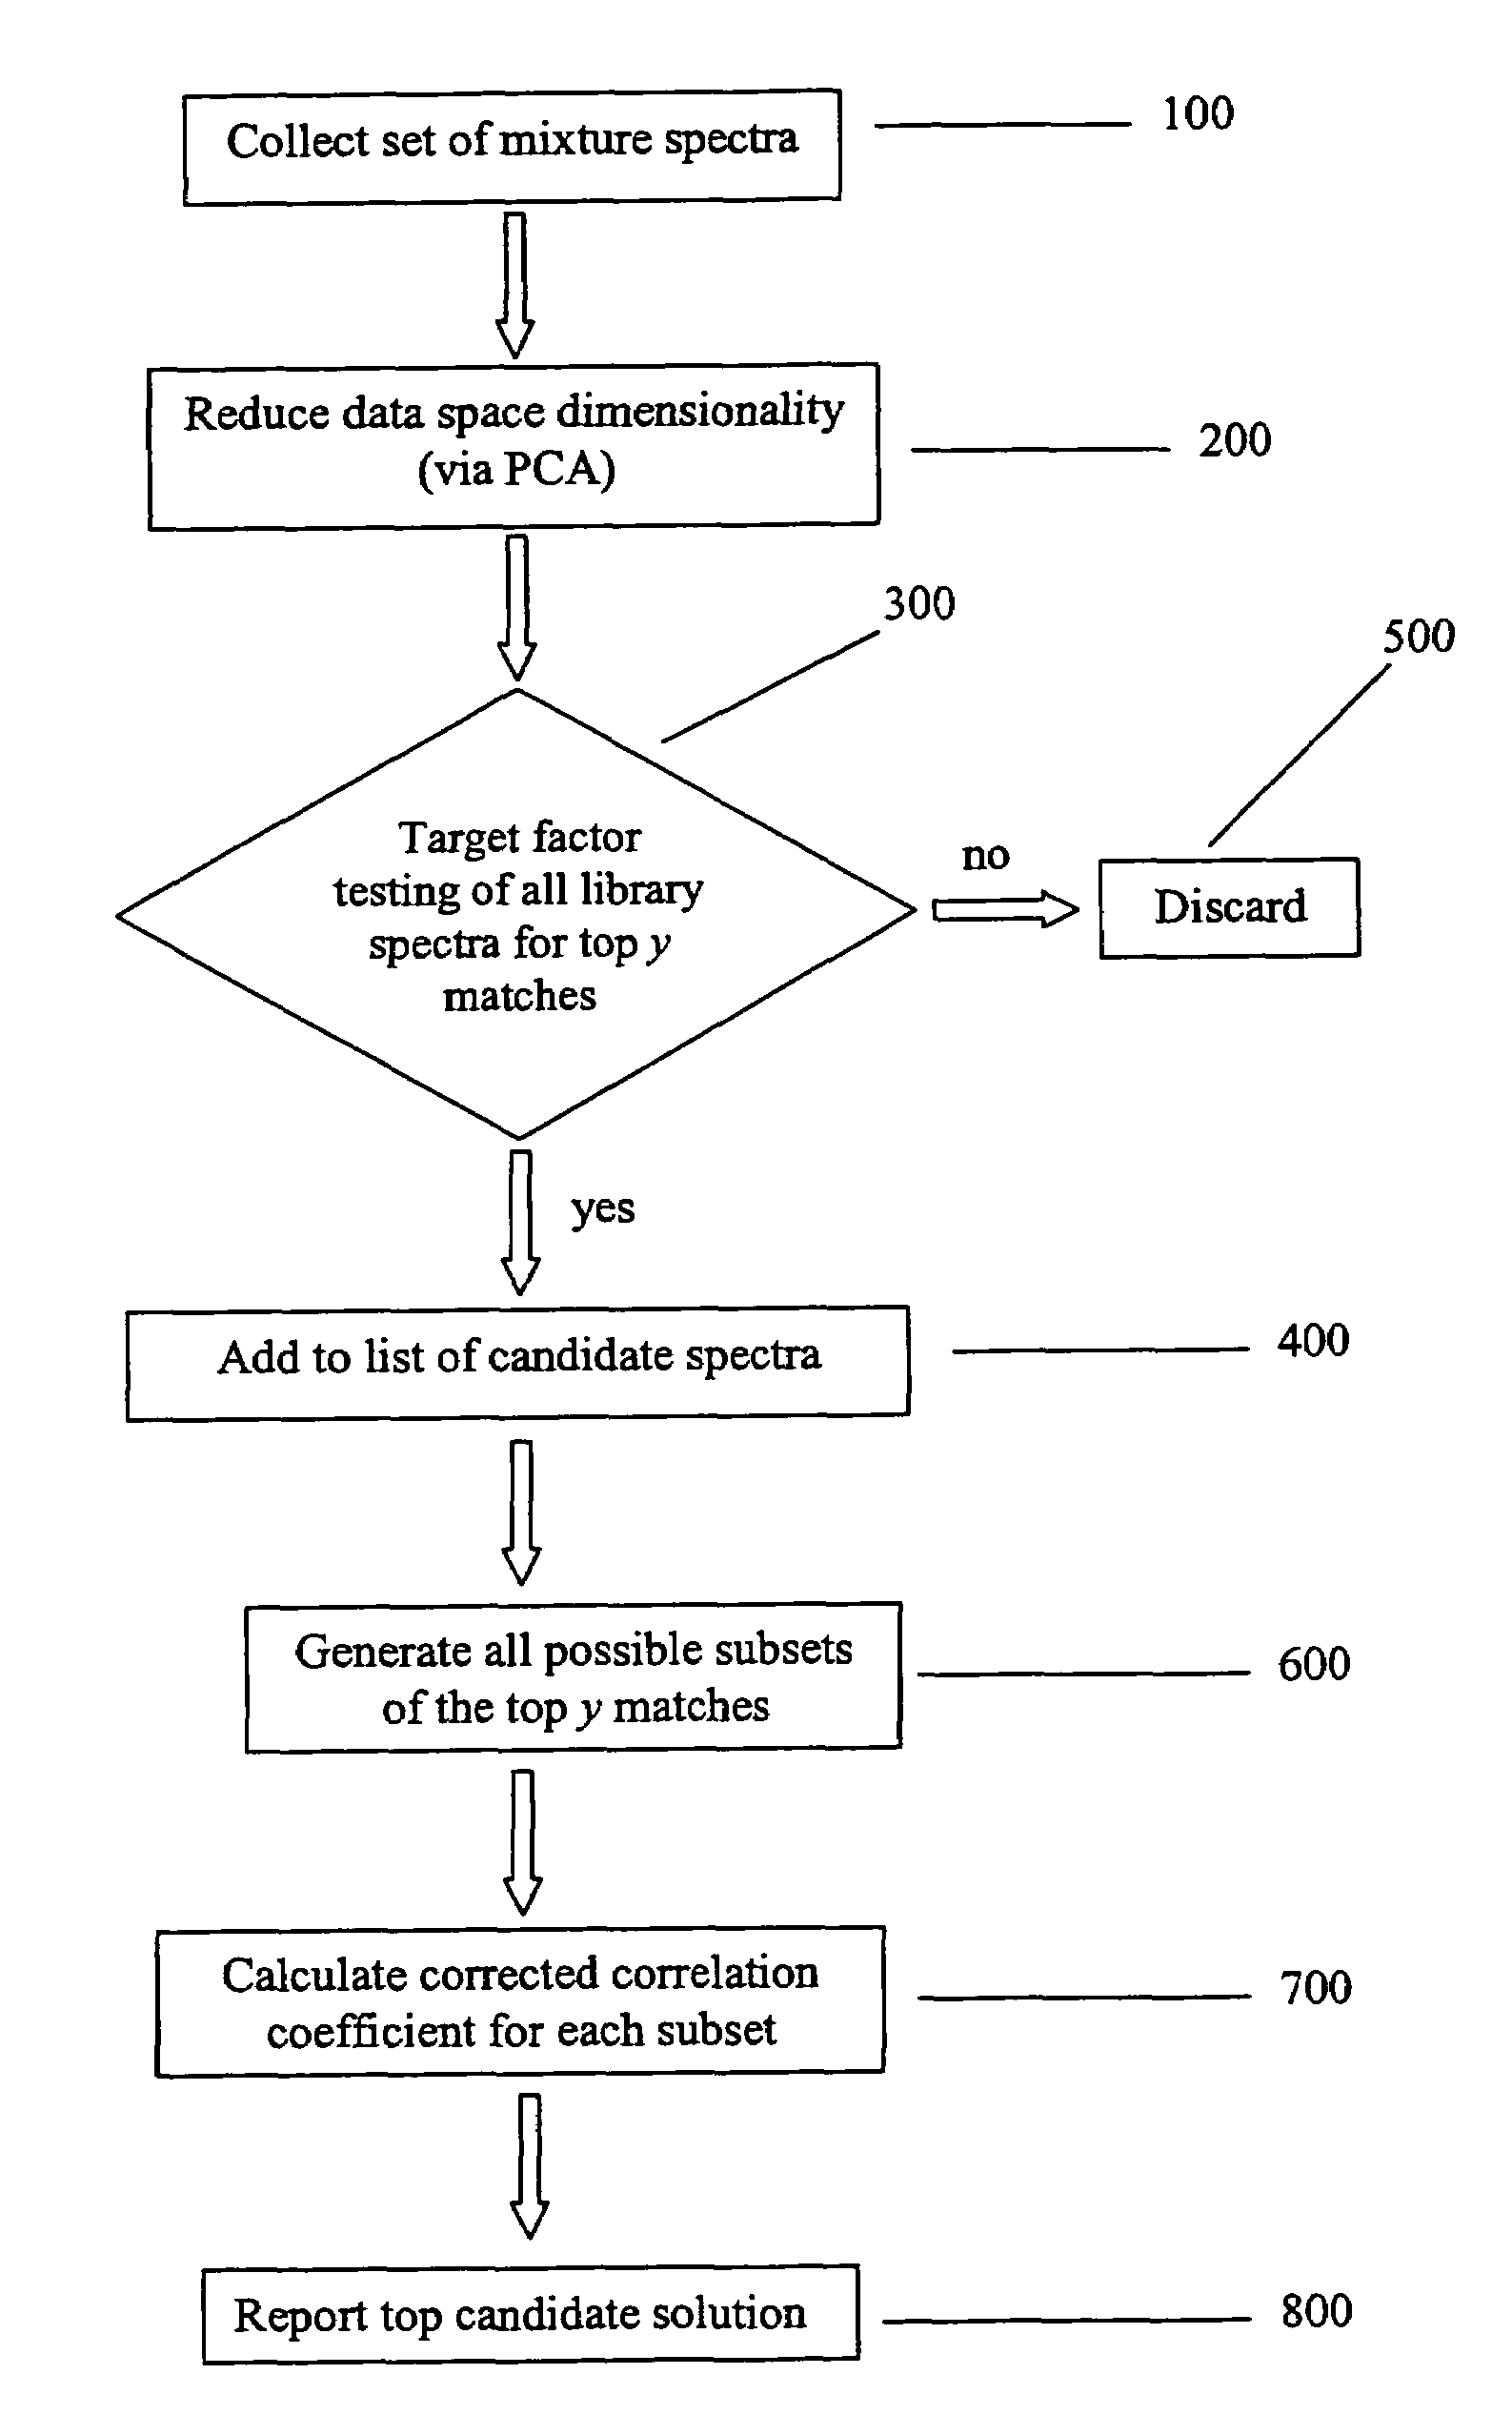
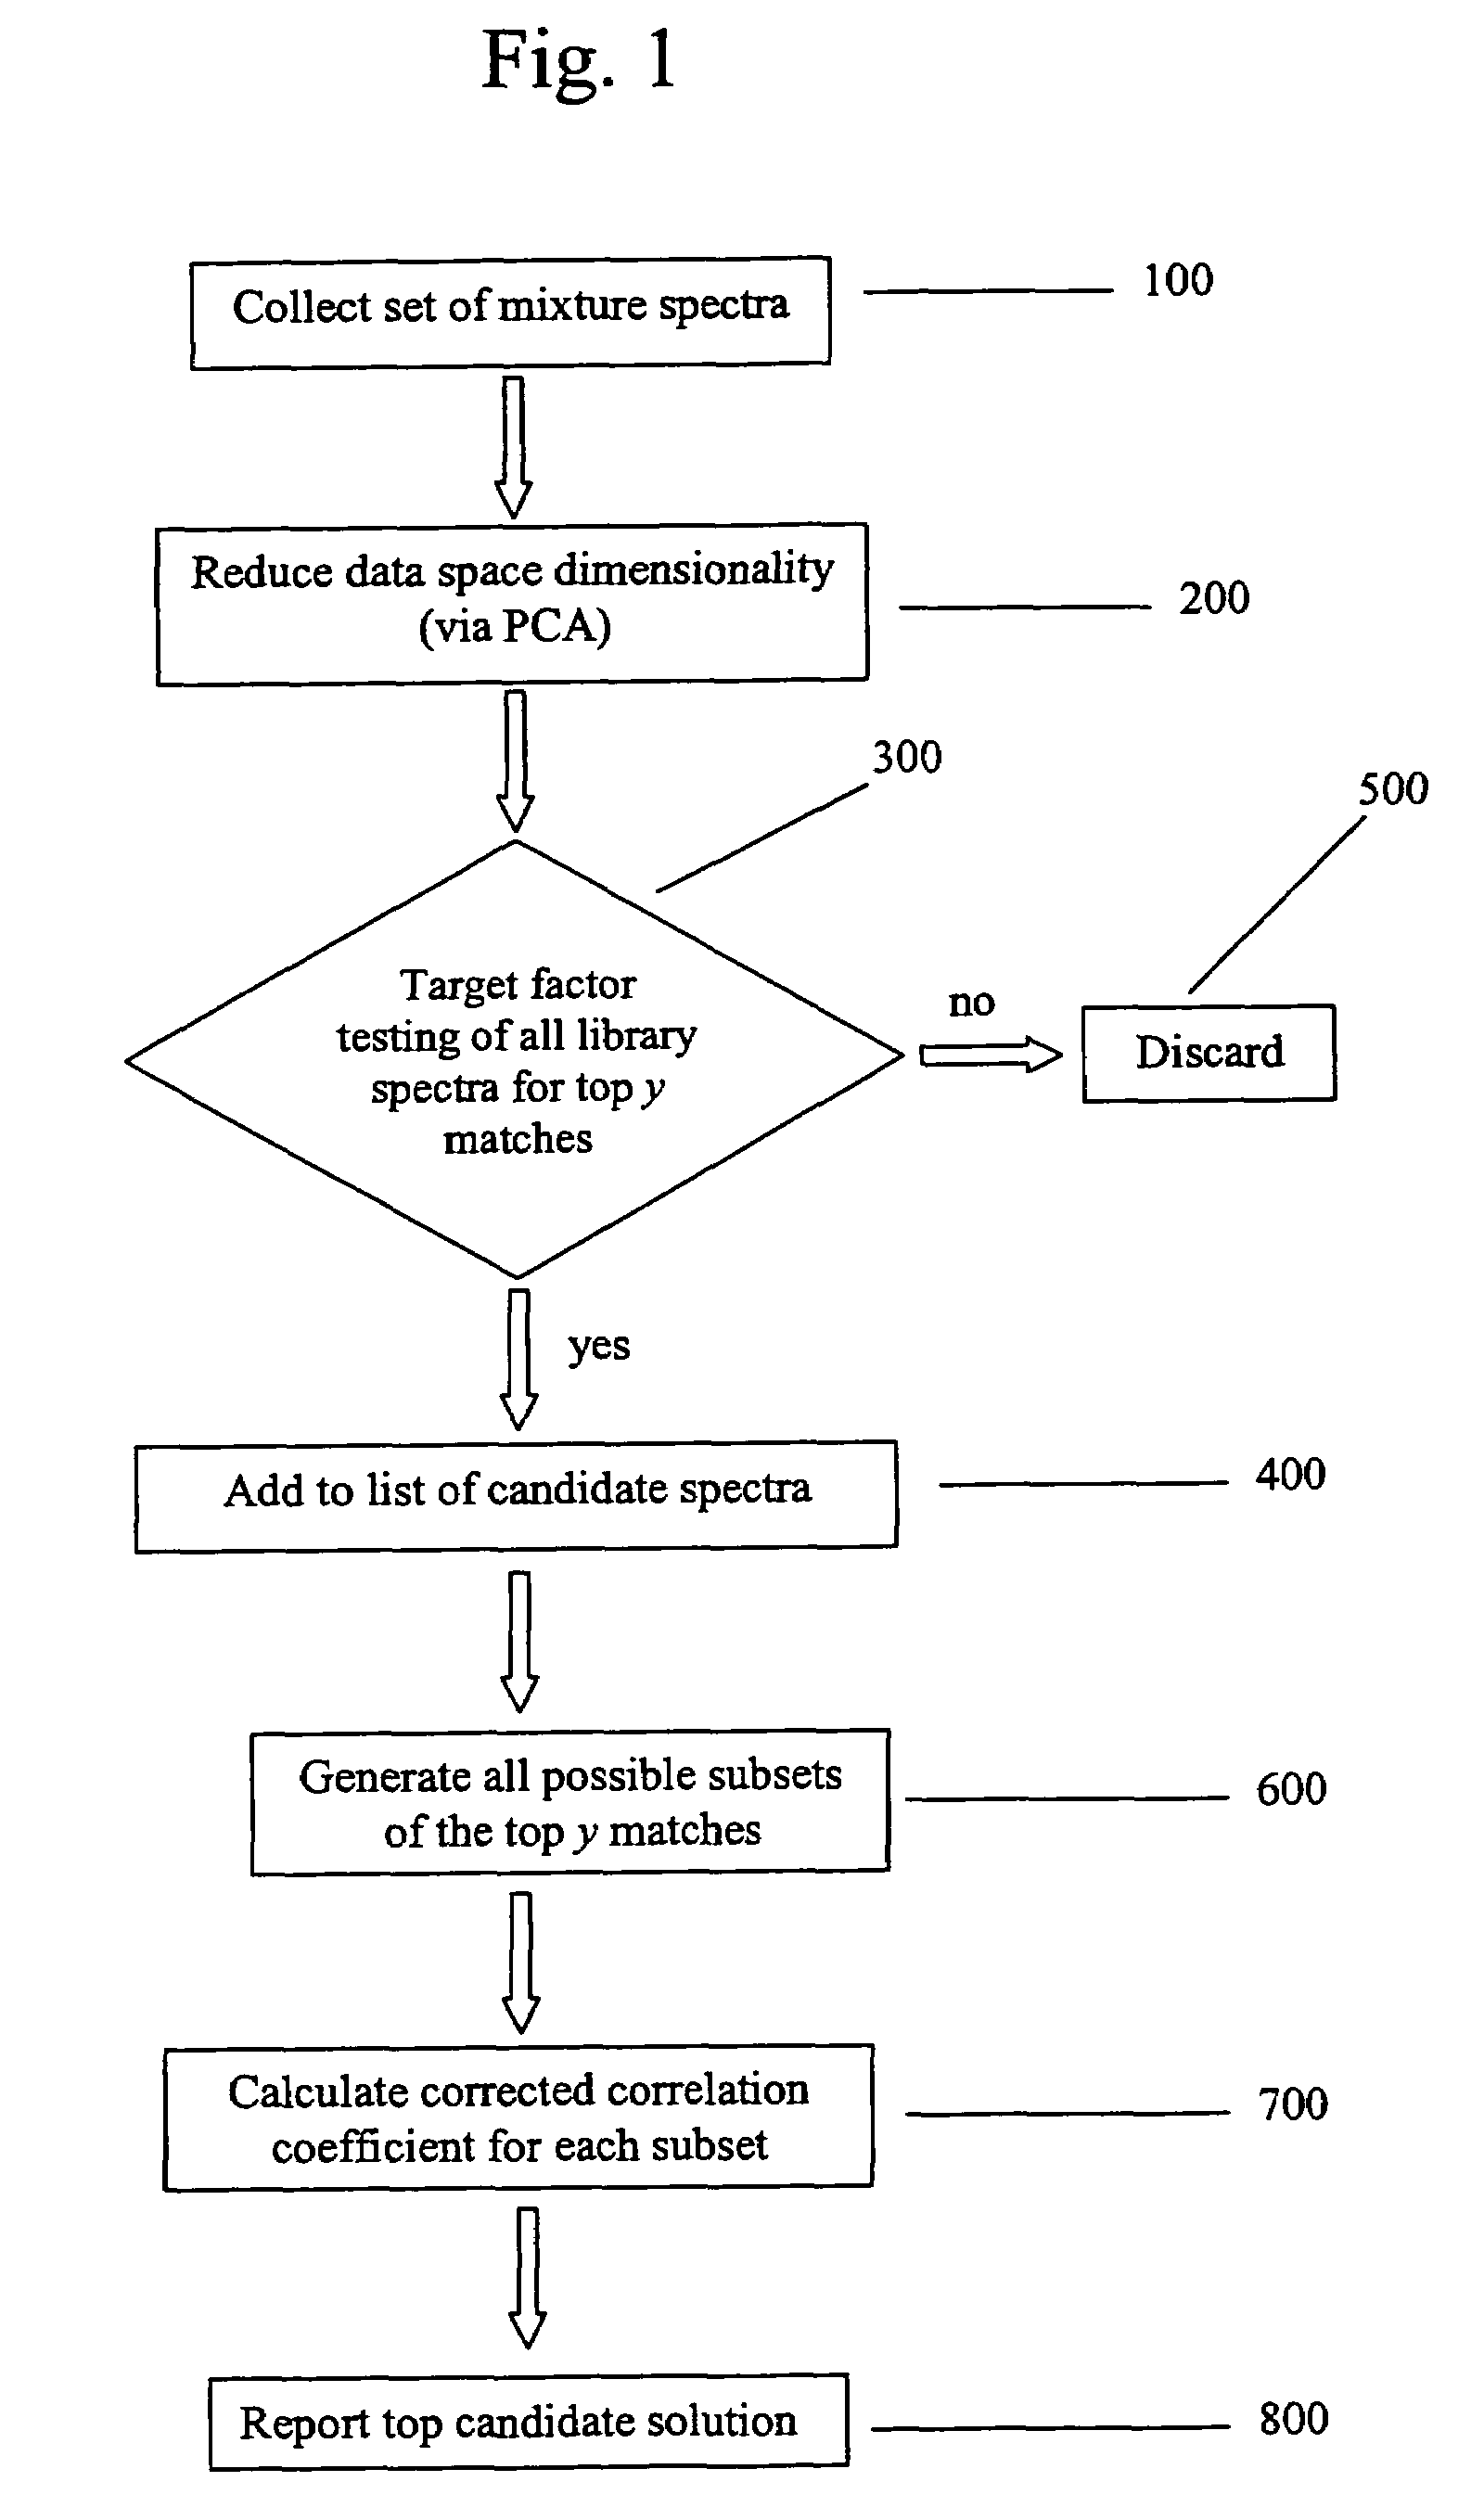
[0067]This section provides a set of calculations to illustrate the inventive method as applied to the mixture of Example 1. While this section will only describe the calculations for the identified best match of Bacillus Pumilis, Bacillus Subtilis, and Baking Soda, it should be understood that the same calculations will be performed for every possible combination of the top 10 matches (y=10) identified in Table 1.
[0068]Target factor testing yields the ranked matches provided in Table 1. One of the 1023 potential candidate solutions (subsets resulting from all possible combinations of the top 10 matches) is Bacillus Pumilis, Bacillus Subtilis, and Baking Soda. The projected library spectra are calculated as described above using Eqs. 4-6. The correlation coefficient CorrCoef is then calculated for each component in the candidate solution using the projected library spectra and the actual library spectra, as described in Eq. 7. The resulting values calculated using Eq. 7 ...
example 2
Calculations
[0078]This section provides a set of calculations to illustrate the inventive method as applied to the mixture of Example 2. While this section will only describe the calculations for one of the top three identified best matches of Microcrystalline Cellulose, Corn Starch, and Cane Sugar it should be understood that the same calculations will be performed for every possible combination of the top 10 matches (y=10) identified in Table 4.
[0079]Target factor testing yields the ranked matches provided in Table 4. One of the 1023 potential candidate solutions (subsets resulting from all possible combinations of the top 10 matches) is Microcrystalline Cellulose, Corn Starch, and Cane Sugar. The projected library spectra are calculated as described above using Eqs. 4-6. The correlation coefficient CorrCoef is then calculated for each component in the candidate solution using the projected library spectra and the actual library spectra, as described in Eq. 7. The resulting values...
PUM
| Property | Measurement | Unit |
|---|---|---|
| wavelength | aaaaa | aaaaa |
| wavelength | aaaaa | aaaaa |
| correlation coefficient values | aaaaa | aaaaa |
Abstract
Description
Claims
Application Information
 - R&D
- Intellectual Property
- Life Sciences
- Materials
- Tech Scout
- Unparalleled Data Quality
- Higher Quality Content
- 60% Fewer Hallucinations
Browse by: Latest US Patents, China's latest patents, Technical Efficacy Thesaurus, Application Domain, Technology Topic, Popular Technical Reports.
© 2025 PatSnap. All rights reserved.Legal|Privacy policy|Modern Slavery Act Transparency Statement|Sitemap|About US| Contact US: help@patsnap.com


