Methods and apparatus for determining cardiac output and left atrial pressure

a technology of applied in the field of methods and apparatus for determining cardiac output and left atrial pressure, can solve the problems of inter-clinical variability, limited methods, and often poor lap estimation of pcwp methods

Active Publication Date: 2010-02-23
MASSACHUSETTS INST OF TECH +1
View PDF2 Cites 14 Cited by
  • Summary
  • Abstract
  • Description
  • Claims
  • Application Information

AI Technical Summary

Problems solved by technology

While each of these methods can offer some advantages, as described below, all of the methods are limited in at least one clinically significant way.
In fact, as a result of a number of technical problems, in practice, the PCWP method frequently provides only a poor estimate of LAP.
These problems include partial wedging and balloon over-inflation [38,53], dependence of the measurement on the wedge catheter position [27,33], and inter-clinician variability in interpreting the phasic PCWP measurement [37].
In 2,711 PCWP measurement attempts made in the ICU, Morris et al reported that only 69% of these attempts were successful with only 10% of the unsatisfactory measurements due to easily correctable damped tracings [53].
Similar technical problems are also encountered in implementing the thermodilution method in which variations in injectate volume, rate, and temperature introduce error in the measurement, which is known to be in the 15-20% range [39,50,68].
Also, the very injection of fluid and balloon inflation poses some risk to the patient [17,34,42].
In addition, a major limitation of the thermodilution and PCWP methods is that an operator is required.
While this method is continuous and very accurate, it requires the placement of the flow probe directly around the aorta and is therefore much too invasive for most clinical applications.
Although this method is also highly regarded in terms of its accuracy, it is too cumbersome for frequent clinical application.
As a result, the signal to noise ratio of continuous thermodilution is small compared to standard thermodilution, which may render the continuous approach to be less accurate [78].
These non-invasive methods are not commonly employed in critical care medicine, because they require expensive capital equipment and an expert operator to stabilize an external ultrasound transducer [40].
Although this method is non-invasive and continuous, it is too inaccurate for use in critically ill patients due to excessive lung fluids [11].
However, this method is too invasive and risky for routine clinical application.
While this approach is simple and non-invasive, it is neither continuous nor has it been shown to be sensitive to at least changes in PCWP [9,16,69].
Although these techniques may also be non-invasive, they are expensive, can only be used intermittently, and are not specific and may therefore be inaccurate [2,57, 62].
However, central SAP is rarely measured clinically due to the risk of blood clot formation and embolization.
Subsequently, Tajimi et al reported that they were not able to identify a location in the canine or human pulmonary artery in which exponential diastolic pressure decays were consistently visible [71].
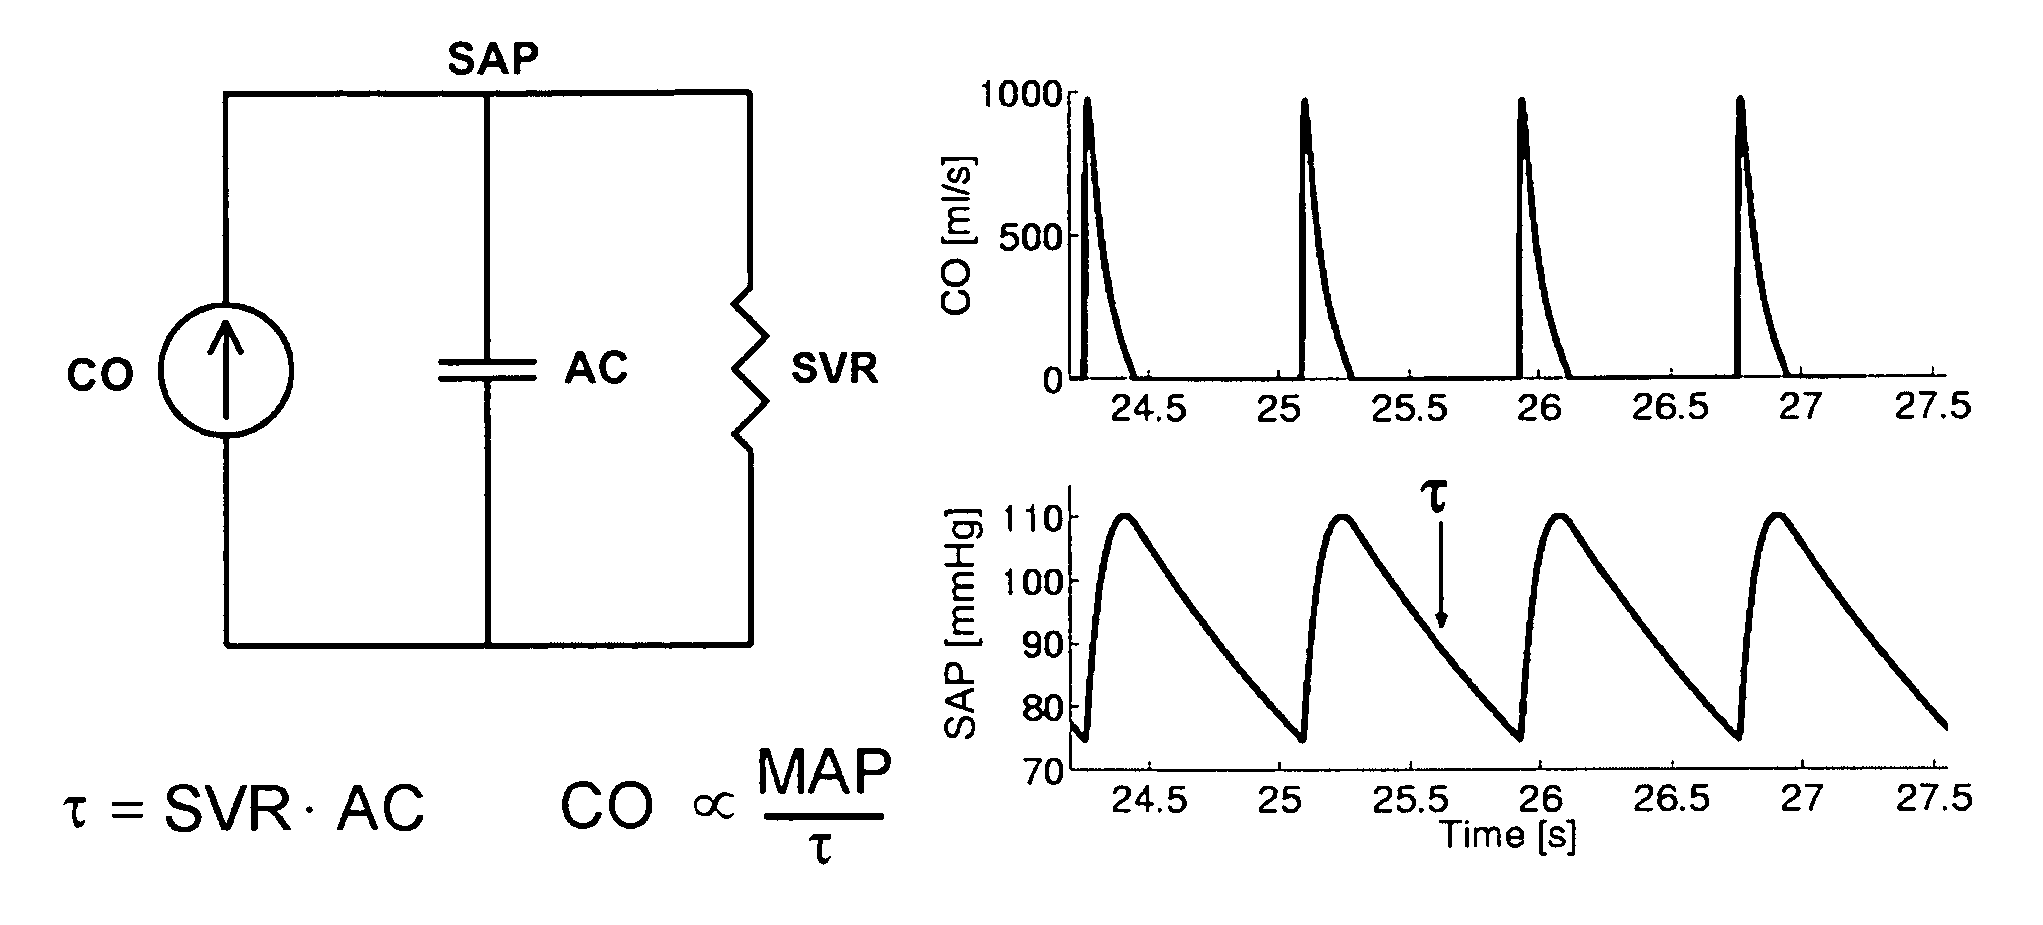
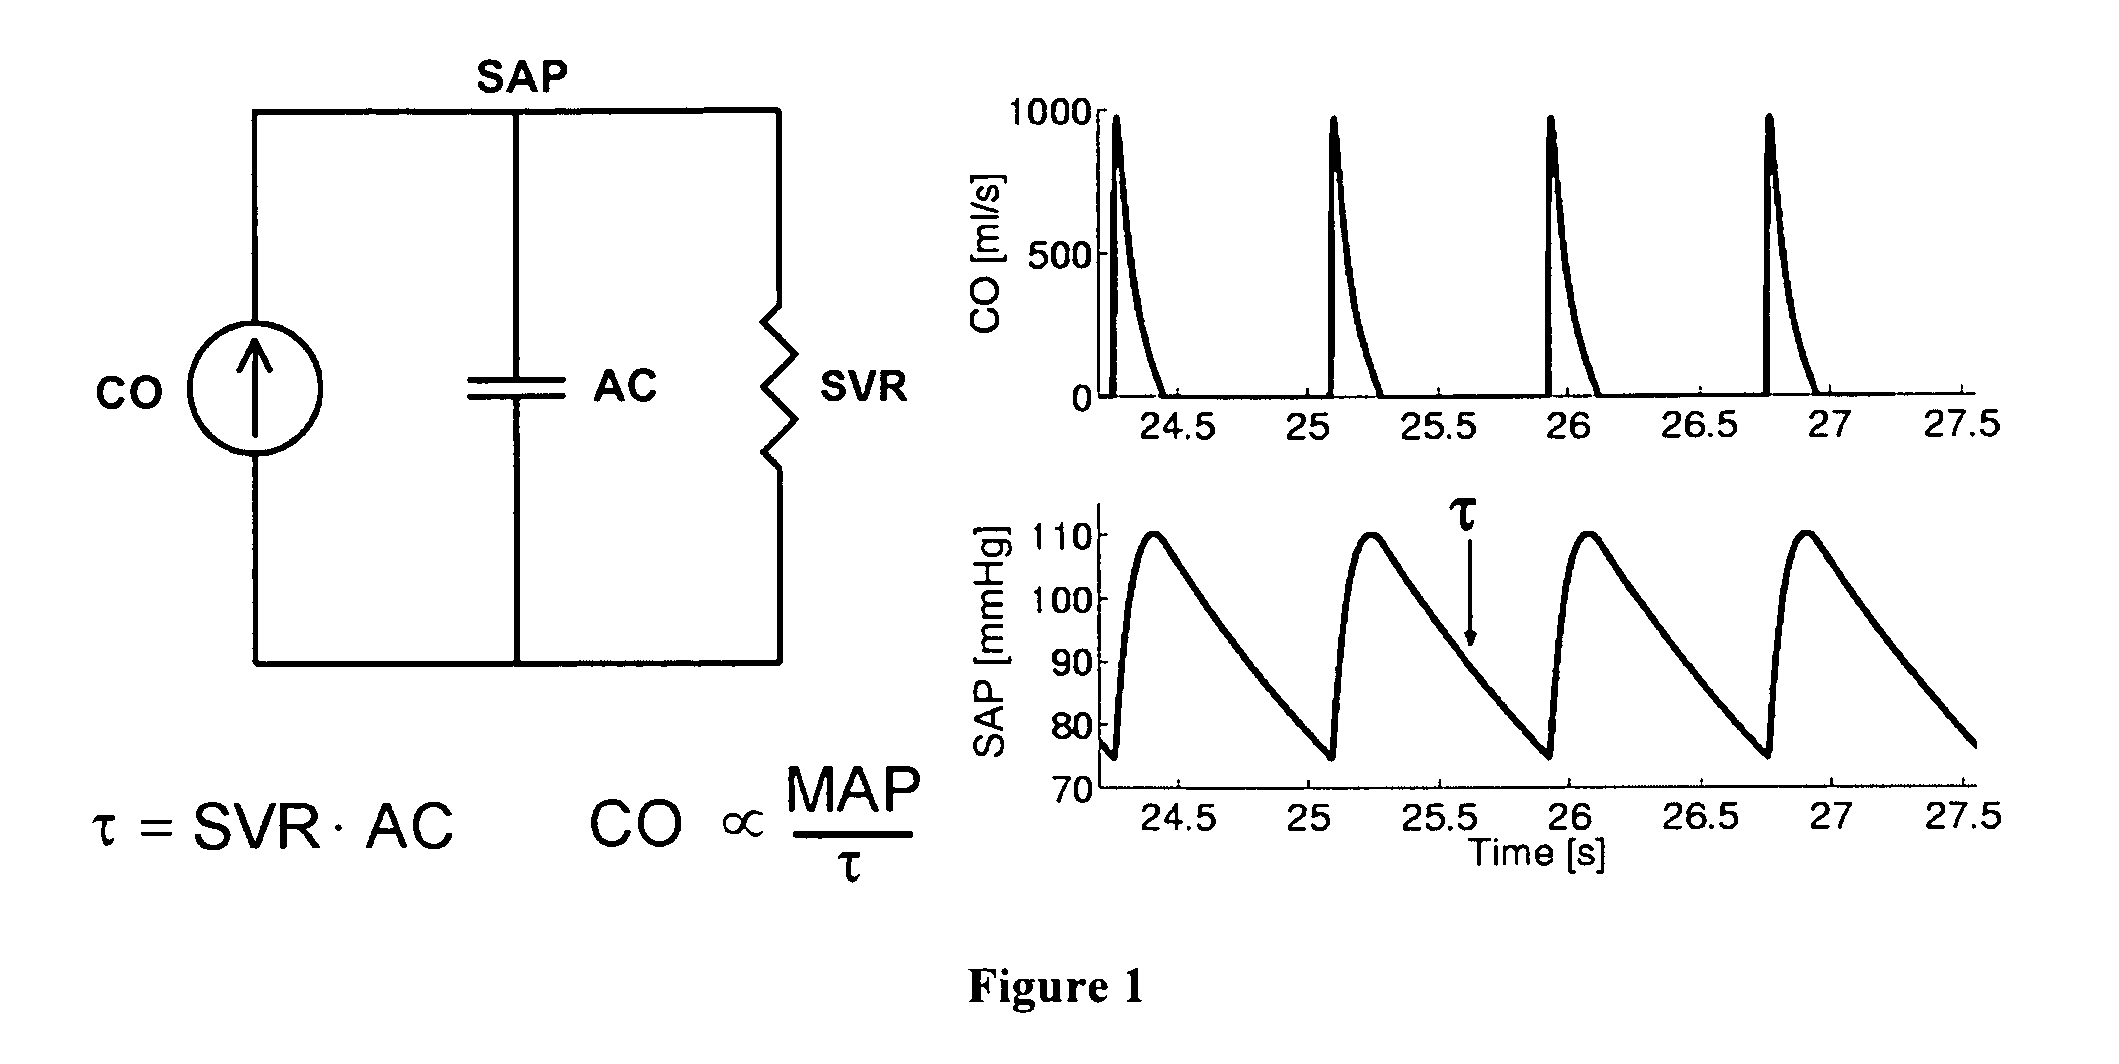
The reason is that the systemic and pulmonary arterial trees are not simply lumped systems like the Windkessel model suggests but rather complicated distributed systems with impedance mismatches throughout due to vessel tapering, bifurcations, and caliber changes.
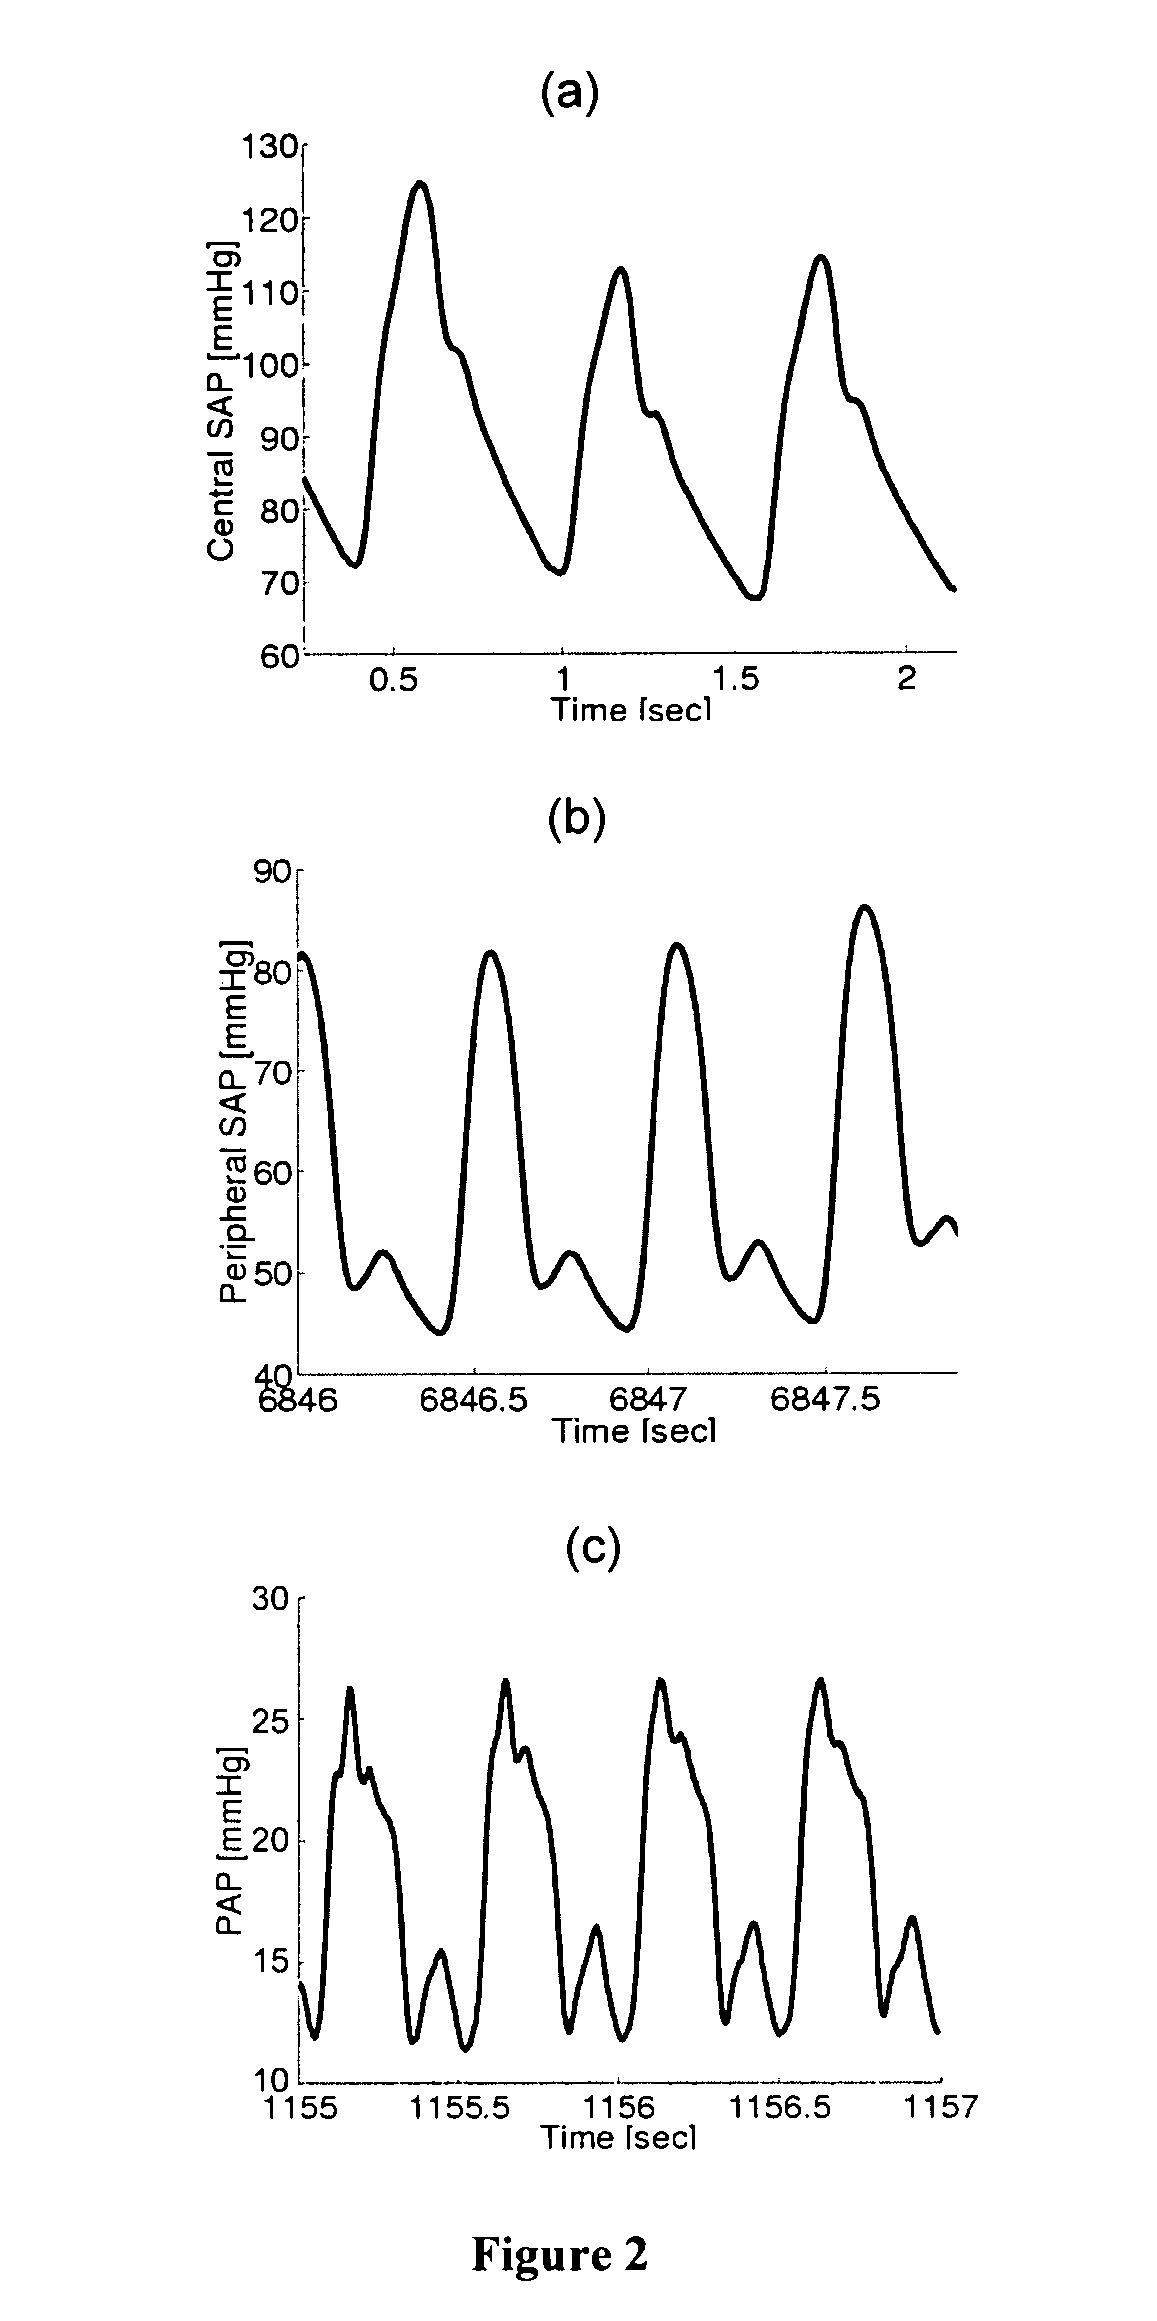
Thus, the technique of Bourgeois et al cannot be applied to clinically measurable peripheral SAP and PAP waveforms.
However, catheters are usually not placed for prolonged periods of time at either of these sites in ICUs, ORs, or recovery rooms due to safety considerations.
However, these techniques were only demonstrated to be successful in central ABP waveforms or over a narrow physiologic range.
Moreover, learning techniques could only be successful provided that the available training set of patient data reflected the entire patient population.
However, Linton et al only showed that their technique was accurate over a narrow physiologic range, and several studies have demonstrated limitations of the technique of Wesseling et al (e.g., [20,29]).
Moreover, even though LAP is also a significant determinant of PAP and should therefore be reflected in the PAP waveform, none of these techniques included a means to monitor LAP.
Because of the corruptive effects of highly complex waves at these time scales, the techniques were limited in that they 1) could only be applied to highly invasive central SAP waveforms in which the complex wave reflections may be attenuated; 2) necessitated multiple peripheral SAP waveform measurements (which are rarely obtained clinically); 3) required an exhaustive training data set, and / or 4) are accurate only over a narrow physiologic range or only during cardiac interventions.
However, the confounding effects of wave as well as inertial phenomenon are known to diminish with increasing time scale [55].
While this technique may permit continuous and accurate monitoring of CO with a level of invasiveness suitable for routine clinical application, it does not provide a convenient means to monitor LAP.
However, this simple technique is not as accurate as the PCWP method [31] (see below) and becomes unreliable when the rate of drainage of blood from the pulmonary artery into the pulmonary capillaries is slow.
Thus, for example, it is well known that the end-diastolic PAP is not an acceptable index of LAP in patients with pulmonary vascular disease [28].
However, this technique was shown to be ineffective when the network was trained on one set of subjects and tested on a different set of subjects [14].
While these techniques may be minimally invasive or non-invasive, they are either not continuous or applicable to subjects breathing spontaneously.
Moreover, since SAP and related signals are also due to ventricular and arterial functionality, these techniques do not provide a specific measure of LAP or PCWP and may therefore be inaccurate [13].

Method used


Image

  • Methods and apparatus for determining cardiac output and left atrial pressure
  • Methods and apparatus for determining cardiac output and left atrial pressure
  • Methods and apparatus for determining cardiac output and left atrial pressure

Examples


Embodiment Construction

[0040]The present invention is based at least in part on the recognition that proportional CO, average LAP, and / or other hemodynamic variables are reflected in the contour of a PAP waveform, a RVP waveform, or other circulatory signals. The invention therefore involves the mathematical analysis of the contour of a circulatory signal so as to decipher, and thereby determine, e.g., continuously, these clinically significant hemodynamic variables. The mathematical analysis of a circulatory contour is specifically defined here to comprise an examination of the temporal variations in the signal. Thus, for example, monitoring LAP via the end-diastolic PAP does not constitute a mathematical analysis of a circulatory contour, since this examination simply indicates PAP at particular instances of time (end-diastole).

[0041]In one embodiment of the invention, the mathematical analysis of a circulatory contour is based on the Windkessel model of the pulmonary arterial tree shown in FIG. 3. (Alt...


PUM


Abstract

Method and apparatus are introduced for determining proportional cardiac output (CO), absolute left atrial pressure (LAP), and / or other important hemodynamic variables from a contour of a circulatory pressure waveform or related signal. Certain embodiments of the invention provided herein include the mathematical analysis of a pulmonary artery pressure (PAP) waveform or a right ventricular pressure (RVP) waveform in order to determine beat-to-beat or time-averaged proportional CO, proportional pulmonary vascular resistance (PVR), and / or LAP. The invention permits continuous and automatic monitoring of critical hemodynamic variables with a level of invasiveness suitable for routine clinical application. The invention may be utilized, for example, to continuously monitor critically ill patients with pulmonary artery catheters installed and chronically monitor heart failure patients instrumented with implanted devices for measuring RVP.

Description

BACKGROUND OF THE INVENTION[0001]Cardiac output (CO) is the volume of blood ejected by the heart per unit time, while left atrial pressure (LAP) generally indicates the blood pressure attained in the left ventricle during the filling phase of the cardiac cycle. CO and LAP are perhaps the two most important quantities to be able to monitor in critically ill patients, as they facilitate the diagnosis, monitoring, and treatment of various disease processes such as left ventricular failure, mitral valve disease, and shock of any cause [36]. For example, a decrease in CO while LAP is rising would indicate that the patient is in left ventricular failure, whereas a decrease in CO while LAP is falling would indicate that the patient might be going into hypovolemic shock.[0002]Several methods are currently available for monitoring CO or LAP. While each of these methods can offer some advantages, as described below, all of the methods are limited in at least one clinically significant way.[00...

Claims


Application Information

Patent Timeline
Patent Type & Authority Patents(United States)
IPC IPC(8): A61B5/02
CPCA61B5/02028A61B5/02116A61B5/0215A61B5/029A61B2560/0223A61B5/7239
Inventor COHEN, RICHARD J.MUKKAMALA, RAMAKRISHNA
Owner MASSACHUSETTS INST OF TECH
Why Eureka
Try Eureka