Peak power detection in digital designs using emulation systems

a technology of emulation system and power detection, applied in the direction of electric/magnetic computing, analogue processes for specific applications, instruments, etc., can solve the problems of design constraints, the conventional emulation system has not responded to these challenges, and the software simulator cannot achieve anything

Active Publication Date: 2012-01-31
CADENCE DESIGN SYST INC
View PDF8 Cites 15 Cited by
  • Summary
  • Abstract
  • Description
  • Claims
  • Application Information

AI Technical Summary

Benefits of technology

[0014]In one embodiment of the present invention, a method of analyzing power consumption for a DUT (device under test) that includes an integrated circuit or an electronic system includes: providing emulation data for states of the DUT in one or more time windows; determining operational mode values from the emulation data and a selection of operational modes that characterize circuit behavior in the one or more time windows; dividing each time window into one or more segments based on at least one power criterion; determining power-activity values for one or more of the segments; determining power-consumption values for the one or more segments from the power-activity values; using the power-activity values and the power-consumption values to determine relative power activity across the one or more segments and adjusting the one or more segments to target high power activity over operational modes in the one or more time windows; and saving one or more values for power activity of the DUT in a computer-readable medium.
[0021]According to another aspect, adjusting the one or more segments may include using a finer resolution for portions of each time window with high power consumption values.
[0023]According to another aspect, the method may further include: identifying one or more peak-power segments from the adjusted one or more segments, wherein each peak-power segment characterizes a peak power consumption across the one or more time windows; identifying one or more nodes of the DUT with high power consumption in the one or more peak-power segments, and saving one or more values for the one or more peak-power segments in the computer-readable medium.

Problems solved by technology

In fact, emulators can operate at speed fast enough to allow the intended application software to run on the prototype system, which is something the software simulator can never accomplish.
Integrated circuits designed for low-power applications (e.g., for wireless and portable electronics) have additional challenges for design verification including minimizing power dissipation, designing efficient packaging and cooling systems for high-power integrated circuits, and verifying functionalities of low-power or no power situations early in the design.
However, conventional emulation systems have not responded to these challenges.
These power management design techniques may significantly change the design constraints, yet none of the intended behavior can be captured in the RTL of the design.
This deficiency creates a gap in the RTL to Graphic Data System II (GDSII) implementation and verification flow where the original RTL can no longer be relied upon as a complete representation of the design, and thus cannot be used to verify the final netlist implementation containing power management implementations.
With higher levels of integration, power estimation has become an increasingly critical issue for chip design, especially for low-power designs.
Identifying all high power consumption scenarios is a challenging task in power analysis.
However, conventional power analysis tools, which usually base their power calculations on design activity files with common formats such as TCF (Toggle Count Format) or SAIF (Switching Activity Interchange Format), typically report only the average power consumption for a given time period.
Additionally, power analysis tools based on VCD (Value Change Dump) for calculating peak power values are usually time-consuming and often not practical for large complex designs, particularly when applied to relatively long test sequences that replicate conditions for the final silicon.
Thus, conventional approaches have not adequately enabled hardware-based verification of critical power management functions such as power estimation and peak power detection.

Method used


Image

  • Peak power detection in digital designs using emulation systems
  • Peak power detection in digital designs using emulation systems
  • Peak power detection in digital designs using emulation systems

Examples


Embodiment Construction

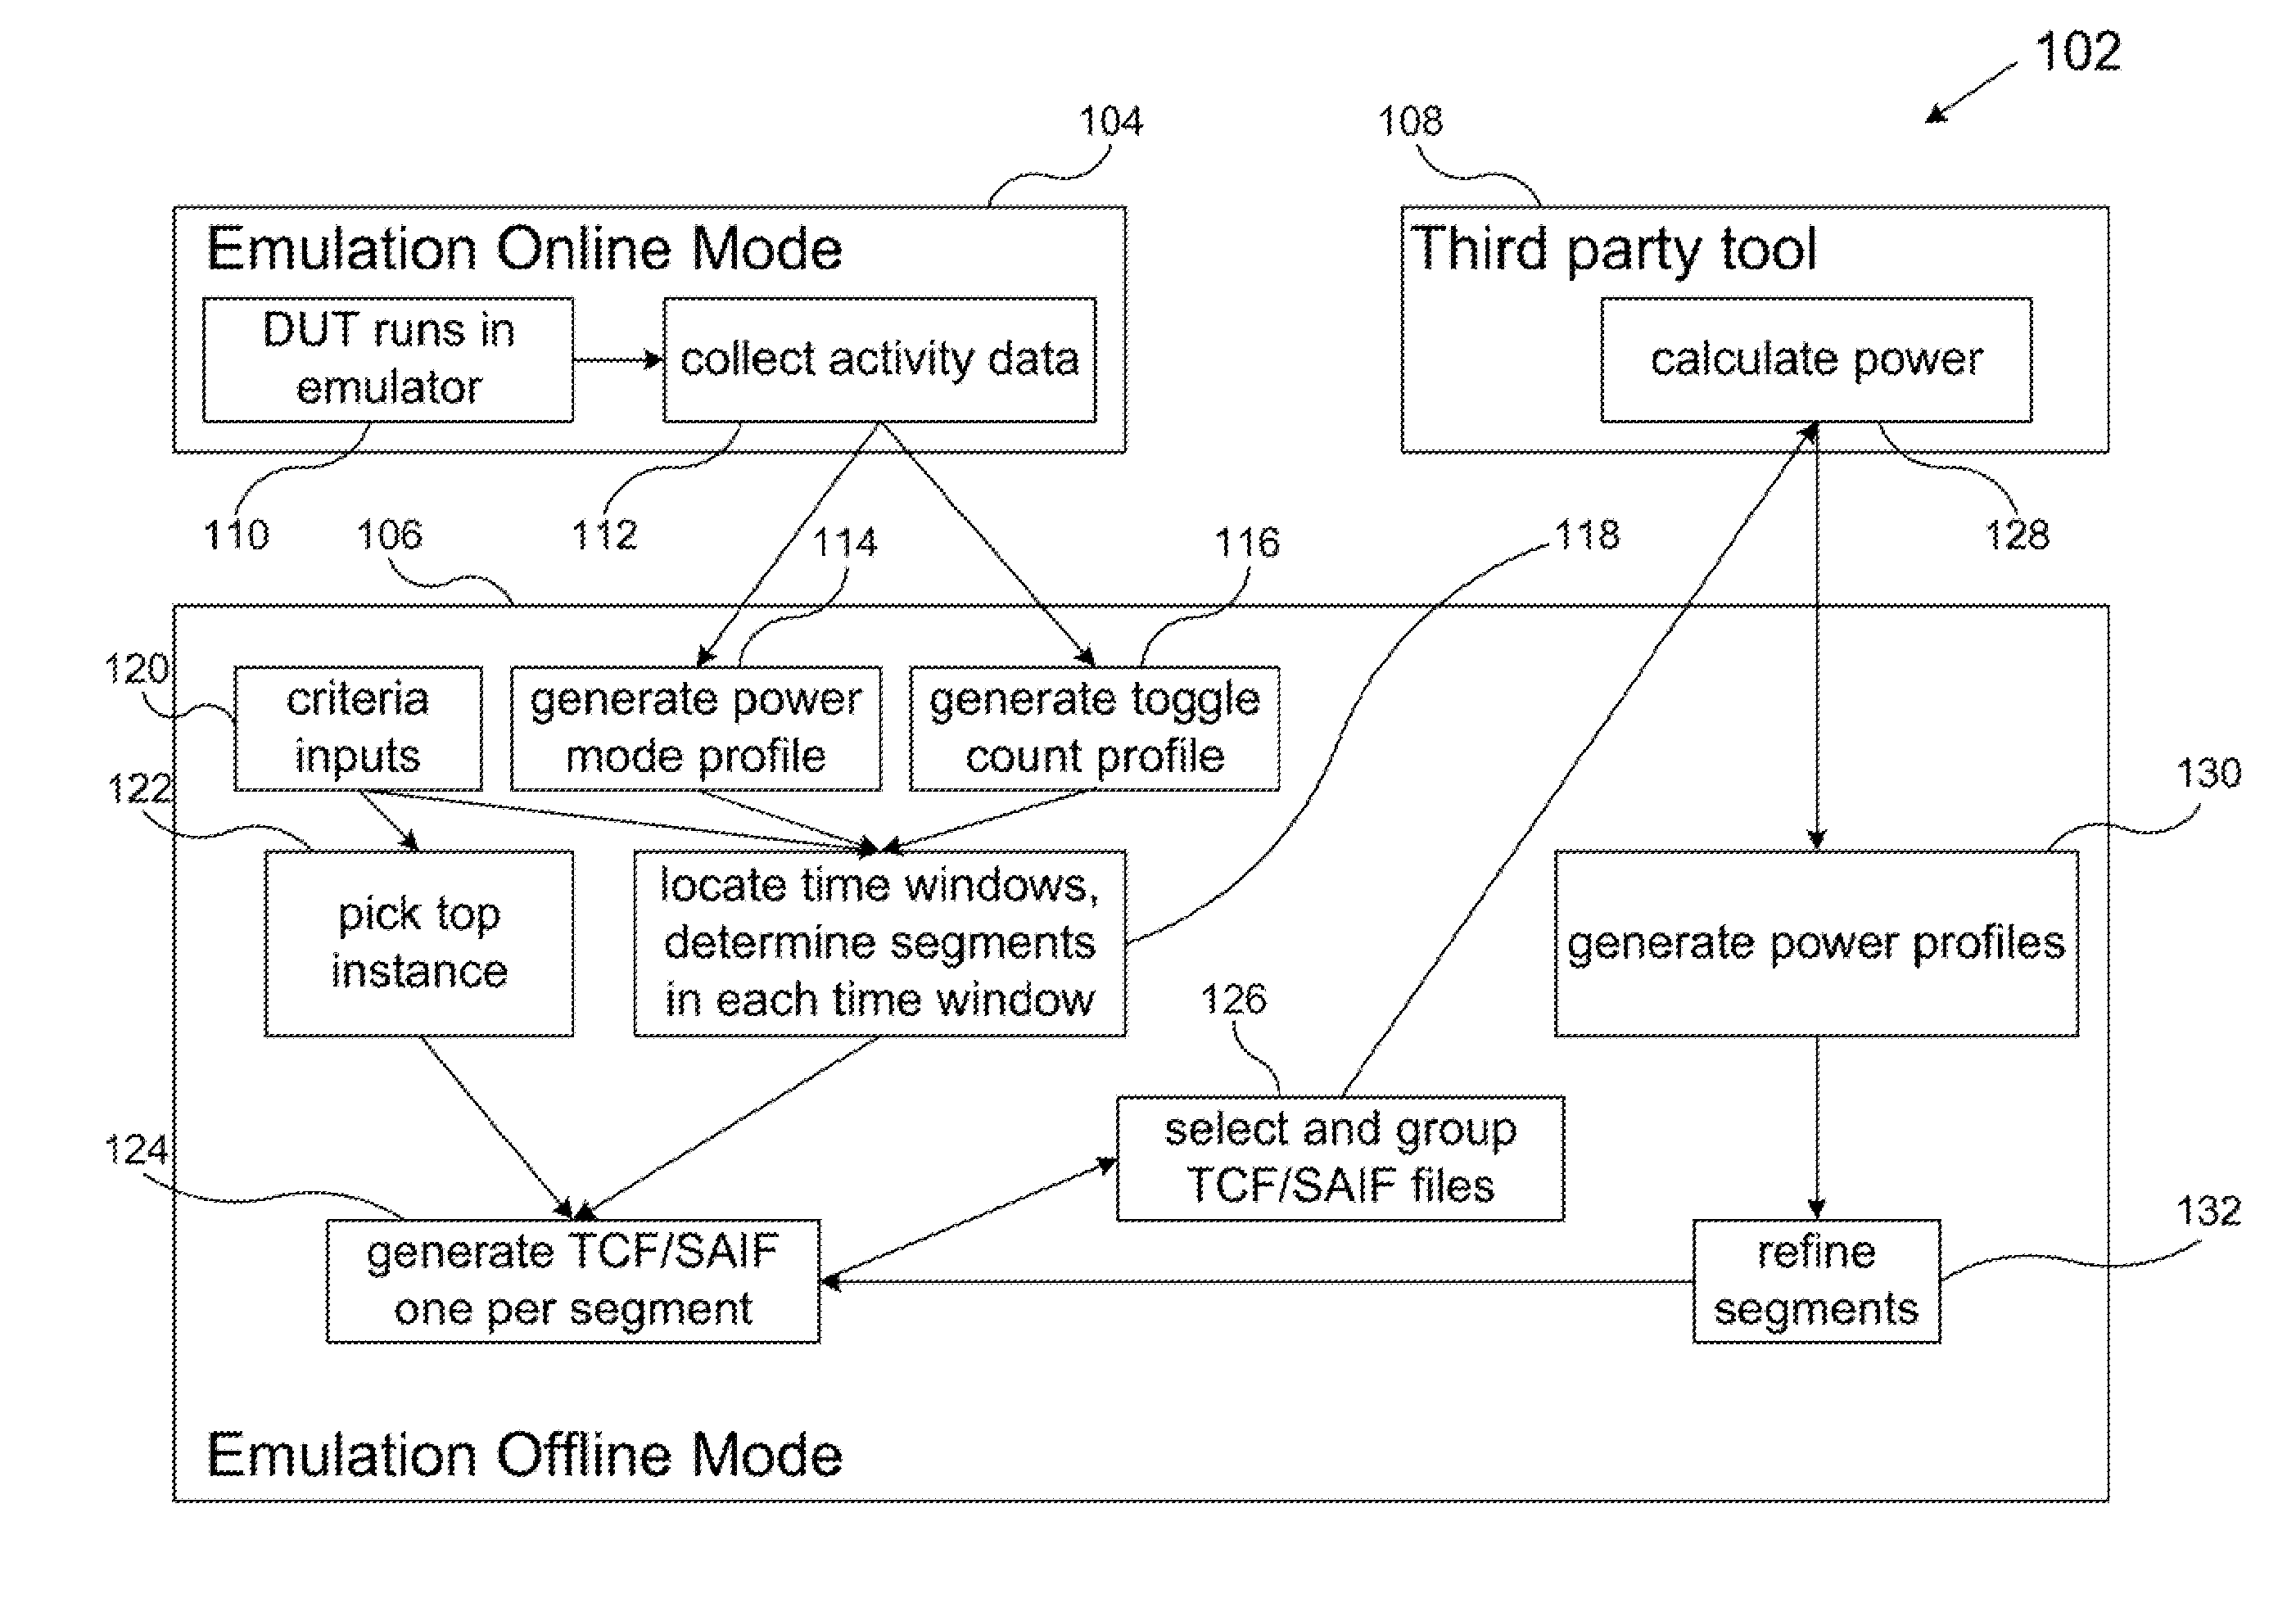
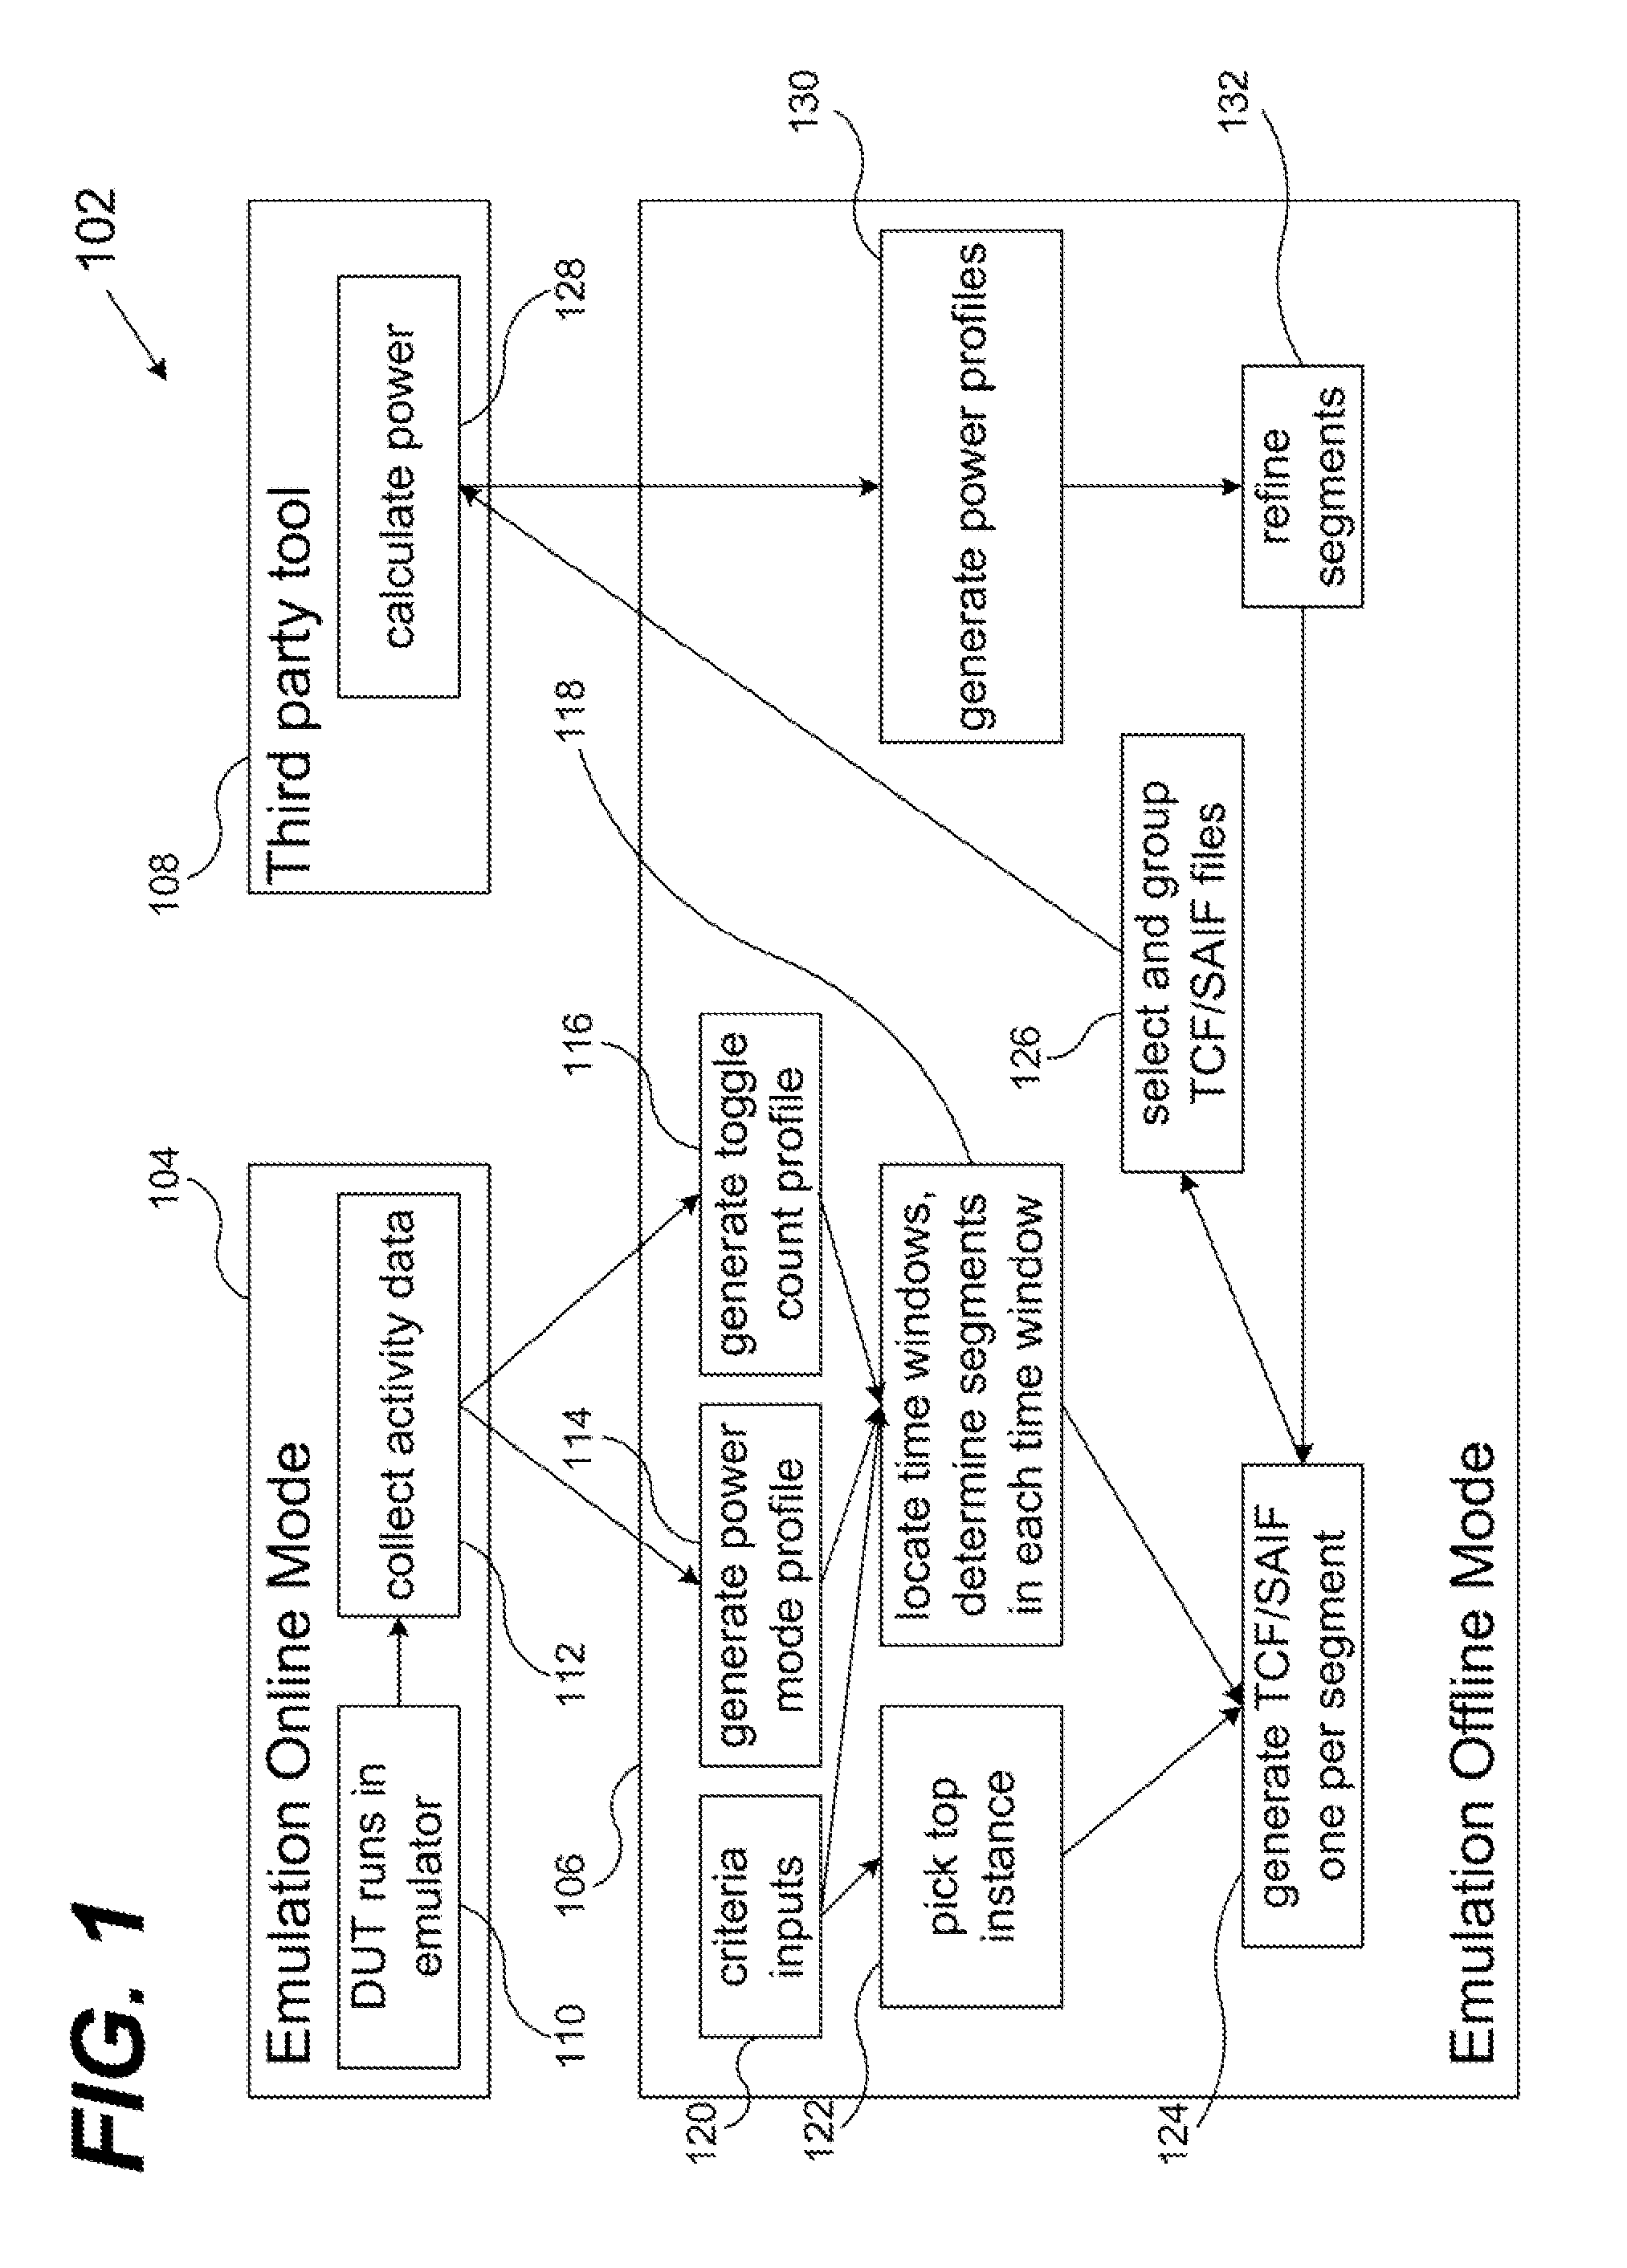
[0039]FIG. 1 shows structural details for a method 102 of dynamic power analysis in an emulation system according to an embodiment of the present invention. Steps or aspects of the method 102 are separated into phases of operation including an emulation online mode 104, an emulation offline mode 106, and external or third-party tools 108 for power calculations.

[0040]The third-party tools 108 can operate according to standard models for power consumption. In general, the total chip power consumption is the sum of internal power and leakage power for all the instances and all the net power:

[0041]Ptotal=∑ln⁢⁢Pinternal+∑ln⁢⁢Pleakage+∑lm⁢⁢Pnet(1)

[0042]The internal power consumption of each component can be calculated based on models (e.g., from a technology library) and switching activity captured by TCF (Toggle Count Format) or SAIF (Switching Activity Interchange Format) data:

[0043]Pinternal=∑per_arc⁢⁢(TRarcij×Φ⁡(Si,Cj))+∑per_pin⁢⁢(TRi×Φ⁡(Si))(2)

[0044]In this formula, TR is the effecti...


PUM


Abstract

A method of analyzing power consumption for a DUT (device under test) that includes an integrated circuit or an electronic system includes: providing emulation data for states of the DUT in one or more time windows; determining operational mode values from the emulation data and a selection of operational modes that characterize circuit behavior in the one or more time windows; dividing each time window into one or more segments based on at least one power criterion; determining power-activity values for the one or more segments; determining power-consumption values for the one or more segments from the power-activity values; using the power-activity values and the power-consumption values to determine relative power activity across the one or more segments and adjusting the one or more segments to target high power activity over operational modes in the one or more time windows; and saving one or more values for power activity of the DUT in a computer-readable medium.

Description

CROSS-REFERENCE TO RELATED APPLICATIONS[0001]This application claims the benefit of U.S. Provisional Application No. 61 / 048,000, filed Apr. 25, 2008, and incorporated herein by reference in its entirety.BACKGROUND OF THE INVENTION[0002]1. Field of Invention[0003]The present invention relates generally to design verification systems for integrated circuits (ICs) and more particularly to the use of hardware-based functional verification systems such as hardware logic emulation or simulation acceleration systems for detecting and analyzing peak power windows.[0004]2. Description of Related Art[0005]Design engineers typically rely on EDA (Electronic Design Automation) tools to develop complex integrated circuits. These EDA tools include a number of hardware-based functional verification systems including logic emulation systems and simulation accelerators. For simplicity these tools will be referred to collectively as emulation systems in the subsequent discussion.[0006]Emulation system...

Claims


Application Information

Patent Timeline
Patent Type & Authority Patents(United States)
IPC IPC(8): G06F17/50G06F9/455
CPCG06F17/5027G06F2217/78G06F30/331G06F2119/06
Inventor ZHU, BINGLIN, TSAIR-CHINTUNG, TUNG-SUNGAO, JINGBO
Owner CADENCE DESIGN SYST INC
Why Eureka
Try Eureka