Data analysis methods for locating entities of interest within large, multivariable datasets

a data analysis and entity technology, applied in the field of data analysis methods for locating entities, can solve the problems of manual analysis, difficult interpretation of data, and dramatic increase in the complexity and quantity of data generated, and achieve the effect of improving the discrimination score and improving the indication

Active Publication Date: 2012-03-06
METABOLON
View PDF2 Cites 6 Cited by
  • Summary
  • Abstract
  • Description
  • Claims
  • Application Information

AI Technical Summary

Benefits of technology

[0007]Another advantage of the present invention is that it enables identification of a subset of data points that is indicative of a trend associated with a biological phenomenon of interest when the trend is not evident in a target dataset as a whole. In one case the trend is a known or predicted trend although it is not obvious in the target dataset. In another case the trend is evident in a dataset from one or more tissues, but not in the target tissue dataset. Thus, in one aspect, the methods of the invention enable identification as a biomarker a set of data points that correspond to chemical entities whose relative presence in a target tissue is potentially indicative of a biological phenomenon taking place in another less accessible tissue.
[0008]In one embodiment, the present invention provides data analysis methods for locating subsets of complex biological datasets that are of most interest for further analysis. The methods of the invention comprise the steps of: a) obtaining a set of data points for a biological phenomenon of interest; b) designating a trend in the set of data that is associated with the biological phenomenon of interest; c) developing a mathematical model of the trend; and d) testing each data point in the set for adherence to the mathematical model, wherein the data points adhering to the model are the subset of most interest for further analysis. In the methods of the invention, the designated trend may be observable in a display of the dataset as a whole or may instead be a known trend or a trend that is predicted to be associated with the biological phenomenon of interest.
[0009]In another embodiment, the invention provides data analysis methods for investigating the molecular mode of action of a biological phenomenon of interest. The methods comprise the steps of: a) obtaining biochemical profiling, gene expression profiling, or protein expression profiling data for a biological phenomenon of interest; b) designating a trend in the data that is associated with the biological phenomenon; c) developing a mathematical model of the trend; d) testing each data point in the set for adherence to the mathematical model; and e) identifying one or more metabolic pathways to which the data points that adhere to the model belong, wherein the mode of action of the phenomenon of interest affects the identified metabolic pathways. In the methods of the invention, the designated trend may be observable in a display of the dataset as a whole or may instead be a known trend or a trend that is predicted to be associated with the biological phenomeno...

Problems solved by technology

Recent advances in biological experimental techniques have resulted in a dramatic increase in the complexity and quantity of data that is being generated and the technology for generating data has outpaced the technology for helping scientists comprehend the new information contained in the data.
For example, gene expression profiling, metabolic profiling, protein expression profiling and automated cell imaging techniques have created an explosion o...

Method used


Image

  • Data analysis methods for locating entities of interest within large, multivariable datasets
  • Data analysis methods for locating entities of interest within large, multivariable datasets
  • Data analysis methods for locating entities of interest within large, multivariable datasets

Examples


example 1

Acetaminophen-Induced Liver Toxicity Study Design and Data Acquisition

[0033]An acetaminophen-induced liver toxicity study was performed as follows. Rats were administered a single dose of acetaminophen (APAP) at 0, 50, 150, 1500 or 2000 mg / kg p.o. (6 rats per group). The 150 mg / kg dose is equivalent to a low overdose level in humans (˜10 g) and 1500 mg / kg is a low toxic dose in rats. The rats were sacrificed at 6, 18, 24, and 48 hr post dosing. Livers of the rats were processed for biochemical profiling, histopathology and gene expression analysis. For the 0, 50 and 1500 mg / kg dose groups, rat urine was collected at −24-0, 0-6, 6-24, and 24-48 hr relative to dosing. Similarly, rat serum was collected at 48 hr for the 0, 50 and 1500 mg / kg groups.

Sample Preparation

[0034]Rat tissue was prepared for LC-MS analysis as follows. Rat liver tissue samples were frozen upon collection. A slice of each frozen sample was placed into a mortar, covered with liquid nitrogen, and ground with a pestl...

example 2

Data Analysis Methods: Locating a Subset of Most Interest that Corresponds to an Observed Trend

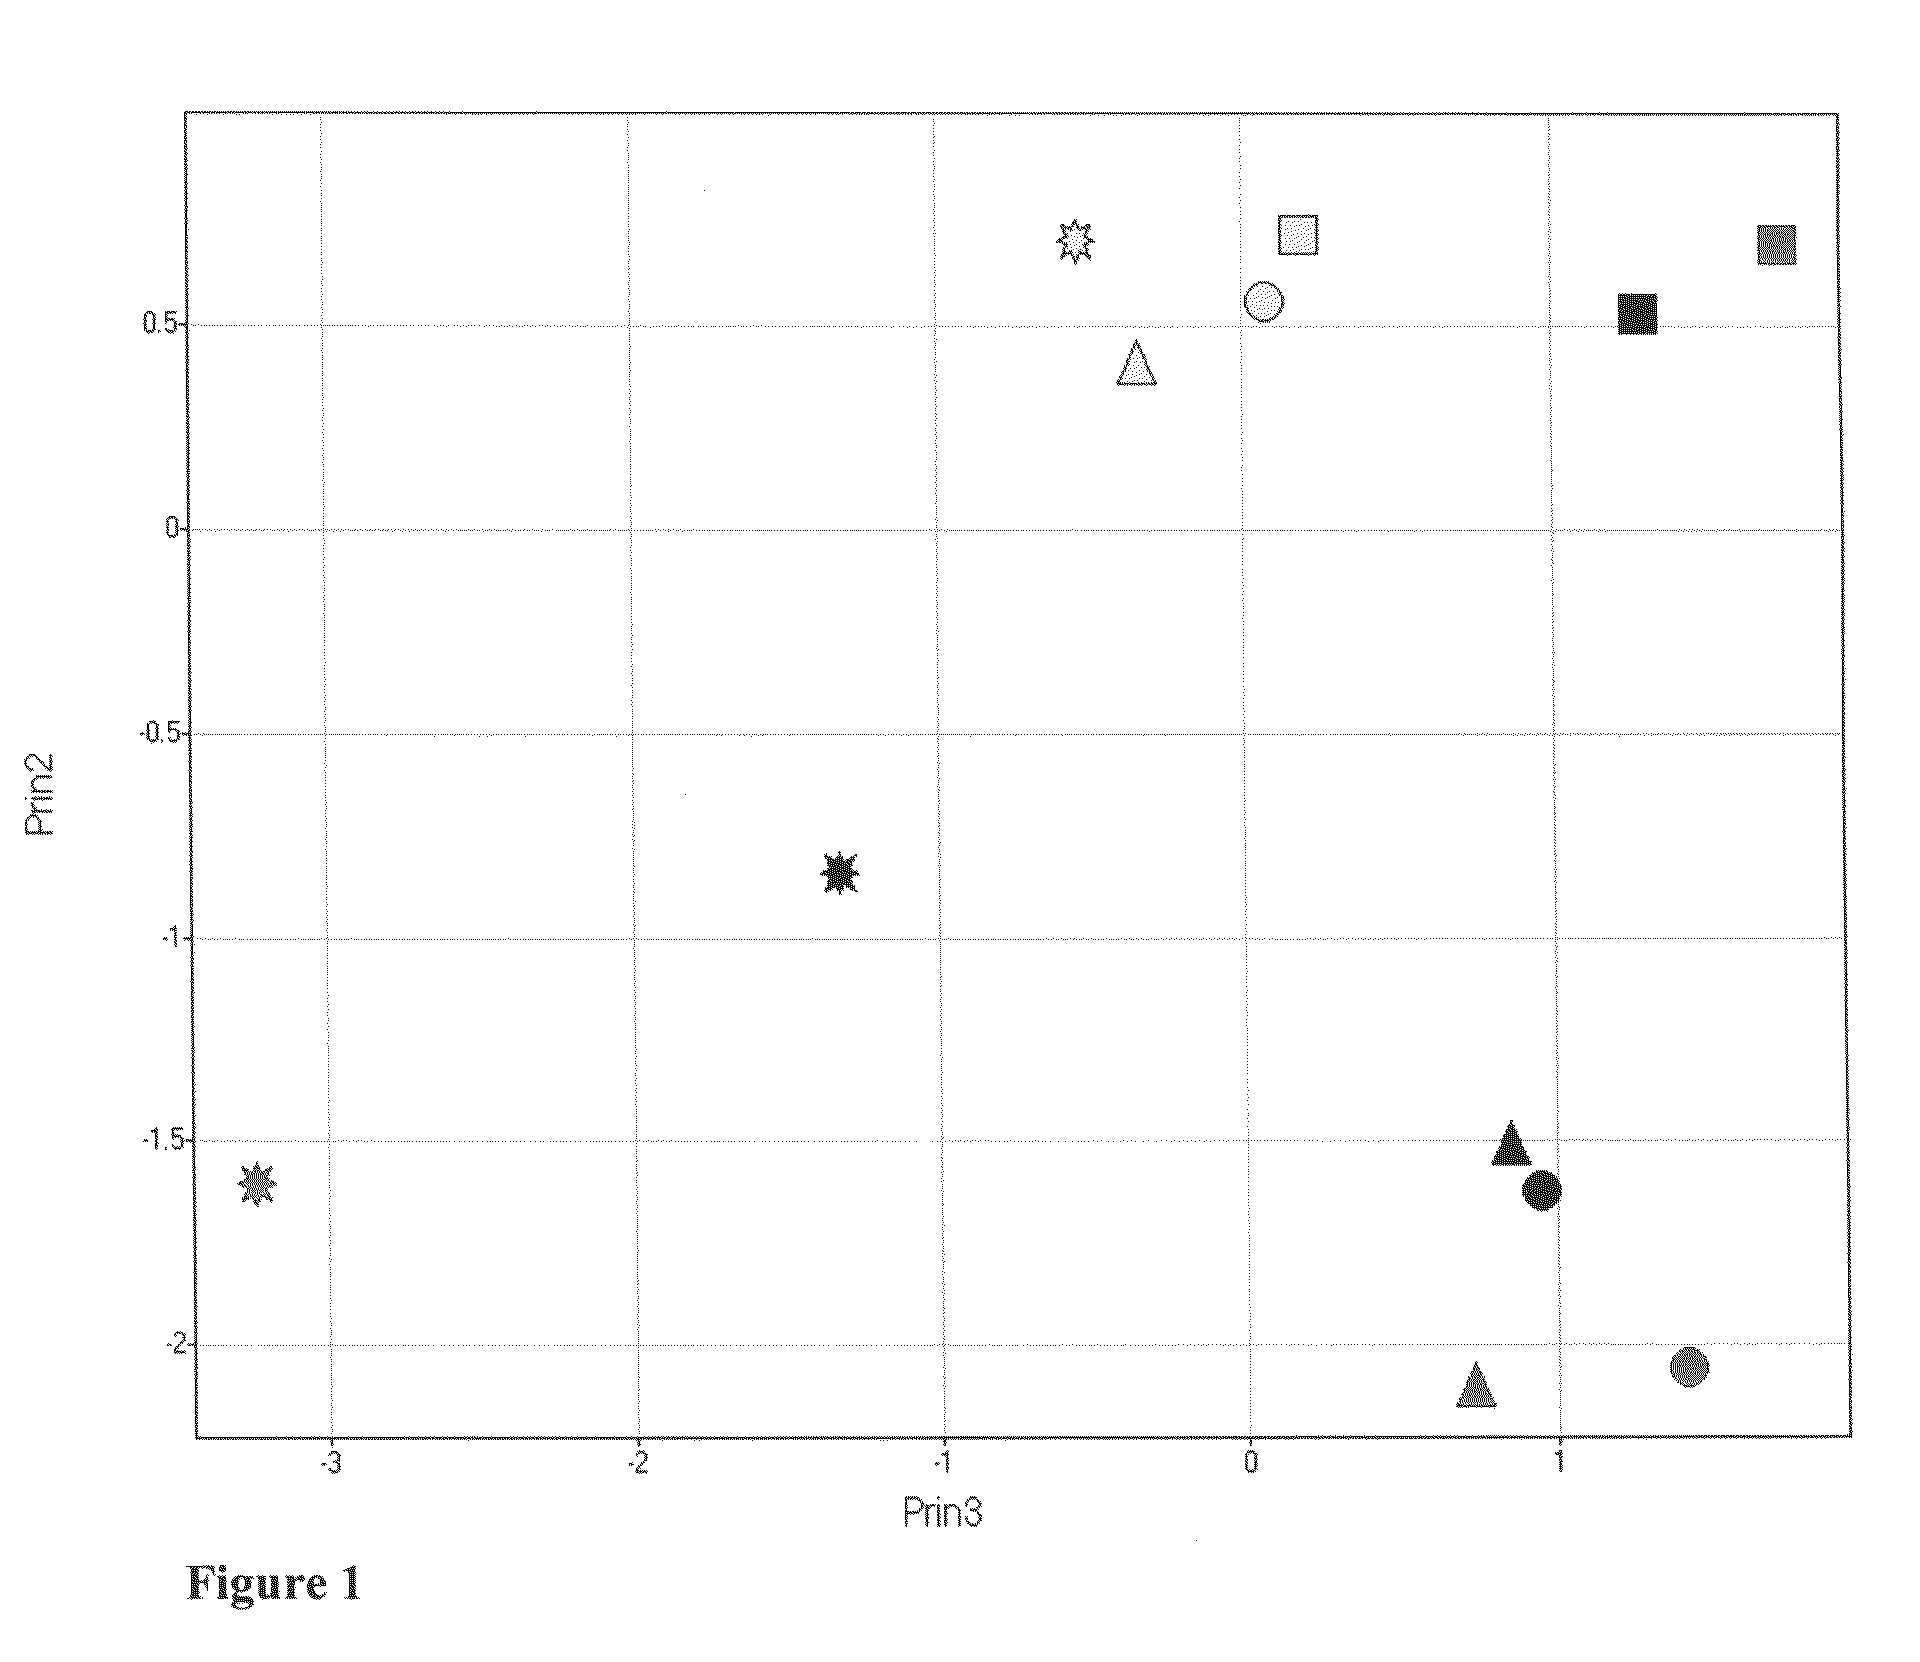
[0039]A targeted list of relative responses for peaks and peaks annotated as known compounds was produced from the LC / MS data for the rat liver samples described in Example 1. The resulting biochemical profiling data was subjected to Principal Component Analysis (PCA), showing trends over both dose and time (see FIG. 1). The third principal component (x-axis) is plotted against the second principal component (y-axis) for each of the 6, 18, 24 and 48 hr time points for acetaminophen does 150 mg / kg (yellow), 1500 mg / kg (black), and 2000 mg / kg (green). Each data point represents the average for six animals.

[0040]Mathematical models of the trends observed in the PCA plot were developed. Two trends were observed in the PCA plot. Trend 1 is a trend of increasing distance from control as the dose increases at any given time point. Trend 2 is a trend of change from one time point to the next that ...

example 3

Data Analysis Methods: Locating a Subset of Most Interest that Corresponds to a Predicted Trend that is not Evident in a Dataset as a Whole

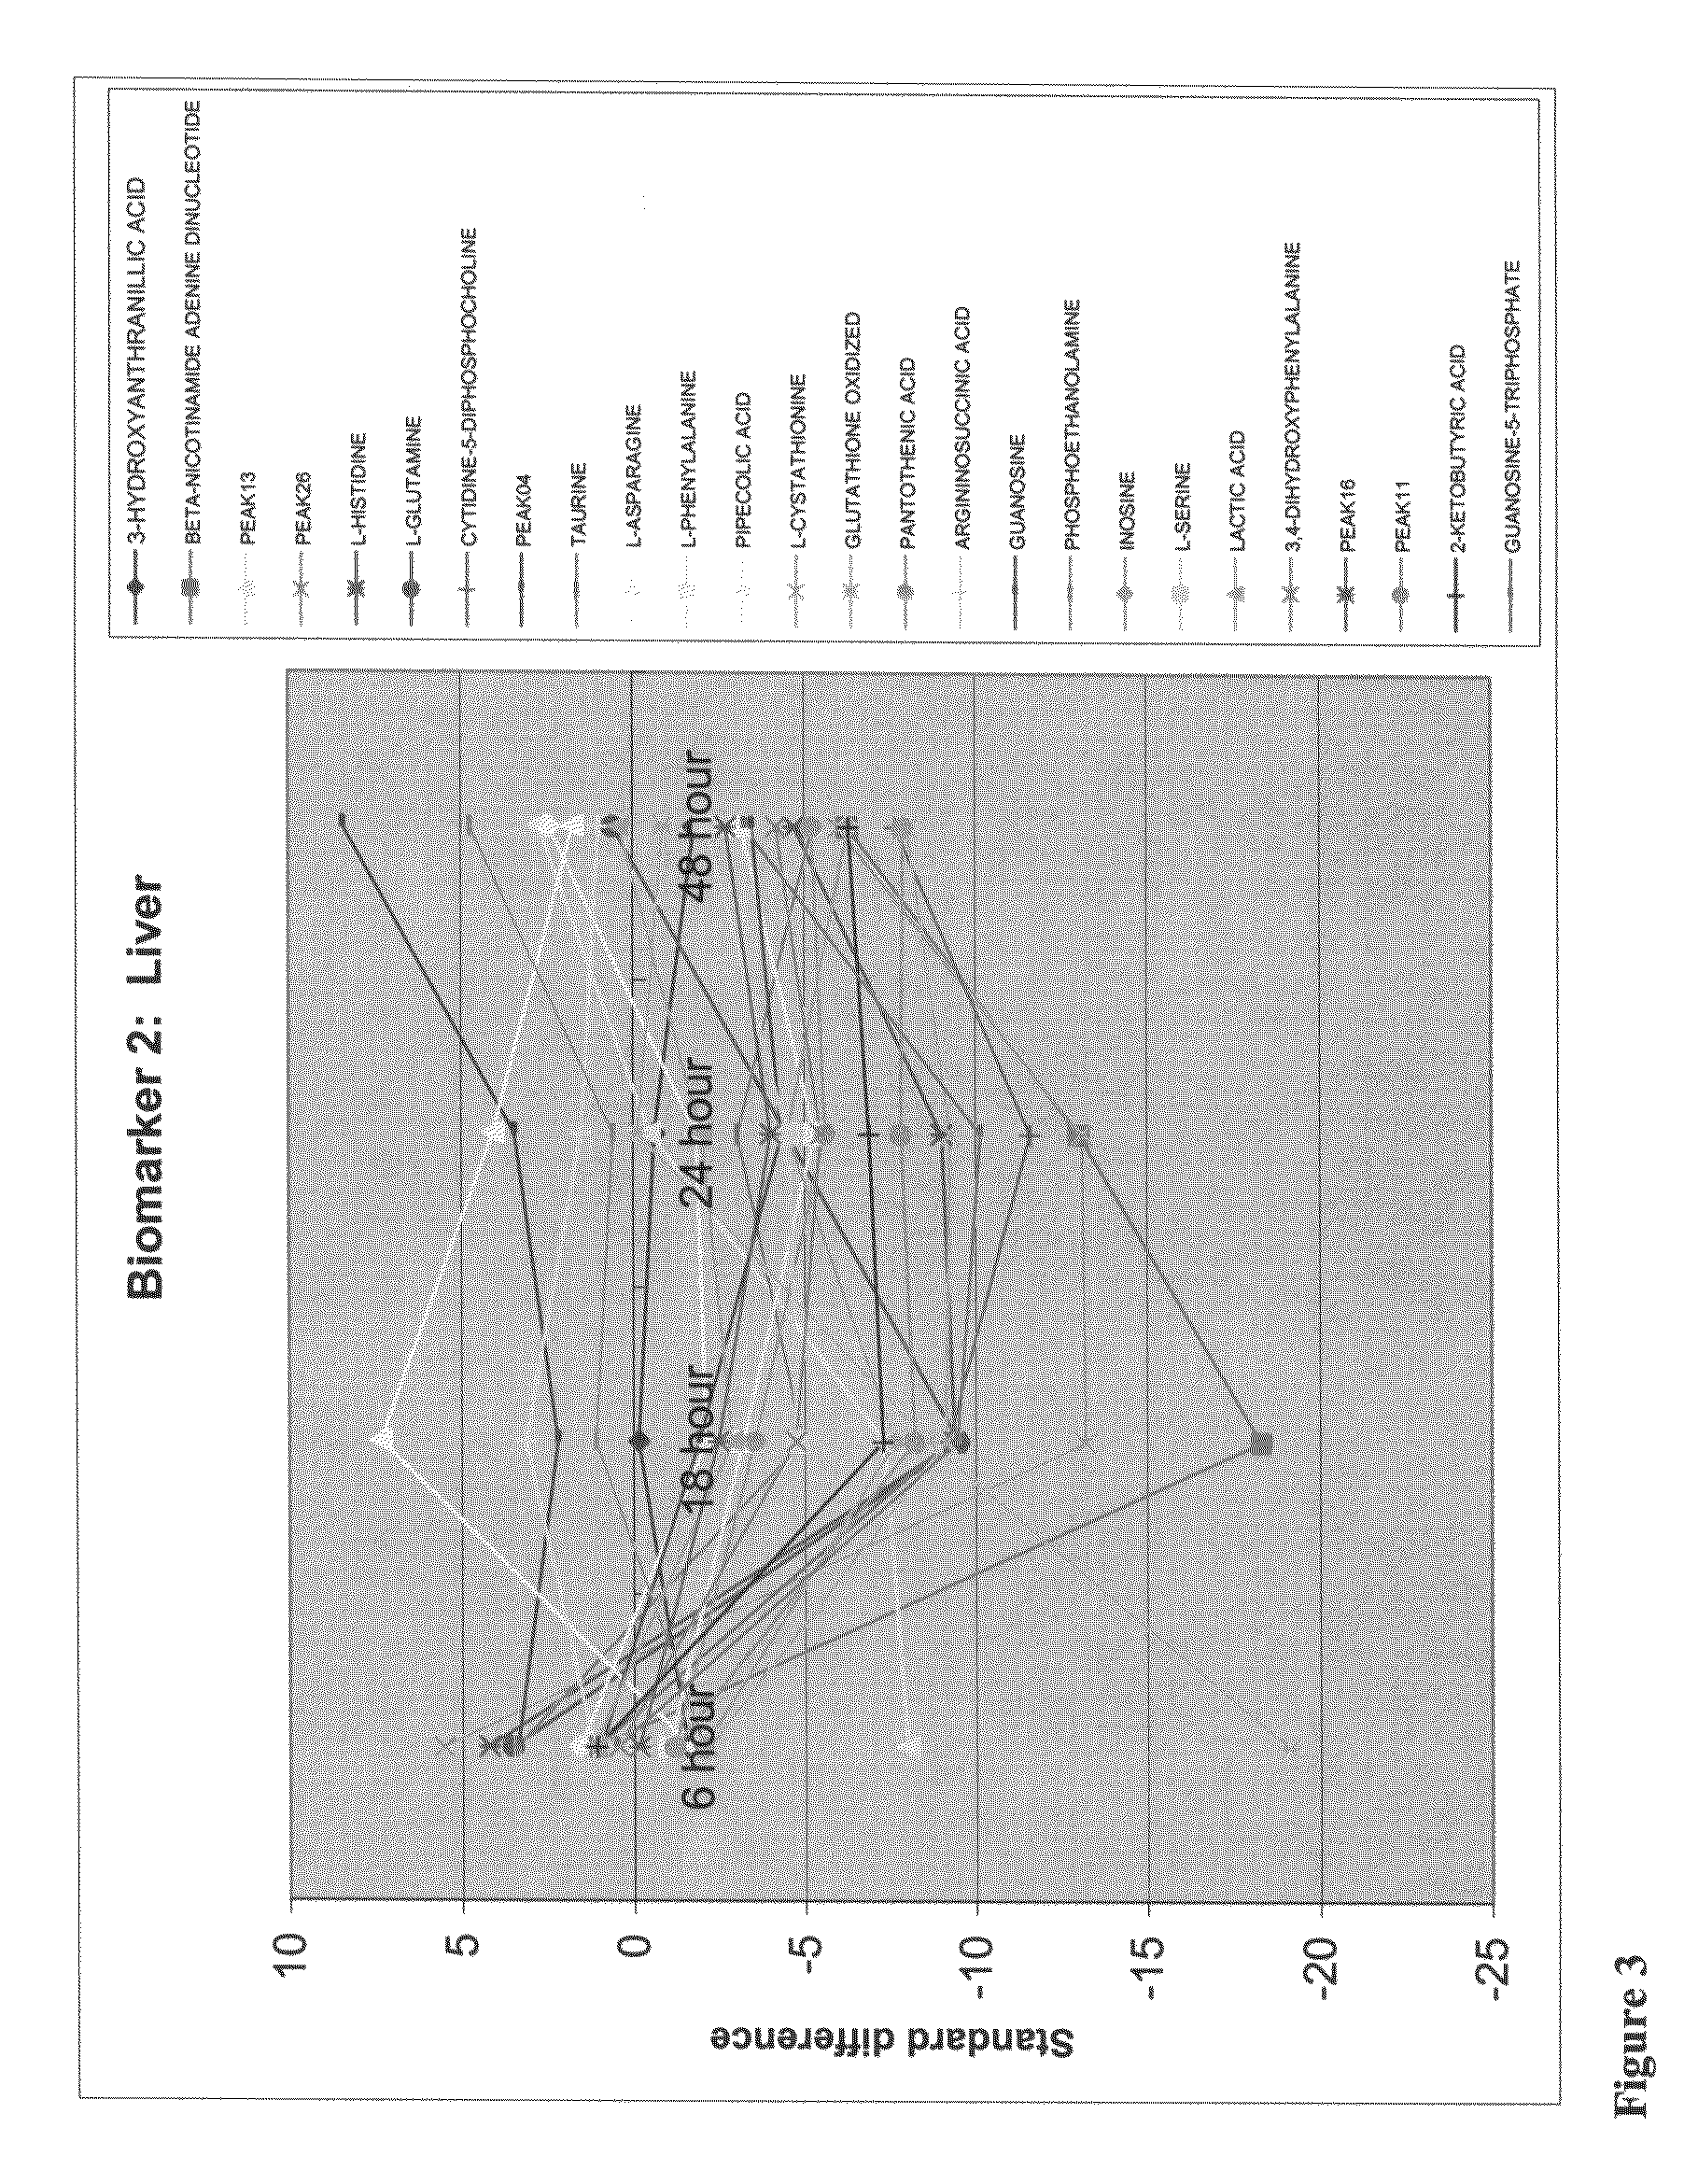
[0042]In this application of the invention, the targeted list of relative responses for peaks and peaks annotated as known compounds from Example 2 was analyzed to identify a subset that adhered to a predicted trend not evident in the dataset as a whole. The predicted trend of interest was a linear response across dose and a linear or quadratic response across time. Mathematical models representing the trend of interest were developed and each of the relative response peaks in the targeted list dataset was tested for adherence to the model. The subset of peaks that adhered to the designated trend is presented in Table II. Each of the compounds corresponding to the peaks in Table II is potentially implicated as having a role or being affected in acetaminophen induced liver toxicity.

[0043]

TABLE IICompounds associated with the mode of actionof aceta...


PUM


Abstract

The present invention provides data analysis methods for the rapid location of subsets of large, multivariable biological datasets that are of most interest for further analysis, for the investigation of molecular modes of action of biological phenomena of interest, and for the identification of sets of data points that best distinguish between experimental groups in larger datasets as putative biomarkers. While existing methods for analyzing large biological datasets generally provide too much information to the user, or not enough, the methods of the present invention entail taking user input on what kinds of trends are of interest and then finding results that match the designated trend. In such manner, the methods of the invention allow a user to quickly pinpoint the subset of data of most interest without a concomitant loss of a large percentage of relevant information, as is typical with standard methods. The methods of the invention allow for identification of molecular entities that are involved in a biological phenomenon of interest, entities that may have otherwise gone undiscovered in a large, multivariable dataset.

Description

CROSS REFERENCE TO RELATED APPLICATION[0001]This application claims the benefit of, and incorporates herein by reference in its entirety, U.S. Provisional Application No. 60 / 572,844, filed May 20, 2004.FIELD OF THE INVENTION[0002]The present invention relates to data analysis methods for locating entities that are associated with a trend of interest in a dataset, in particular, entities such as genes, compounds and proteins. Useful applications of the invention include identification of a subset of data that is of most interest for further analysis and identification of a subset of data that best distinguishes between experimental groups.BACKGROUND OF THE INVENTION[0003]Recent advances in biological experimental techniques have resulted in a dramatic increase in the complexity and quantity of data that is being generated and the technology for generating data has outpaced the technology for helping scientists comprehend the new information contained in the data. For example, gene ex...

Claims


Application Information

Patent Timeline
IPC IPC(8): G01N33/48G16B5/00G16B40/00
CPCG06F19/12G06F19/24G16B5/00G16B40/00
Inventor COFFIN, MARIEALLEN, KEITH D.BULLARD, BRIAN R.HIGGINS, ALAN J.
Owner METABOLON
Why Eureka
Try Eureka