Method for detecting nonyl phenol by exonclease protection fluorescent quantitative PCR

A fluorescence quantification and nonylphenol technology, which is applied in the direction of fluorescence/phosphorescence, microbial measurement/inspection, biochemical equipment and methods, etc., can solve the problems of low sensitivity and high false positive rate, and achieve high sensitivity and detection limit Low, the effect of improving accuracy and sensitivity

Inactive Publication Date: 2010-04-07
DONGHUA UNIV
0 Cites 8 Cited by

AI-Extracted Technical Summary

Problems solved by technology

The traditional enzyme protection analysis method only uses exonuclease ExoIII to analyze the bound DNA directly through agarose...

Method used

[0033] SPR was used to qualitatively identify the combination of estrogen receptor protein and nonylphenol. Surface Plasmon Resonance (SPR) technology has the advantages of label-free, real-time online detection, high sensitivity, non-destructive and high selectivity. The identification results are shown in Figures 1 and 2. As the concentration of the nonylphenol ligand increases, the SPR...

Abstract

The invention relates to a method for detecting nonyl phenol by exonclease protection fluorescent quantitative PCR. The method comprises the following steps: combining the characteristic primer with DNA, nonyl phenol receptor extracted from fish liver and nonyl phenol with different concentrations to form a composite; ensuring the dissociative DNA not to be augmented by resolving the compound by nucleic acid exonclease III and S1 nucleic acid exonclease; taking the product after enzyme cutting as a template, and carrying out fluorescent quantitative PCR augmentation to obtain a regression equation adding nonyl phenol concentration and copy number of an initial template; utilizing quantitative DNA standard curve and linear regression analysis to obtain the relationship between nonyl phenol concentration and a Ct value; and carrying out the detection on the nonyl phenol with different concentrations. The invention has the characteristics of high sensitivity and low detection limit, and can be used for rapidly detecting the content of the nonyl phenol in a large quantity of samples.

Application Domain

Microbiological testing/measurementFluorescence/phosphorescence

Technology Topic

S1 nucleaseFish liver +8

Image

  • Method for detecting nonyl phenol by exonclease protection fluorescent quantitative PCR
  • Method for detecting nonyl phenol by exonclease protection fluorescent quantitative PCR
  • Method for detecting nonyl phenol by exonclease protection fluorescent quantitative PCR

Examples

  • Experimental program(1)

Example Embodiment

[0026] Example 1
[0027] 1. Extraction of nonylphenol receptor and preparation of receptor-ligand complex
[0028] 1. Extraction of cytosol containing nonylphenol receptors
[0029] Goldfish with similar body length and weight were first sterilized with 5% saline solution, and then domesticated in the laboratory for a week with tap water that had been naturally dechlorinated for 3 days. During the domestication process, feed once a day and aerate with a sand head. One week later, nonylphenol was added to make the concentration of nonylphenol in the water 0.01mg/L. During the feeding process, the static fluid replacement method was adopted and replaced every 24 hours. After one month of domestication, the goldfish were taken out and anesthetized with 5 mg/L benzocaine. Take the liver, wash off the blood outside the liver with 0.15mol/L KCl solution pre-cooled on ice, then blot the surface water with sterilized filter paper, and add HEDG buffer (pre-cooled on ice) was homogenized in a glass homogenizer. The homogenate was centrifuged at 12000 g for 20 min, and the supernatant was collected. Then centrifuge at 16000g for 1 hour, carefully absorb the supernatant, which is the cytosol containing the receptor, and store it at -80°C after aliquoting.
[0030] 2. Preparation and purification of nonylphenol receptor-nonylphenol complex
[0031] Dilute 1 g/L nonylphenol to 0.1 g/L-1 ng/L by 10 times, take 10 μl each, add 250 μl of the above-mentioned extracted cytosol, and incubate at 20° C. for 2 h with shaking. When the ligand-receptor reaction is over, add 0.2ml of 60% HAP and mix well, keep in ice bath for 30min, mix well every 10min, so that HAP can fully adsorb the receptor protein, centrifuge at 3500g, 4°C for 1min, and discard the supernatant. Add 1 ml of HEDG buffer solution containing 0.05% T-80 to the precipitated particles, mix and wash, and centrifuge for 15 min under the same conditions. Repeat 3 times, after discarding the supernatant for the last time, add 0.4ml of 0.2mol/L phosphate buffer solution, shake intermittently three times, then centrifuge for 15min, and take the supernatant. At this point the solution is a relatively pure ligand-receptor complex. The effect of receptor ligand purification was identified by vertical plate electrophoresis.
[0032] 3. Identification of receptor-ligand complex
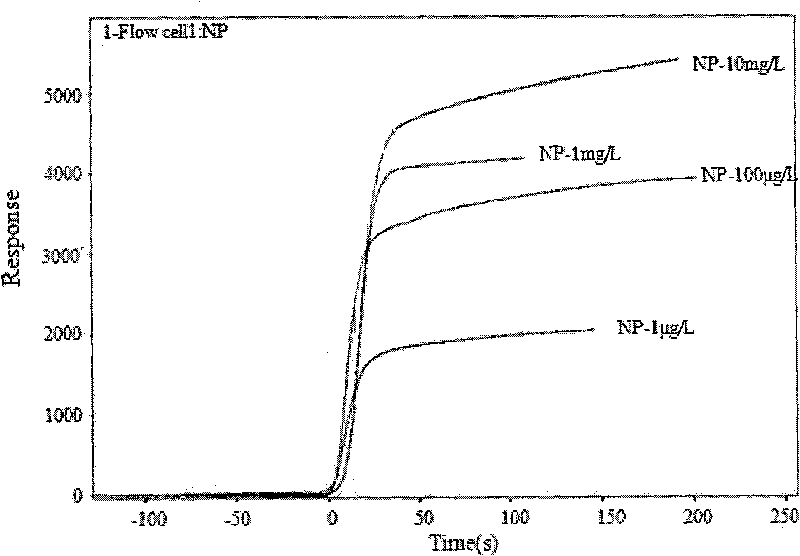
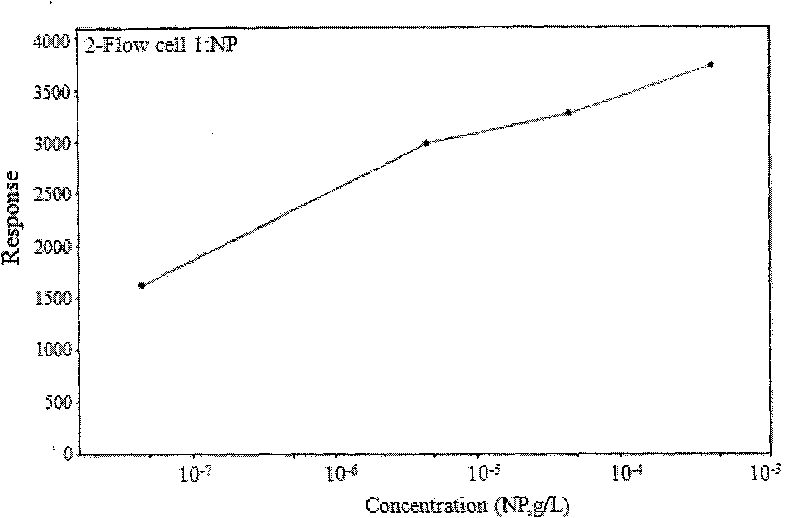
[0033]The combination of estrogen receptor protein and nonylphenol was qualitatively identified by SPR. Surface Plasmon Resonance (SPR) technology has the advantages of label-free, real-time online detection, high sensitivity, non-destructive and high selectivity. See the attached figure 1 , 2 , with the increase of the concentration of nonylphenol ligand, the intensity of SPR response of the receptor-ligand complex was enhanced. After adding nonylphenol standard solution concentration is 10 -8 ~10 -2 In the g/L range, there is a good linear relationship between the concentration of nonylphenol ligand and the SPR response intensity of the receptor-ligand complex. It shows that nonylphenol has a good binding degree with estrogen receptor within this range.
[0034] 2. Preparation of receptor-ligand-binding DNA complexes and exonuclease digestion
[0035] 1. Preparation of binding DNA
[0036] The pUC19 plasmid was diluted 50 times as a template, and the combined DNA was amplified by conventional PCR method. Use primerpremier5.0 primer design software to design upstream and downstream primers containing response elements (underlined part). The primer sequence is as follows: Upstream primer F1: 5' CGGAG TTCCG TGAGA AGAG G ATAAC GCAGG AAAGA ACATG 3' downstream primer F2: 5' CTCTT CTCAC GCAAC TCCG G TCAGG CAACT ATGGA TGAAC 3'. The product was separated by electrophoresis on a 1% agarose gel, and purified and recovered with a PCR product rapid purification kit.
[0037] 2. Preparation of receptor-ligand-binding DNA complex
[0038] Take 20 μl from each of the above tubes into a 1.5ml EP tube, add 1 μg poly(dI.dC) and incubate at 20°C for 15 minutes, then add 2 μl of bound DNA, and continue to incubate at 20°C for 15 minutes. At this time, the solution is receptor- Ligand-DNA complex.
[0039] 3. Exonuclease digestion
[0040] Take 12 μl of receptor-ligand complex, add 2 μl of ExoIII buffer, 6 μl of HEDG buffer to make the volume 20 μl, mix well and incubate at 37° C. for 15 minutes. Then add ExoIII 100U, mix well and incubate at 37°C for 15min. Take 5 μl of the digested product, add 15 μl of S1 mixed solution (50 U), and incubate at 37° C. for 30 min. Add 1 μl of S1 stop solution (0.3mol/L Tris base, 1.35mol/L EDTA) and inactivate at 70°C for 10min. Get the template for fluorescent quantitative PCR.
[0041] 3. Establishment of standard curve for detection of nonylphenol by fluorescent quantitative PCR
[0042] 1. Quantitative standard curve
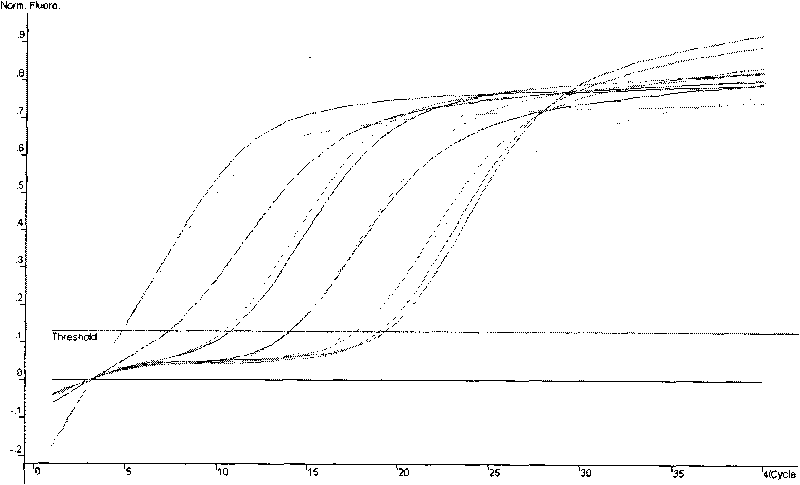
[0043] Fluorescent quantitative PCR amplification was performed with different dilutions of standard templates. Fluorescent quantitative PCR amplification conditions: every 20 μl system contains SYBR Green I Master mix 10 μl (MgCl 2 The optimal concentration is 2 μmol/L), 1 μl of primer R1 (10 μmol/L), 1 μl of primer R2 (10 μmol/L), 2.5 μl of template, and 5.5 μl of sterilized double distilled water. Fluorescent quantitative PCR cycle steps: pre-denaturation at 94°C for 5 min, denaturation at 94°C for 30 s, annealing at 55°C for 30 s, extension at 72°C for 1 min, and 40 cycles. A final extension was performed at 72°C for 5 min. Use the logarithmic fitting of the Ct value and its corresponding different quantitative templates to make a graph, where the abscissa represents the initial copy number of different quantitative templates, and the ordinate represents the Ct value, and a quantitative standard curve is obtained, see the attached image 3 , 4 and Table 1. at 10 3 -10 8 In the range of copies/μl, there is a good linear relationship between the Ct value and the logarithm of the starting template concentration. The relationship between the two is y(Ct)=-3.008x (the logarithm of the initial copy value of the template)+28.855, and the correlation coefficient R 2 = 0.99120.
[0044] Table 1 The initial copy number and Ct value of different quantitative templates of the standard curve
[0045]
[0046] 2. SYBR Green I fluorescence quantitative PCR detection of DNA induced by different concentrations of nonylphenol
[0047] The complexes prepared with different concentrations of nonylphenol and estrogen receptor-binding DNA were treated with restriction enzyme protection and used as fluorescent quantitative PCR templates for amplification. According to the standard curve, the Ct values ​​corresponding to different concentrations of nonylphenol were converted into initial copy numbers, and the nonylphenol dose-effect relationship was obtained as follows: y (logarithm of nonylphenol concentration)=1.6455x (standard DNA copy number Logarithm of )+9.523. In the receptor-NP-binding DNA complex, the concentration of nonylphenol was added at 10 -8 ~10 -2 In the g/L range, there is a good linear relationship between the concentration of nonylphenol and the content of bound DNA. Combine standard curve and nonylphenol and Ct value dose-response relationship, obtain the relation of Ct value and adding nonylphenol concentration: y (Ct)=-1.828x (nonylphenol concentration logarithmic value)+11.447, R 2 = 0.99523. See attached Figure 5 , 6 and Table 2.
[0048] Table 2 Initial copy number and Ct value of complex template induced by different concentrations of nonylphenol
[0049]

PUM

no PUM

Description & Claims & Application Information

We can also present the details of the Description, Claims and Application information to help users get a comprehensive understanding of the technical details of the patent, such as background art, summary of invention, brief description of drawings, description of embodiments, and other original content. On the other hand, users can also determine the specific scope of protection of the technology through the list of claims; as well as understand the changes in the life cycle of the technology with the presentation of the patent timeline. Login to view more.

Similar technology patents

Method for measuring bromate content in drinking water

PendingCN114814070AImprove sensitivity and accuracySolve the problem that the accuracy of test results is not high
Owner:GONGBEI CUSTOMS TECH CENT

Classification and recommendation of technical efficacy words

  • Improve sensitivity and accuracy
  • high sensitivity

Method for measuring focal plane uniformity of exposure machine

ActiveCN101650534AOvercome the monotony of graphicsImprove sensitivity and accuracy
Owner:SHANGHAI HUAHONG GRACE SEMICON MFG CORP

Temperature controller and temperature control method of power battery of electric car

InactiveCN103078156AAvoid temperature measurement limitationsImprove sensitivity and accuracy
Owner:SHENZHEN GREENWHEEL ELECTRIC VEHICLE CO LTD

System and method for optical coherence imaging

ActiveUS20060055936A1sufficient signal to noise ratiohigh sensitivity
Owner:THE GENERAL HOSPITAL CORP

Three-axis integrated MEMS accelerometer

InactiveUS20060272413A1low costhigh sensitivity
Owner:VAGANOV VLADIMIR +1

Capacitive micromachined acoustic transducer

ActiveUS20060233401A1wide bandwidthhigh sensitivity
Owner:NEOMEMS TECH INC WUXI CHINA

Patterning process, resist composition, and acetal compound

InactiveUS20110236826A1high dissolution contrasthigh sensitivity
Owner:SHIN ETSU CHEM CO LTD
Why Eureka
Try Eureka