Oligonucleotides chain-based mercury ion fluorescent detection chip, manufacturing method thereof and using method thereof
An oligonucleotide and fluorescence detection technology, applied in the field of biological analysis, can solve the problems of being unsuitable for high-throughput detection and cumbersome operation, and achieve the effects of less reagent consumption, simple production method, and low cost
- Summary
- Abstract
- Description
- Claims
- Application Information
AI Technical Summary
Problems solved by technology
Method used
Image
Examples
Embodiment 1
[0030] Example 1: Preparation of Hg using Probe A and Probe B 2+ Detection chip.
[0031] Probe A was formulated into a solution with a concentration of 20 μM, then mixed with the same volume of Spotting Solution, and arrayed on the surface of an aldehyde-modified glass slide with the microarray chip production system of Cartesian Company, placed at room temperature, 70% relative Store in humidity for 48-72h for fixation, then immerse the slide in 0.2% SDS at room temperature and shake for a few minutes, then immerse in pure water for a few minutes, then immerse in 0.2% SDS twice, each time for 2min, and then immerse in pure water Twice, 2min each time, let dry. Hybridization solution (10mM MOPS, 100mM NaNO 3 , pH 7.2) Probe B was diluted to a final concentration of 2-5 μM, dropped on the chip, covered with a coverslip, and hybridized at room temperature for 12-16 hours. Then wash with 0.2% SDS, 2×SSC, 0.2×SSC for 3 minutes, and dry it for later use.
Embodiment 2
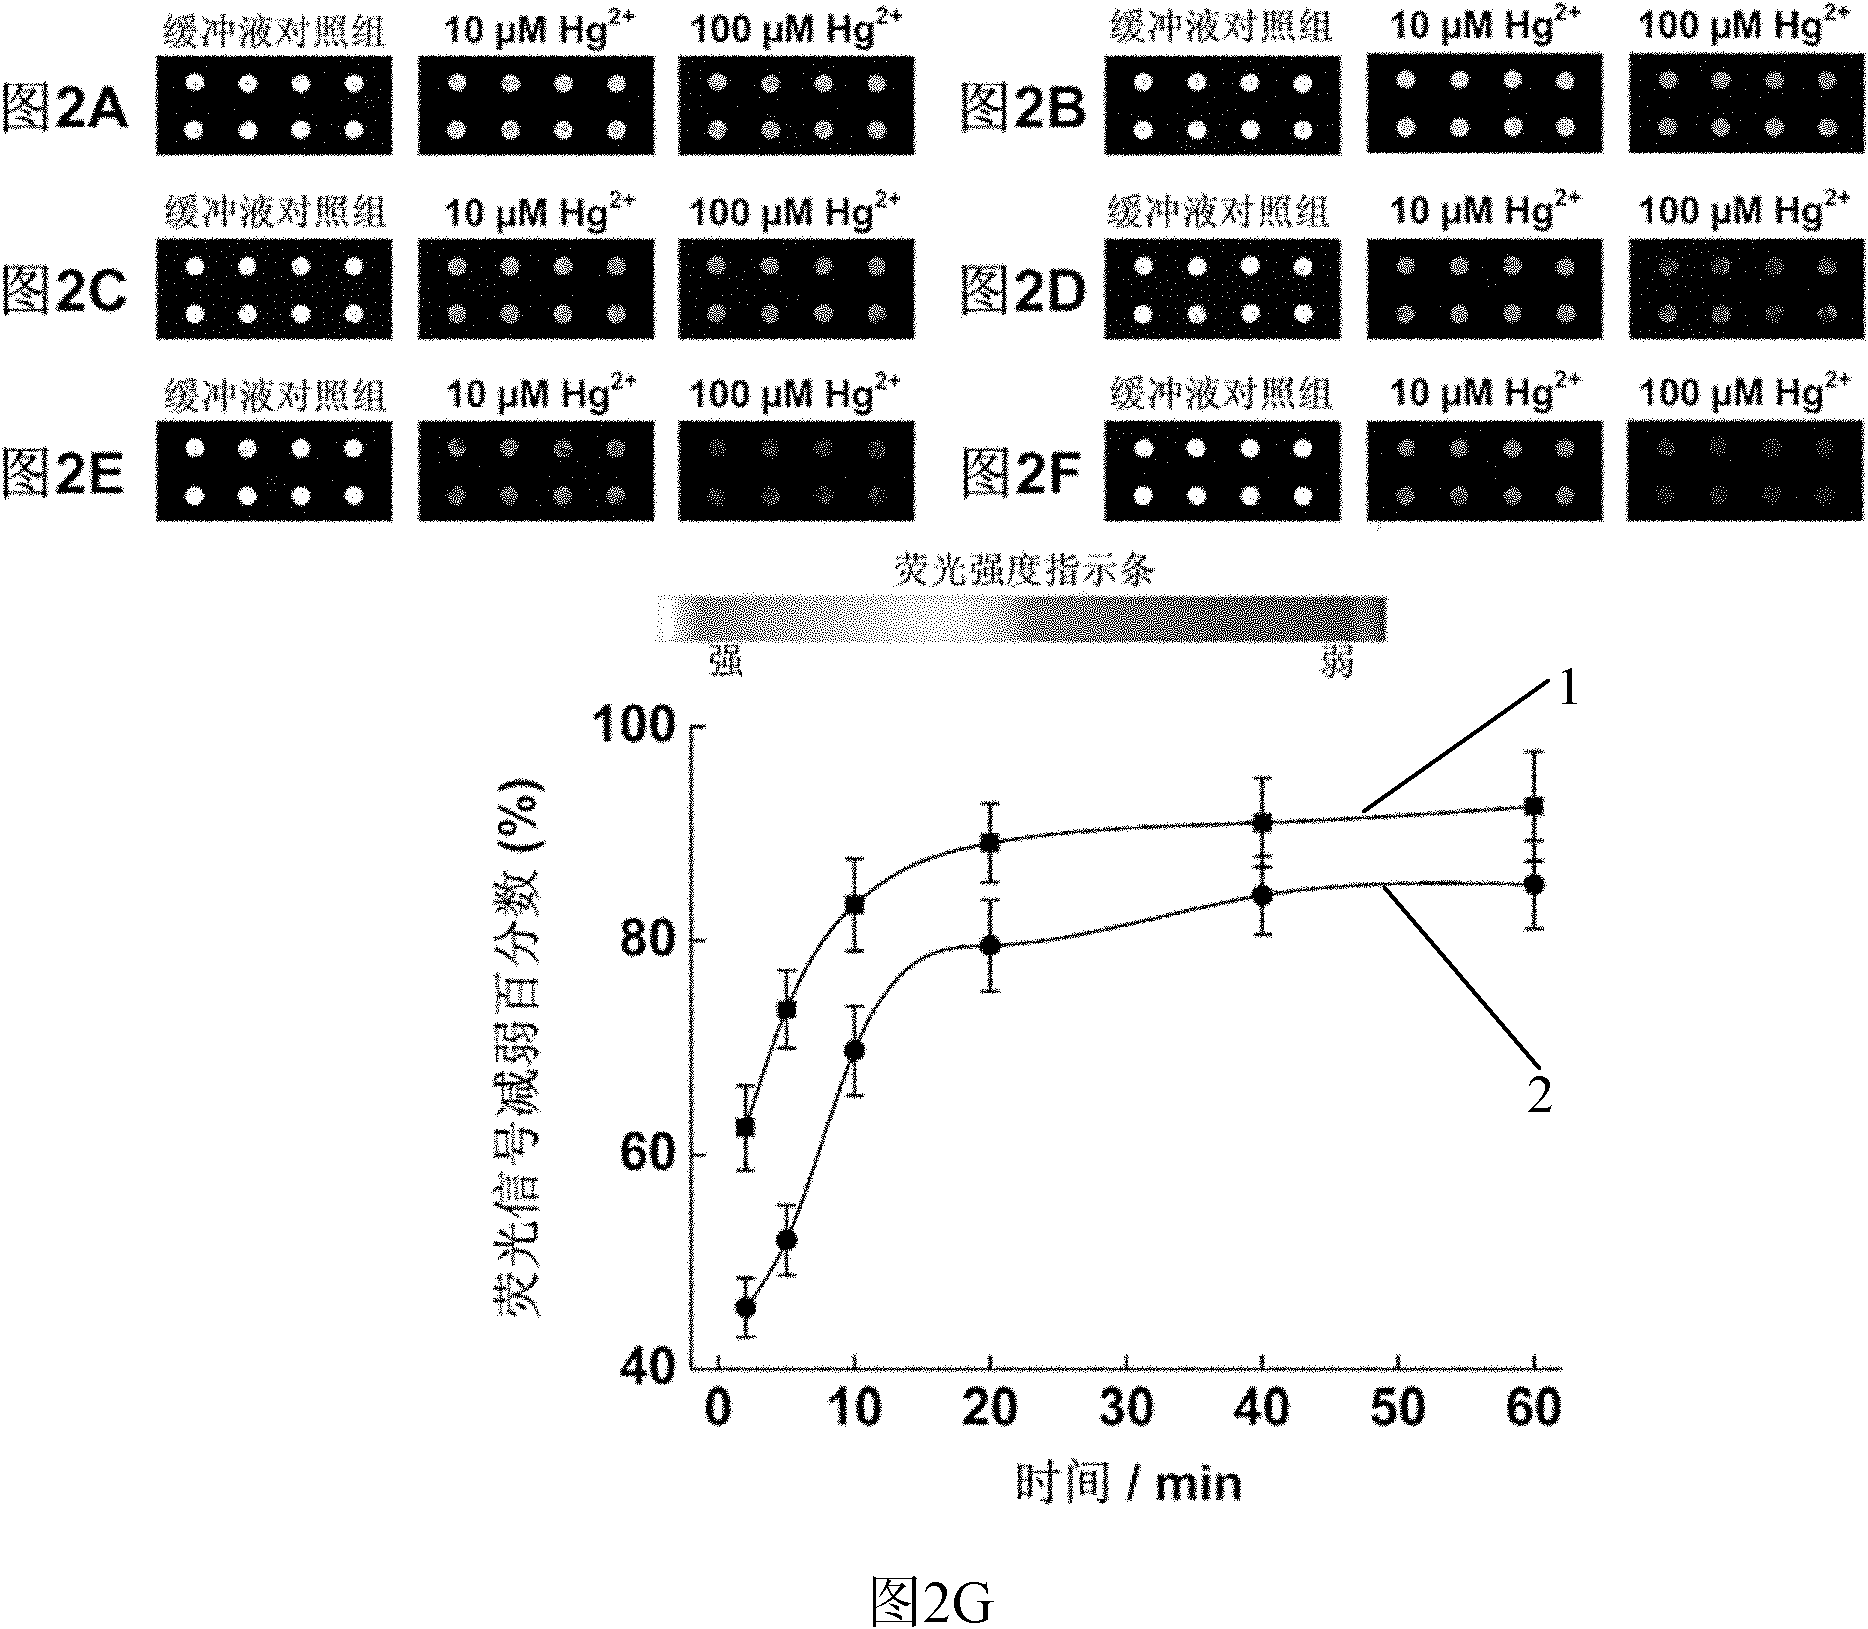
[0032] Example 2: Using the chips prepared by probe A and probe B to investigate Hg 2+ reaction time kinetics.
[0033] With 10mM MOPS, 100mM NaNO 3 , pH 7.2 diluted to prepare 100μM, 10μM Hg 2+ , the Hg 2+ The solution is added to the prepared chip spots. React at room temperature for 1 hour, take out the chip, and use 10mM MOPS, 100mM NaNO 3 , pH 7.2 buffer washed 3 times and dried. Scan the photos with the chip signal analysis system Scanarray 3000 of General Scanning Company ( figure 2 A-F) and analyze the results ( figure 2 G).
[0034] The results showed that Hg 2+ Inducing the release of probe B is a rapid process, adding 100 μM, 10 μM Hg 2+ After 2 minutes of reaction, compared with the buffer control group, the fluorescence intensity decreased by 63% and 45%, respectively. 95% of the reaction was basically completed in 20 minutes.
Embodiment 3
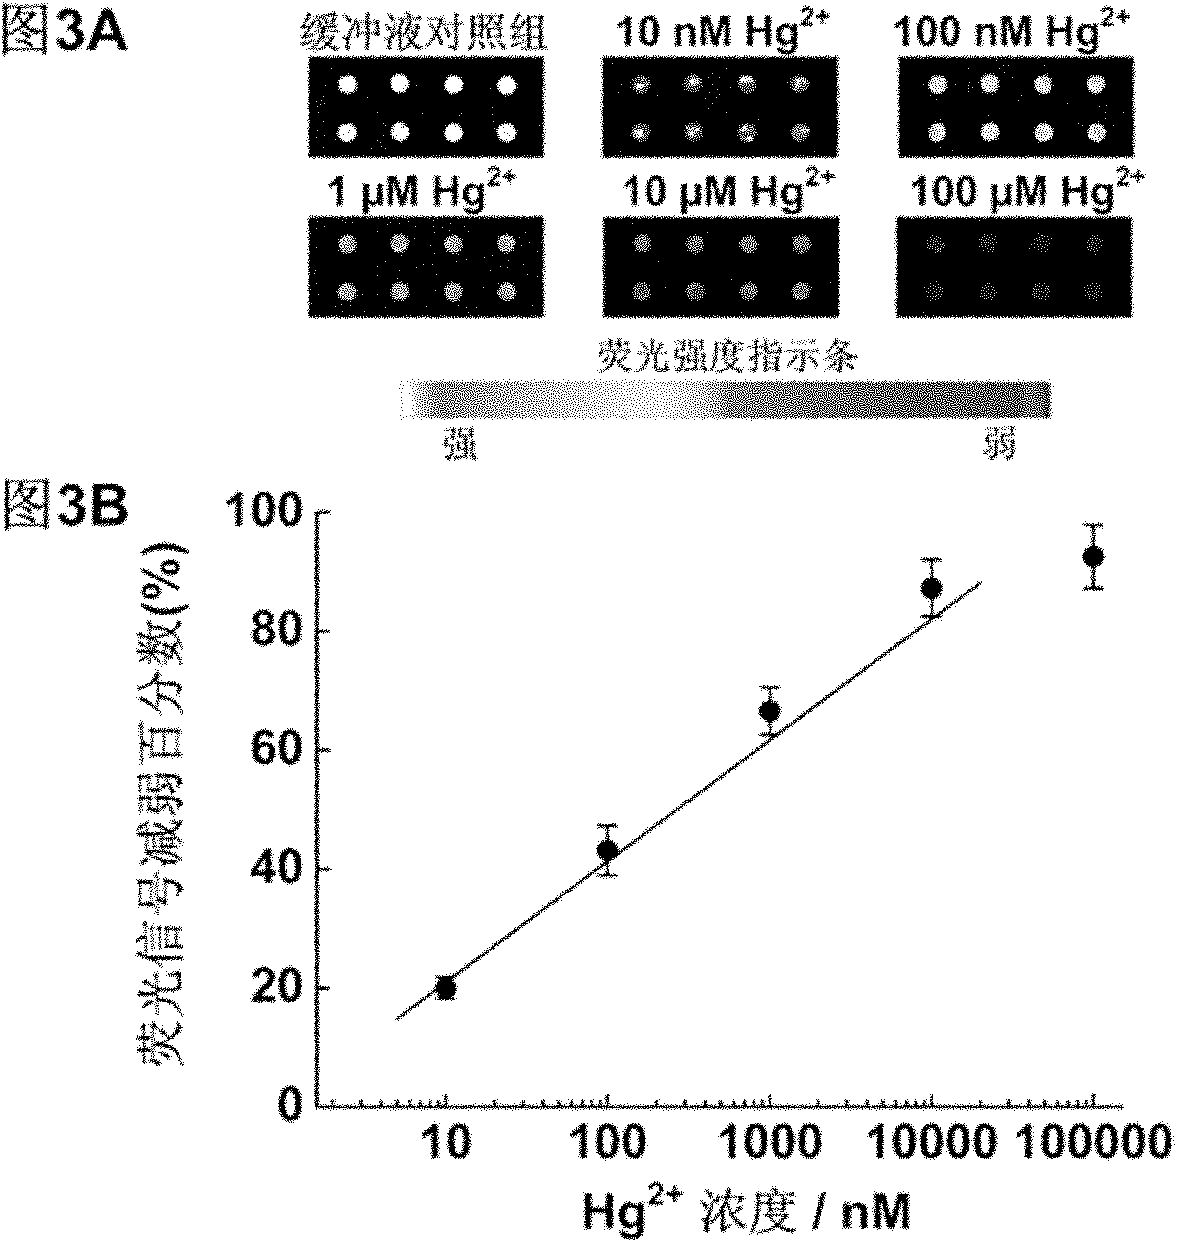
[0035] Embodiment 3: Utilize the chip prepared by probe A and B to detect different concentrations of Hg 2+ .
[0036] With 10mM MOPS, 100mM NaNO 3 , pH 7.2 diluted to prepare different concentrations of Hg 2+ , plus different concentrations of Hg 2+ The solution was placed on the prepared chip spots at room temperature and reacted for 1 h. With 10mM MOPS, 100mM NaNO 3 , pH 7.2 buffer washed 3 times and dried. Scan the photos with the chip signal analysis system Scanarray 3000 of General Scanning Company ( image 3 A) and analyze the results ( image 3 B).
[0037] The results showed that in Hg 2+ In the presence of ions, the fluorescence intensity at the chip spot weakens, when Hg 2+ When the concentration is 10nM, compared with the fluorescence intensity of the buffer group, the fluorescence intensity at the spot is weakened by 20%, with the increase of Hg 2+ As the concentration increases, the fluorescence signal gradually decreases. Calculated as three times the...
PUM
 Abstract
Description
Claims
Application Information
 - R&D
- Intellectual Property
- Life Sciences
- Materials
- Tech Scout
- Unparalleled Data Quality
- Higher Quality Content
- 60% Fewer Hallucinations
Browse by: Latest US Patents, China's latest patents, Technical Efficacy Thesaurus, Application Domain, Technology Topic, Popular Technical Reports.
© 2025 PatSnap. All rights reserved.Legal|Privacy policy|Modern Slavery Act Transparency Statement|Sitemap|About US| Contact US: help@patsnap.com


