Quantitative and self-calibrating chemical analysis using paper-based microfluidic systems
A microfluidic system, paper-based technology, applied in the field of quantitative chemical analysis systems, can solve problems such as result variation, colorimetric analysis result error, etc.
- Summary
- Abstract
- Description
- Claims
- Application Information
AI Technical Summary
Problems solved by technology
Method used
Image
Examples
Embodiment 1
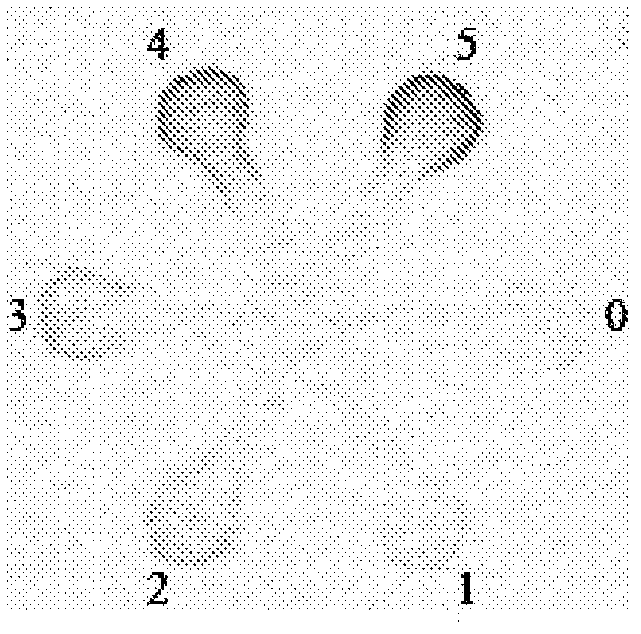
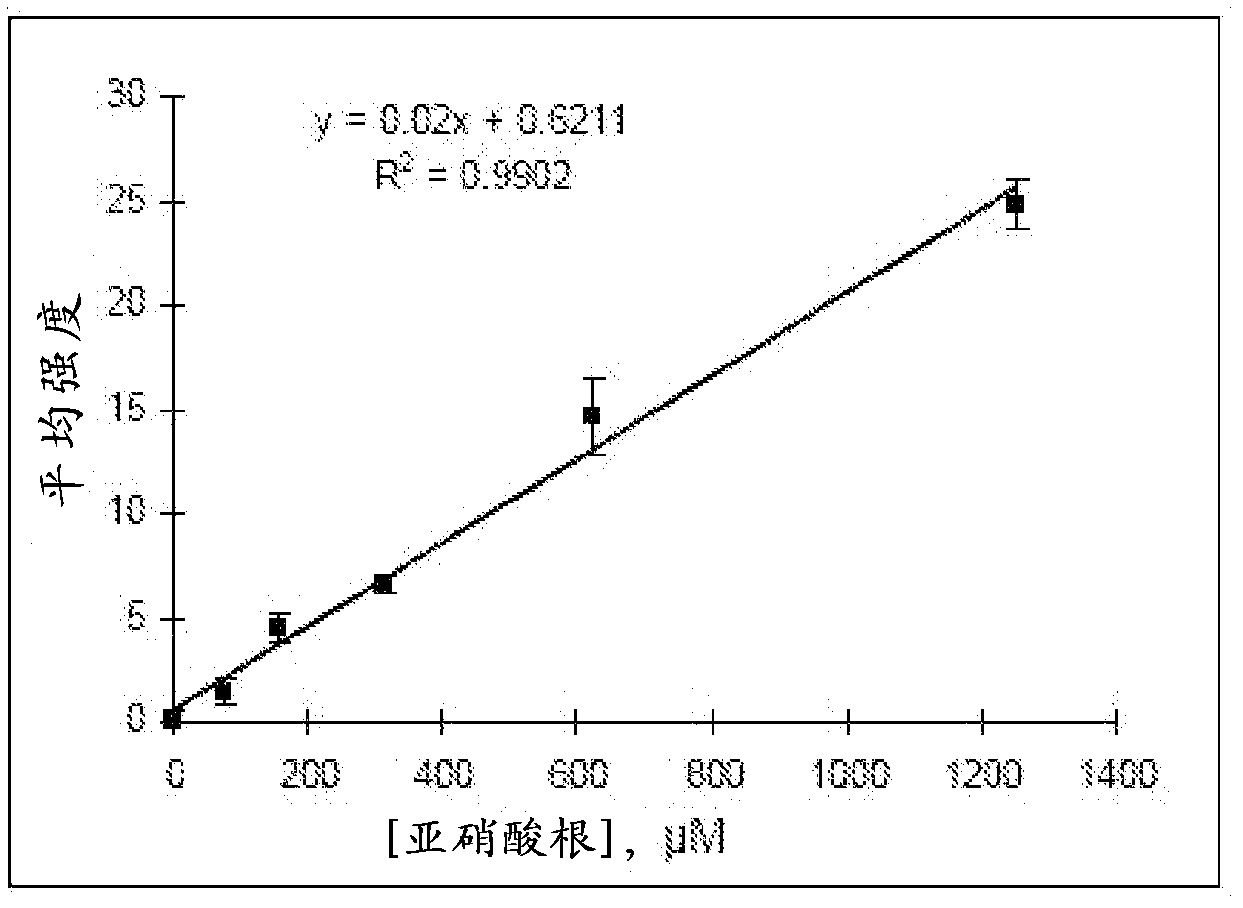
[0042] In this example, if figure 1 and 2 NO 2 - Calibration curve. NO 2 - The colorimetric test is based on the mechanism of the Griess reaction, which is NO 2 - commonly used quantitative measurement methods. In this assay, serially diluted NO 2 - Standard solutions (78, 156, 312, 625, 1250 μmol / L) were sequentially applied to each detection area 1-5, and a blank control solution was spotted on detection area 0. then NO 2 - The indicator solution is introduced into the device via the inlet zone. When the indicator solution penetrates into the test area due to capillary action and contacts with the analyte, the citric acid in the indicator solution converts NO 2 - converted to HNO 2 - . The nitrous acid then converts sulfonamide to diazotized sulfonamide, which couples with N-(1-naphthyl)ethylenediamine to form a pink azo compound. Due to the varying concentrations of the standard solution samples, the resulting color displayed in each assay zone varied from...
Embodiment 2
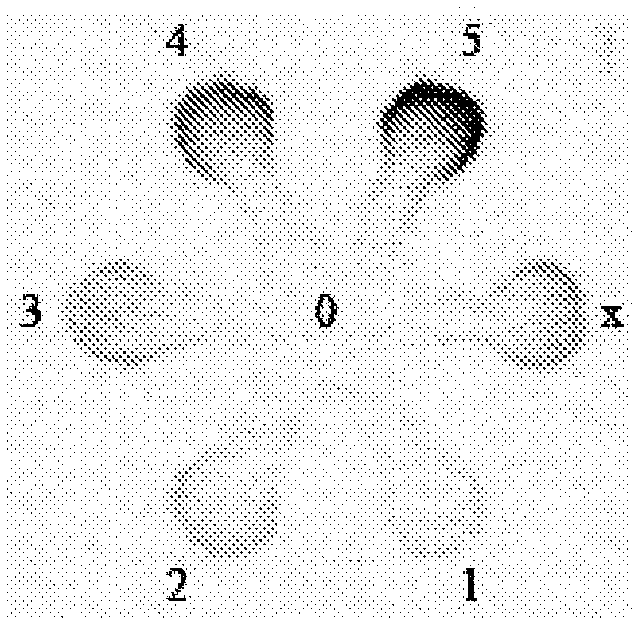
[0045] In this example, an unknown sample was measured for NO 2 - concentration. A blank control solution (0 μmol / L NO 2 - , applied on zone 0), 5 standard solutions (156, 312, 625, 1250, 2500μmol / L NO 2 - , applied on zones 1-5) and 500 μmol / L NO as a putative unknown sample solution 2 - solution (applied on zone x). Still introducing the indicator solution into the system from the central inlet area, it shows different colors in the different test areas ( image 3 ). In this assay, 6 independent tests were performed using 6 microfluidic systems, which provided the average color intensity and error bars for each standard solution to generate a calibration curve ( Figure 4 ), which gives the quadratic regression equation for calculating the unknown sample concentration. As long as the measured concentrations are close to the true values, the paper-based microfluidic system is considered to be an effective tool for the quantitative analysis of analyte concentrations ...
Embodiment 3
[0047] In this example, if Figure 5 and 6 The UA concentration of the unknown sample is measured as shown.
[0048] The colorimetric determination of uric acid is based on the bicinchoninate (biquinoline dicarboxylate) chelation method. When the UA indicator solution enters the detection area, the Cu(II) in the indicator solution is reduced to Cu(I) by the UA pre-loaded on the test area, and then the cuprous ion forms a purple chelate with biquinoline dicarboxylate sodium Combined product. Corresponding to different UA concentrations (0, 100, 200, 400, 800, 1600 μmol / L), the resulting colors displayed in test zones 0-5 gradually darkened from light purple to purple ( Figure 6 ). The data and error bars in Figure 7 are the mean and relative standard deviation, respectively, of 6 independent measurements performed using 6 devices. A sample solution having 500 μmol / L uric acid was prepared, and assuming that this solution was an unknown sample, this sample was also applied...
PUM
 Abstract
Description
Claims
Application Information
 - R&D
- Intellectual Property
- Life Sciences
- Materials
- Tech Scout
- Unparalleled Data Quality
- Higher Quality Content
- 60% Fewer Hallucinations
Browse by: Latest US Patents, China's latest patents, Technical Efficacy Thesaurus, Application Domain, Technology Topic, Popular Technical Reports.
© 2025 PatSnap. All rights reserved.Legal|Privacy policy|Modern Slavery Act Transparency Statement|Sitemap|About US| Contact US: help@patsnap.com


