Method for quantitatively analyzing solid phase dispersion distribution in semi-solid slurry tissue
A technology of semi-solid slurry and dispersion distribution, which is applied in special data processing applications, instruments, electrical digital data processing, etc. It can solve the problems that cannot quantitatively evaluate the degree of solid phase distribution of semi-solid slurry tissue, and achieve good performance and use Convenience and easy operation
- Summary
- Abstract
- Description
- Claims
- Application Information
AI Technical Summary
Problems solved by technology
Method used
Image
Examples
Embodiment 1
[0026] Embodiment 1: The specific steps of the method for the quantitative analysis of the solid phase dispersion distribution in the semi-solid slurry tissue of the present embodiment are:
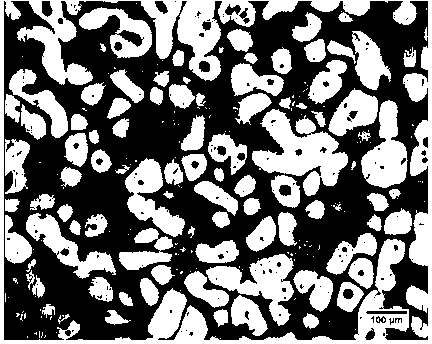
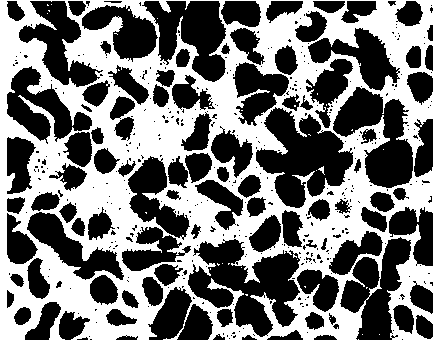
[0027] (1) According to the structure photo of the semi-solid slurry, the solid-liquid two phases in the structure are distinguished, and the solid phase is separated by binary processing on the picture; in this example, the semi-solid structure to be analyzed is a tin-bronze alloy ,Such as figure 1 As shown, use photoshop and Image J software to figure 1 The solid phase of the semi-solid tissue shown is separated and processed, and the results are as follows figure 2 As shown, the black area is the solid phase;
[0028] (2) Count the number of solid phases and calculate the total area of solid phases, calculate the average area of each solid phase, and then draw the same area as the statistical number and the average area of each solid phase on the photo of the original tissue o...
Embodiment 2
[0030] Embodiment 2: The specific steps of the method for the quantitative analysis of the solid phase dispersion distribution in the semi-solid slurry tissue of the present embodiment are:
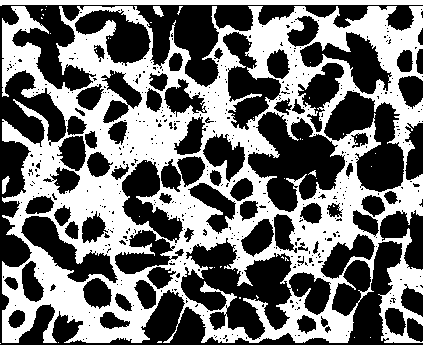
[0031] (1) According to the tissue photo of the semi-solid slurry, the solid-liquid two phases in the tissue are distinguished, and the solid phase is separated by dyeing the picture; in this example, the semi-solid tissue to be analyzed is an aluminum-silicon alloy, such as Figure 5 As shown, the result is as Image 6 As shown, the black area is the solid phase;
[0032] (2) Count the number of solid phases and calculate the total area of solid phases, calculate the average area of each solid phase, and then draw the same area as the statistical number and the average area of each solid phase on the photo of the original tissue of the semi-solid slurry The same circles, each circle is distributed in an ideal dispersed state of semi-solid particles. In this example, use Image J so...
PUM
 Abstract
Description
Claims
Application Information
 - R&D
- Intellectual Property
- Life Sciences
- Materials
- Tech Scout
- Unparalleled Data Quality
- Higher Quality Content
- 60% Fewer Hallucinations
Browse by: Latest US Patents, China's latest patents, Technical Efficacy Thesaurus, Application Domain, Technology Topic, Popular Technical Reports.
© 2025 PatSnap. All rights reserved.Legal|Privacy policy|Modern Slavery Act Transparency Statement|Sitemap|About US| Contact US: help@patsnap.com


