Qualitative and semi-quantitative analysis method for sample detection by ion mobility spectrometry
A technology of ion mobility spectrometry and quantitative analysis, applied in the field of qualitative and semi-quantitative analysis of samples detected by ion mobility spectrometry, to achieve the effects of easy portability, easy correction, and simple measurement methods
- Summary
- Abstract
- Description
- Claims
- Application Information
AI Technical Summary
Problems solved by technology
Method used
Image
Examples
Embodiment 1
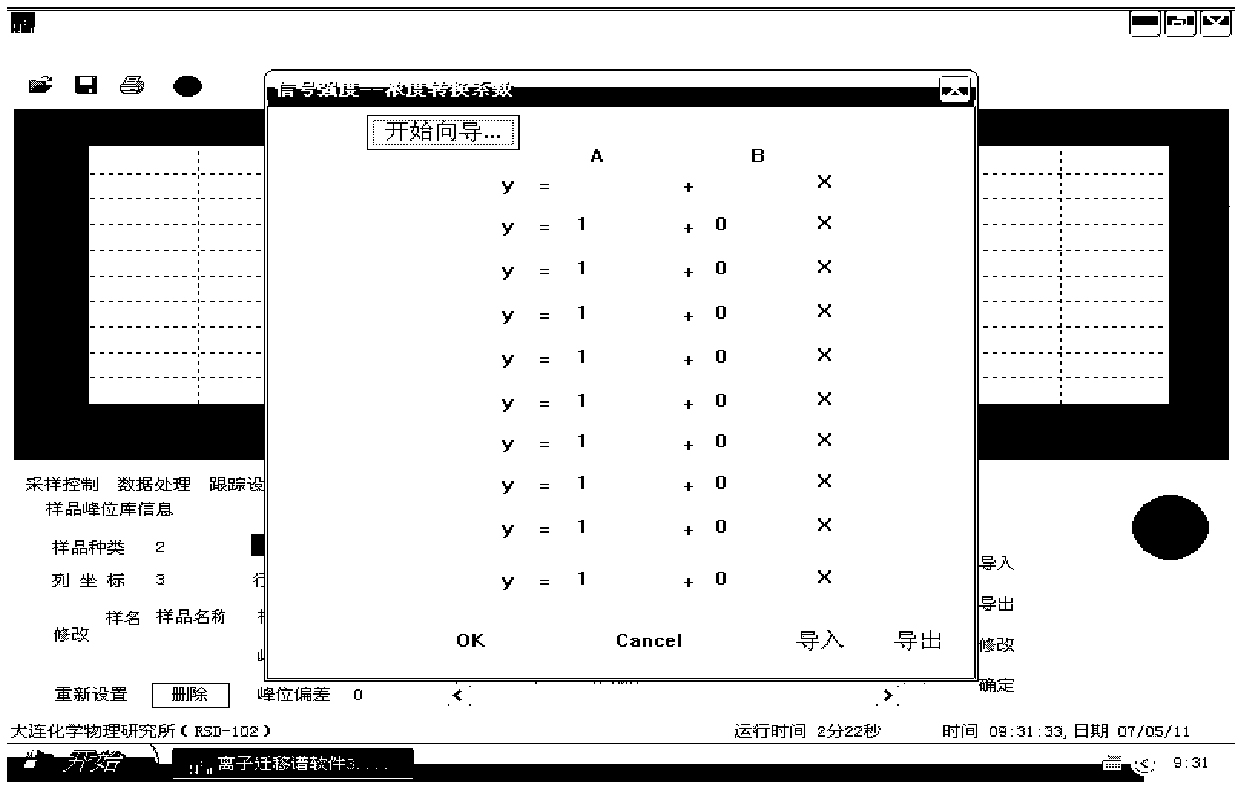
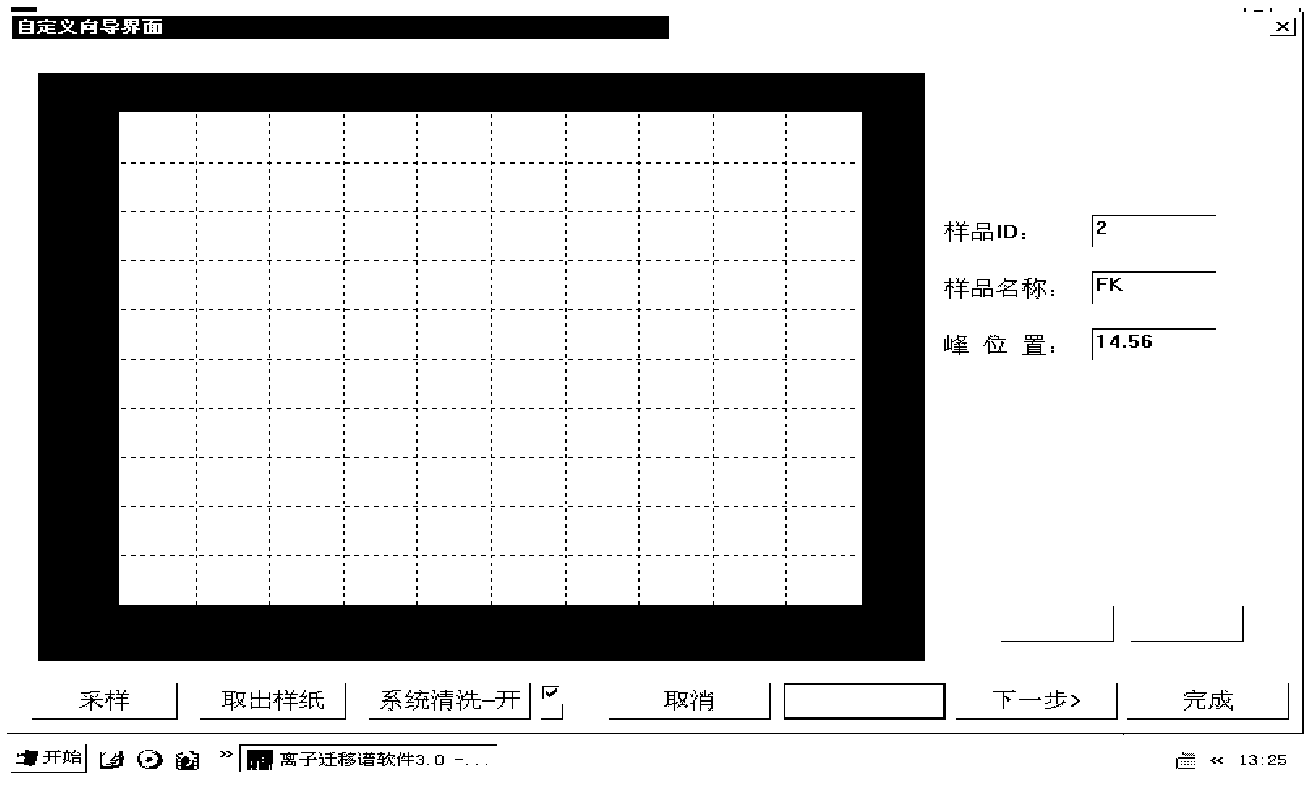
[0041] In the present invention, the FK (fentanyl citrate anesthetic) sample is taken as an example to illustrate the qualitative analysis of the ion mobility spectrum and determine the peak time of the sample. according to Figure 1-3 The interface asks for relevant information to be entered.
[0042] During the experiment, the transfer tube temperature was 100°C, the injector temperature was 180°C, and the carrier gas (air) and drift gas (air) flow rates were 400mL / min and 600mL / min, respectively. The sampling piece containing the sample enters the ion mobility spectrometer for analysis after the solvent is evaporated by the heater at 50°C.
Embodiment 2
[0044] Take 1μL of 0.5ppm, 1ppm, and 5ppm respectively with a 1μL microsampler, which is 0.5ng, 1ng, and 5ng; use a 5μL microsampler to take 2μL, 4μL, and 6μL of 10ppm fentanyl citrate anesthetic samples respectively , 8μL, that is, 20ng, 40ng, 60ng, 80ng; the test was first carried out between 0.5-80ng, and finally determined that the semi-quantitative analysis range of FK samples was between 1-60ng. The sampling piece containing the sample enters the ion mobility spectrometer for analysis after the solvent is evaporated by the heater at 50°C. 0.5ng and 80ng are not within the linear range of quantitative analysis.
[0045] The experimental ion mobility spectra of FK samples with different injection amounts (1ng, 5ng, 20ng, 40ng, 60ng) (data are repeated 4 times). Figure 9 Shown is the quantitative relationship curve of the ion mobility spectrometer to the FK sample in the range of 1-60ng. The fitted relational expression is y=1.3451+0.4044x. The quantitative effect of th...
Embodiment 3
[0047] Figure 12 It is the terminal alarm software interface. The alarm indicator light on the left, the red light shows that the sample to be tested is found, and the upper toolbar shows the semi-quantitative analysis value.
[0048] Such as Figure 12 Shown: 50ppm solution, injection volume 1μL (ie 50ng). The software alarm shows 53ng, and the relative deviation of this test is less than 10%.
[0049] Therefore, the quantitative determination of FK samples is feasible under the above conditions. Higher concentration samples can be quantitatively analyzed by diluting between 1-60ng.
PUM
 Abstract
Description
Claims
Application Information
 - R&D
- Intellectual Property
- Life Sciences
- Materials
- Tech Scout
- Unparalleled Data Quality
- Higher Quality Content
- 60% Fewer Hallucinations
Browse by: Latest US Patents, China's latest patents, Technical Efficacy Thesaurus, Application Domain, Technology Topic, Popular Technical Reports.
© 2025 PatSnap. All rights reserved.Legal|Privacy policy|Modern Slavery Act Transparency Statement|Sitemap|About US| Contact US: help@patsnap.com


